. 2014 Nov;198(3):905-17.
doi: 10.1534/genetics.114.169243. Epub 2014 Aug 29.

Thiol peroxidase deficiency leads to increased mutational load and decreased fitness in Saccharomyces cerevisiae

Affiliations

Thiol peroxidase deficiency leads to increased mutational load and decreased fitness in Saccharomyces cerevisiae

Alaattin Kaya et al. Genetics. 2014 Nov.

Abstract

Thiol peroxidases are critical enzymes in the redox control of cellular processes that function by reducing low levels of hydroperoxides and regulating redox signaling. These proteins were also shown to regulate genome stability, but how their dysfunction affects the actual mutations in the genome is not known. Saccharomyces cerevisiae has eight thiol peroxidases of glutathione peroxidase and peroxiredoxin families, and the mutant lacking all these genes (∆8) is viable. In this study, we employed two independent ∆8 isolates to analyze the genome-wide mutation spectrum that results from deficiency in these enzymes. Deletion of these genes was accompanied by a dramatic increase in point mutations, many of which clustered in close proximity and scattered throughout the genome, suggesting strong mutational bias. We further subjected multiple lines of wild-type and ∆8 cells to long-term mutation accumulation, followed by genome sequencing and phenotypic characterization. ∆8 lines showed a significant increase in nonrecurrent point mutations and indels. The original ∆8 cells exhibited reduced growth rate and decreased life span, which were further reduced in all ∆8 mutation accumulation lines. Although the mutation spectrum of the two independent isolates was different, similar patterns of gene expression were observed, suggesting the direct contribution of thiol peroxidases to the observed phenotypes. Expression of a single thiol peroxidase could partially restore the growth phenotype of ∆8 cells. This study shows how deficiency in nonessential, yet critical and conserved oxidoreductase function, leads to increased mutational load and decreased fitness.

Keywords: Saccharomyces cerevisiae; genome stability; mutation; thiol peroxidase.


Figures

Figure 1
Figure 1
Deletion of eight thiol peroxidases causes growth defects and reduces life span in yeast. (A) Decreased colony growth of ∆8 cells. Overnight cultures of WT, ∆3, ∆5, and two independent ∆8 isolates were diluted to an OD600 of 0.3. Then, 5 µl of 10-fold dilution of each cell suspension was spotted onto YPD plates and photographed 3 days later. (B) Reduced cell growth of ∆8 cells. Growth of WT and ∆8 cells in liquid YPD medium was monitored by measuring the OD600. (C) Increased division time of ∆8 cells. Division time (in minutes) was calculated for each strain and plotted. (D) Replicative life span of WT and ∆8 cells. Numbers in brackets next to each strain indicate mean life span. The y-axis represents the fraction of survivors (fraction of mother cells capable of budding) at each generation (x-axis).
Figure 2
Figure 2
Quantification of mutations in multiple thiol peroxidase mutants. (A) Mutational landscape of thiol peroxidase mutants. Genome sequencing revealed 24 mutations in ∆3, 91 in ∆5, 2290 in ∆7 (all peroxidases lacking except for Gpx2), and 2643 in ∆8 cells. (B) Mutations identified in the mutant strains represented by Venn diagram. Mutation distribution is shown for three strains: ∆3 Gpx (blue), ∆5 Prx (green), and ∆8 strain (red). The number of mutations was calculated using the GATK procedure, and the common mutations were identified by comparing the sets of mutations among the strains. (C) Number of mutations of each type in the original ∆8 strain. Number of mutations was calculated by dividing the number of detected mutations by the total number of bases in the reference genome sequence.
Figure 3
Figure 3
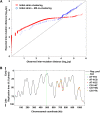
Mutation clustering in ∆8 cells. (A) Observed vs. expected distances between adjacent mutations. Observed distances are the distances between consecutive mutations on the same chromosome in the initial stain. To calculate the expected distances between mutations, we generated 100 sets of randomized genomic positions, each with the same number of loci as the number of mutations in the initial strain. We further calculated the distances between adjacent loci in each randomized set (as we did for the observed mutations) and averaged the distances across the 100 randomized iterations. Both observed and expected distances were sorted by increasing distance and plotted against each other (red circles). The diagonal represents equal expected and observed distances. As can be seen, most mutations were much closer to each other than expected by chance while mutational clusters were themselves very distant from other clusters, leading to the long tail of higher-than-expected intramutation distances. This indicates a very strong clustering of mutations along the genome. The distances between mutations in the MA lines and the nearest mutations in the initial strain were also calculated and compared to a set of 100 randomized genomic positions, each with the same number of loci as the number of mutations in the MA lines, as above. The observed vs. expected distances between MA line and initial strain mutations are shown in blue circles. Mutations in the MA lines tended to fall closer to initial strain mutation clusters than expected by chance. (B) An example of mutation clusters on chromosome VII of the original ∆8 strain. Shown is the DNA replication timing profile of the chromosome (black line; high values represent early replication, low values late replication; peaks correspond to replication origins and valleys to replication termini). The different mutation types are shown as dots along the replication profile. Two very tight mutation clusters can be observed (at ∼640–755 kb and at ∼980–1010 kb) with almost no mutations outside these two clusters. Similar plots for all chromosomes, with the locations of mutations in both the initial strain and the MA lines, are shown in Figure S2B.
Figure 4
Figure 4
Experimental design of the mutation accumulation experiment. The ∆8 strain was obtained by mating ∆3 and ∆5 cells, followed by deletion of the remaining peroxidase gene (Gpx2). The genomes of initial WT and ∆8 cells were sequenced, and cells (seven MA lines for ∆8 and three MA lines for WT cells) were subjected to a bottleneck process: colonies were grown for 4 days from an individual cell on solid media followed by growth for 3 days in liquid culture. This process was repeated 50 times over the course of 1 year, followed by genome sequencing of final cell populations. One of ∆8 lines was split into two lines following 100 generations, after which they were treated as independent MA lines.
Figure 5
Figure 5
Decreased fitness of MA lines. Twenty individual virgin daughter cells were collected for corresponding WT and ∆8 MA lines and analyzed by using a microscope with a micromanipulator to determine replicative life span. Statistical analysis of the life-span data were performed using a Wilcoxon rank-sum test. P-value data for this experiment are in Table S2. (A) Replicative life span of WT initial (green line) and WT MA lines (black lines). (B) Replicative life span of ∆8 initial (red line) and ∆8 MA lines (gray lines). (C) Growth rate of initial and MA ∆8 lines.
Figure 6
Figure 6
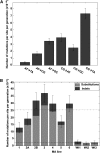
Observed mutation rates for MA lines. (A) Observed total mutation rates per site/per generation after the long-term growth of MA lines. Shown is the average for all MA lines. (B) The mutation rate and standard error per MA line. Horizontal dashed lines are the average mutation rate (base substitutions and indels) for the ∆8 and the WT lines.
Figure 7
Figure 7
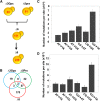
Characterization of mutations in an independent ∆8 isolate. (A–C) Quantification of mutations and characterization of the second ∆8 mutant are as shown in Figure 2 for the first ∆8 mutant. (D) Mutations found in ∆7 were subtracted from the first ∆8 mutant strain, and the spectrum of remaining mutations was analyzed.
Figure 8
Figure 8
Spot assay and comparison of gene expression data. (A) Sensitivity of ∆8 and WT cells to DNA damage agents. In the control panel, ∆8 and ∆5 cells were used with a twofold higher cell density compared to other strains to observe similar growth. Ten-fold dilution of WT and ∆8 cells grown on YPD plates containing 15 µg/ml camptothecin (replication inhibitor), 150 mM hydroxyurea (replication inhibitor), 0.3 µg/ml phleomycine (double-strand break inducer), or 15 µg/ml benomyl (microtubule poison). (B) Comparison of expression of 4493 genes in ∆8 isolates with the expression graded as log2 of the fold increase/decrease in the heat map on the right, ranked from high (blue) to low (red). Mean rpkm (reads per kilobase transcript per million reads) values of two repetitions for each ∆8 isolate were calculated, the values <10 in both isolates were eliminated, and Spearman correlation (ρ) was calculated. Expression distribution of genes for both ∆8 isolates is shown by a histogram at the bottom right. (C) Analysis of genes known to regulate stability of the nuclear genome.
Figure 9
Figure 9
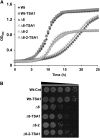
Expression of TSA1 in ∆8 cells. (A) Reduced cell growth of ∆8 cells was partially rescued by Tsa1 expression. Growth of WT and ∆8 cells expressing (or not) TSA1 in liquid YPD medium containing 20 µg/ml phleomycin was monitored by measuring the OD600 every 30 min. Mean values of two independent measurements for each point are shown. (B) Colony growth of Tsa1-expressing ∆8 cells. Overnight cultures of WT and two independent ∆8 isolates as well as the corresponding strains expressing Tsa1 were diluted to an OD600 of 0.3. Then, 5 µl of 10-fold dilution of each cell suspension were spotted onto YPD plates containing 20 µg/ml and photographed 3 days later.

Similar articles

Cited by

References

    1. Avery A. M., Avery S. V., 2001. Saccharomyces cerevisiae expresses three phospholipid hydroperoxide glutathione peroxidases. J. Biol. Chem. 276: 33730–33735. - PubMed
    1. Brigelius-Flohe R., 1999. Tissue-specific functions of individual glutathione peroxidases. Free Radic. Biol. Med. 27: 951–965. - PubMed
    1. Brigelius-Flohe R., 2006. Glutathione peroxidases and redox-regulated transcription factors. Biol. Chem. 387: 1329–1335. - PubMed
    1. Bzymek M., Lovett S. T., 2001. Instability of repetitive DNA sequences: the role of replication in multiple mechanisms. Proc. Natl. Acad. Sci. USA 98: 8319–8325. - PMC - PubMed
    1. Cooke M. S., Evans M. D., Dizdaroglu M., Lunec J., 2003. Oxidative DNA damage: mechanisms, mutation, and disease. FASEB J. 17: 1195–1214. - PubMed

Publication types

Substances

LinkOut - more resources