. 2014 Oct;17(10):1418-1428.
doi: 10.1038/nn.3801. Epub 2014 Aug 31.

Genetic variability in the regulation of gene expression in ten regions of the human brain

Collaborators, Affiliations

Genetic variability in the regulation of gene expression in ten regions of the human brain

Adaikalavan Ramasamy et al. Nat Neurosci. 2014 Oct.

Abstract

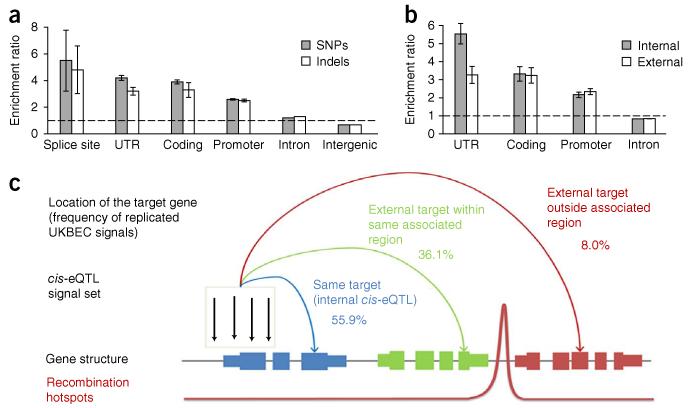
Germ-line genetic control of gene expression occurs via expression quantitative trait loci (eQTLs). We present a large, exon-specific eQTL data set covering ten human brain regions. We found that cis-eQTL signals (within 1 Mb of their target gene) were numerous, and many acted heterogeneously among regions and exons. Co-regulation analysis of shared eQTL signals produced well-defined modules of region-specific co-regulated genes, in contrast to standard coexpression analysis of the same samples. We report cis-eQTL signals for 23.1% of catalogued genome-wide association study hits for adult-onset neurological disorders. The data set is publicly available via public data repositories and via http://www.braineac.org/. Our study increases our understanding of the regulation of gene expression in the human brain and will be of value to others pursuing functional follow-up of disease-associated variants.


Figures

Figure 1
Figure 1. Unsupervised hierarchical clustering of cis-eQTL signals and related expression data.
(a) Heat plot and dendrograms based on unsupervised hierarchical clustering of absolute z scores of all cis-eQTL signals across all ten brain regions. (b) Heat plot and unsupervised hierarchical clustering of mean expression in a brain region for the equivalent expression data (expression IDs targeted by all cis-eQTL signals identified). Column dendrograms for the two panels were very similar, so b has been ordered according to the column dendrogram in a. The row dendrogram in b was indistinct, so it has not been colored by clade. SNIG, substantia nigra; PUTM, putamen (at the level of the anterior commissure); MEDU, the inferior olivary nucleus (sub-dissected from the medulla); THAL, thalamus (at the level of the lateral geniculate nucleus); OCTX, occipital cortex; HIPP, hippocampus; FCTX, frontal cortex; TCTX, temporal cortex; WHMT, intralobular white matter; CRBL, cerebellar cortex.
Figure 2
Figure 2. Regional characterization of cis-eQTL signals.
(a) cis-eQTL signals identified in multiple brain regions, and the proportion of these also identified using average-all (aveALL). (b) cis-eQTL signals classified by brain region. See Figure 1 legend for brain region codes.
Figure 3
Figure 3. Regional characterization examples.
(a) Example of a pan-regional cis-eQTL signal. ATP5G2 transcript 3456313 was highly expressed in all brain regions (left) and rs12818213 was a consistent eQTL signal (right). (b) Example of a region-specific cis-eQTL signal. PPAPDC1A transcript 3267563 was highly expressed in all brain regions, including cerebellum (left), but rs10788102 was an eQTL signal in cerebellum only (right). (c) Second example of a region-specific cis-eQTL signal. ADAMTS18 transcript 3700158 was highly expressed in all brain regions, especially cerebellum (left), but rs4888622 was seen as an eQTL signal in all regions except cerebellum (right). See Figure 1 legend for brain region codes.
Figure 4
Figure 4. Region-specific gene switching example.
rs73009150 was a cis-eQTL signal with (a) RNF214 probe set 3350857 in medulla, (b) PAFAH1B2 probe set 3350766 in cerebellum and (c) IK3 probe set 3393006 in putamen. See Figure 1 legend for brain region codes.
Figure 5
Figure 5. Exon-level characterization of cis-eQTL signals.
(a) Example of a consistent gene-level cis-eQTL signal. rs4753547 was a significant eQTL for all five probe sets in GPR83, which has two recognized alternatively spliced isoforms. (b) Example of a significantly heterogeneous exon-specific cis-eQTL signal. The cis-eQTL signal for rs10986468 was evident for three probe sets out of nine covering ARPC5L in cerebellum (CRBL). These probe sets mapped to three consecutive exons and were unique to one of the three recognized alternatively spliced isoforms from this gene, namely ARPC5L-002. (c) Distribution of gene-level and exon-level cis-eQTL signals by distance from the target transcription start site. (d) Enrichment of gene-level and exon-specific cis-eQTL signals, stratified by their location with respect to their gene of action. Error bars represent s.e.m.
Figure 6
Figure 6. Functional characterization by location of sentinel in relation to its target gene.
Data were restricted to cis-eQTL signals that showed evidence of replication in independent data sets (Supplementary Table 3). (a) Enrichment of cis-eQTL signals relative to all markers in the data set, stratified by their location with respect to their gene of action. (b) Enrichment of cis-eQTL signals located within their target gene (internal) or within a different gene (external), stratified by their location within the gene. (c) The relationship of cis-eQTL signal locations to their target genes.
Figure 7
Figure 7. Examples of GWAS hits that were cis-eQTL signals.
(a) Association of local markers (left) and specifically rs2395163 (right), a risk SNP for Parkinson’s disease, with exon 3 (probe set 2903265) of HLA-DQA2 in average-all (aveALL). (b) Association of local markers (left) and specifically rs12608932 (right), a risk SNP for ALS, with the 3′ UTR (probe set 3824686) of KCNN1 in frontal cortex (FCTX). (c) Association of local markers (left) and specifically rs1051730 (right), a synonymous coding SNP located in CHRNA3 and a risk SNP for lung cancer, smoking behavior and nicotine dependence, with CHRNA5 (transcript 3603436) in average-all. (d) Association of local markers (left) and specifically rs3768716 (right), a risk SNP for neuroblastoma, with BARD1 (transcript 2598099) in average-all.

References

    1. International Parkinson’s Disease Genomics Consortium (IPDGC) Wellcome Trust Case Control Consortium 2 (WTCCC2) A two-stage meta-analysis identifies several new loci for Parkinson’s disease. PLoS Genet. 2011;7:e1002142. - PMC - PubMed
    1. Hollingworth P, et al. Common variants at ABCA7, MS4A6A/MS4A4E, EPHA1, CD33 and CD2AP are associated with Alzheimer’s disease. Nat. Genet. 2011;43:429–435. - PMC - PubMed
    1. Hamshere ML, et al. Genome-wide significant associations in schizophrenia to ITIH3/4, CACNA1C and SDCCAG8, and extensive replication of associations reported by the Schizophrenia PGC. Mol. Psychiatry. 2013;18:708–712. - PMC - PubMed
    1. Hardy J, Singleton A. Genomewide association studies and human disease. N. Engl. J. Med. 2009;360:1759–1768. - PMC - PubMed
    1. Visscher PM, Brown MA, McCarthy MI, Yang J. Five years of GWAS discovery. Am. J. Hum. Genet. 2012;90:7–24. - PMC - PubMed

Publication types

MeSH terms

Associated data