Meta-Analysis
. 2014 Aug;2014(48):130-44.
doi: 10.1093/jncimonographs/lgu013.

Etiologic heterogeneity among non-Hodgkin lymphoma subtypes: the InterLymph Non-Hodgkin Lymphoma Subtypes Project

Lindsay M Morton  1 Susan L Slager  1 James R Cerhan  1 Sophia S Wang  1 Claire M Vajdic  1 Christine F Skibola  1 Paige M Bracci  1 Silvia de Sanjosé  1 Karin E Smedby  1 Brian C H Chiu  1 Yawei Zhang  1 Sam M Mbulaiteye  1 Alain Monnereau  1 Jennifer J Turner  1 Jacqueline Clavel  1 Hans-Olov Adami  1 Ellen T Chang  1 Bengt Glimelius  1 Henrik Hjalgrim  1 Mads Melbye  1 Paolo Crosignani  1 Simonetta di Lollo  1 Lucia Miligi  1 Oriana Nanni  1 Valerio Ramazzotti  1 Stefania Rodella  1 Adele Seniori Costantini  1 Emanuele Stagnaro  1 Rosario Tumino  1 Carla Vindigni  1 Paolo Vineis  1 Nikolaus Becker  1 Yolanda Benavente  1 Paolo Boffetta  1 Paul Brennan  1 Pierluigi Cocco  1 Lenka Foretova  1 Marc Maynadié  1 Alexandra Nieters  1 Anthony Staines  1 Joanne S Colt  1 Wendy Cozen  1 Scott Davis  1 Anneclaire J de Roos  1 Patricia Hartge  1 Nathaniel Rothman  1 Richard K Severson  1 Elizabeth A Holly  1 Timothy G Call  1 Andrew L Feldman  1 Thomas M Habermann  1 Mark Liebow  1 Aaron Blair  1 Kenneth P Cantor  1 Eleanor V Kane  1 Tracy Lightfoot  1 Eve Roman  1 Alex Smith  1 Angela Brooks-Wilson  1 Joseph M Connors  1 Randy D Gascoyne  1 John J Spinelli  1 Bruce K Armstrong  1 Anne Kricker  1 Theodore R Holford  1 Qing Lan  1 Tongzhang Zheng  1 Laurent Orsi  1 Luigino Dal Maso  1 Silvia Franceschi  1 Carlo La Vecchia  1 Eva Negri  1 Diego Serraino  1 Leslie Bernstein  1 Alexandra Levine  1 Jonathan W Friedberg  1 Jennifer L Kelly  1 Sonja I Berndt  1 Brenda M Birmann  1 Christina A Clarke  1 Christopher R Flowers  1 James M Foran  1 Marshall E Kadin  1 Ora Paltiel  1 Dennis D Weisenburger  1 Martha S Linet  1 Joshua N Sampson  1
Affiliations
Meta-Analysis

Etiologic heterogeneity among non-Hodgkin lymphoma subtypes: the InterLymph Non-Hodgkin Lymphoma Subtypes Project

Lindsay M Morton et al. J Natl Cancer Inst Monogr. 2014 Aug.

Abstract

Background: Non-Hodgkin lymphoma (NHL) comprises biologically and clinically heterogeneous subtypes. Previously, study size has limited the ability to compare and contrast the risk factor profiles among these heterogeneous subtypes.

Methods: We pooled individual-level data from 17 471 NHL cases and 23 096 controls in 20 case-control studies from the International Lymphoma Epidemiology Consortium (InterLymph). We estimated the associations, measured as odds ratios, between each of 11 NHL subtypes and self-reported medical history, family history of hematologic malignancy, lifestyle factors, and occupation. We then assessed the heterogeneity of associations by evaluating the variability (Q value) of the estimated odds ratios for a given exposure among subtypes. Finally, we organized the subtypes into a hierarchical tree to identify groups that had similar risk factor profiles. Statistical significance of tree partitions was estimated by permutation-based P values (P NODE).

Results: Risks differed statistically significantly among NHL subtypes for medical history factors (autoimmune diseases, hepatitis C virus seropositivity, eczema, and blood transfusion), family history of leukemia and multiple myeloma, alcohol consumption, cigarette smoking, and certain occupations, whereas generally homogeneous risks among subtypes were observed for family history of NHL, recreational sun exposure, hay fever, allergy, and socioeconomic status. Overall, the greatest difference in risk factors occurred between T-cell and B-cell lymphomas (P NODE < 1.0×10(-4)), with increased risks generally restricted to T-cell lymphomas for eczema, T-cell-activating autoimmune diseases, family history of multiple myeloma, and occupation as a painter. We further observed substantial heterogeneity among B-cell lymphomas (P NODE < 1.0×10(-4)). Increased risks for B-cell-activating autoimmune disease and hepatitis C virus seropositivity and decreased risks for alcohol consumption and occupation as a teacher generally were restricted to marginal zone lymphoma, Burkitt/Burkitt-like lymphoma/leukemia, diffuse large B-cell lymphoma, and/or lymphoplasmacytic lymphoma/Waldenström macroglobulinemia.

Conclusions: Using a novel approach to investigate etiologic heterogeneity among NHL subtypes, we identified risk factors that were common among subtypes as well as risk factors that appeared to be distinct among individual or a few subtypes, suggesting both subtype-specific and shared underlying mechanisms. Further research is needed to test putative mechanisms, investigate other risk factors (eg, other infections, environmental exposures, and diet), and evaluate potential joint effects with genetic susceptibility.


Figures

Figure 1.
Figure 1.
The table lists the overall odds ratio (OR) (95% confidence interval) for all risk factors affecting one or more non-Hodgkin lymphoma NHL subtypes (P ASSET < 0.01), adjusting for age, race/ethnicity, sex, and study. For binary variables, OR compares exposed vs unexposed, and for ordinal variablesG, OR compares highest vs lowest category. The columns list the exposure category, specific exposure, prevalence (all variables dichotomized) in cases and controls, p-value for association (P ASSET), p-value for effect homogeneity (PH), and the OR. The colored grid indicates the log odds ratio associated with the exposure for each subtype separately. Red (blue) indicates the exposure increases (decreases) risk. X indicates ASSET analysis identified a statistically significant association, whereas m indicates missing due to lack of data. For groups of highly correlated exposures (e.g., duration, pack-years smoking), only a single representative variable is listed here. Results for all risk factors are available in Supplementary Table 2 (available online). Subtypes include Burkitt/Burkitt-like lymphoma/leukemia (BL); chronic lymphocytic leukemia/small lymphocytic lymphoma (CLL/SLL); diffuse large B-cell lymphoma (DLBCL); follicular lymphoma (FL); lymphoplasmacytic lymphoma/Waldenström macroglobulinemia (LPL/WM); mantle cell lymphoma (MCL); marginal zone lymphoma (MZL); mycosis fungoides/Sézary syndrome (MF/SS); peripheral T-cell lymphoma (PTCL). A In total, the family history category included 5 variables; autoimmune disease – 16; atopic disease – 5; blood transfusion – 5; anthropometric factors – 5; alcohol – 19, smoking – 7, sun – 2, occupation – 33; hair-dye – 8; reproductive and hormone – 5. B Type of hematologic malignancy was coded according to International Classification of Diseases (ICD) as non-Hodgkin lymphoma (NHL) (ICD-9: 200, 202.0-202.2, 202.8-202.9; ICD-10: C82-C85, C96.3), Hodgkin lymphoma (ICD-9: 201, ICD-10: C81), leukemia (ICD-9: 202.4, 203.1, 204-208; ICD-10: C90.1, C91-C95), or multiple myeloma (ICD-9: 203, ICD-10: C90.0, C90.2)). Note that leukemia includes both lymphoid and myeloid leukemias, and lymphoid leukemias and plasma cell neoplasms are not considered part of NHL in ICD, in contrast to the World Health Organization (WHO) classification (2,3) and InterLymph guidelines (42,43). C Includes self-reported history of specific autoimmune diseases occurring ≥2 years prior to diagnosis/interview (except the New South Wales study, which did not ascertain date of onset). Autoimmune diseases were classified according to whether they are primary mediated by B-cell or T-cell responses (21,54-57). B-cell activating diseases include Hashimoto thyroiditis, hemolytic anemia, myasthenia gravis, pernicious anemia, rheumatoid arthritis, Sjögren’s syndrome, and systemic lupus erythematosus. T-cell activating disease include celiac disease, immune thrombocytopenic purpura, inflammatory bowel disorder (Crohn’s disease, ulcerative colitis), multiple sclerosis, polymyositis or dermatomyositis, psoriasis, sarcoidosis, systemic sclerosis or scleroderma, and type 1 diabetes. D Serum antibodies to HCV were evaluated using a third generation enzyme-linked immunosorbent assay (58). E Includes self-reported history of atopic conditions occurring ≥2 years prior to diagnosis/interview. Any allergy included plant, food, animal, dust, insect, or mold, but excluded drug allergies. F Includes self-reported history of blood transfusions occurring ≥1 year prior to diagnosis/interview. G OR represents risk per increasing category of an ordinal variable with categories assigned to equally spaced values between 0 and 1 for body-mass index as a young adult (<18.5, 18.5-22.4, 22.5-24.9, 25.0-29.9, ≥30 kg/m2), height (sex-specific quartiles, males: <172.0, 172.0-177.7, 177.8-181.9, ≥182.0 cm; females: <159.0, 159.0-162.9, 163.0-167.9, ≥168.0 cm), duration of cigarette smoking (0, 1-19, 20-29, 30-39, ≥40 years), recreational sun exposure (hours per week, study-specific quartiles available upon request), and socioeconomic status (low, medium, high; measured by years of education for studies in North America or by dividing measures of education or socioeconomic status into tertiles for studies in Europe or Australia). H Occupations (ascertained by complete work history in 8 studies and longest held occupation in 2 studies) were coded according to the International Standard Classification of Occupations (ISCO), Revised Edition 1968 (59).
Figure 2.
Figure 2.
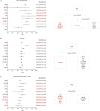
Forest plots list the odds ratio (OR) and 95% confidence interval (CI) for being diagnosed with non-Hodgkin lymphoma (NHL), or its specific subtypes, for individuals with a (A) family history of leukemia or (B) family history of multiple myeloma, compared to individuals without a family history. ORs were adjusted for age, ethnicity, sex, and study. Bold font indicates associated subtypes in ASSET and colors represent distinct tree nodes. The trees on the right of the figure split the NHL subtypes into groups of subtypes that were similarly affected by the given exposure. Hairy cell leukemia (HCL) and acute lymphoblastic leukemia/lymphoma (ALL) were excluded from trees because small sample sizes prevented reliable clustering. PNODE is the P-value for creation of that node during hierarchical clustering. Subtypes include Burkitt/Burkitt-like lymphoma/leukemia (BL); chronic lymphocytic leukemia/small lymphocytic lymphoma (CLL/SLL); diffuse large B-cell lymphoma (DLBCL); follicular lymphoma (FL); lymphoplasmacytic lymphoma/Waldenström macroglobulinemia (LPL/WM); mantle cell lymphoma (MCL); marginal zone lymphoma (MZL); mycosis fungoides/Sézary syndrome (MF/SS); peripheral T-cell lymphoma (PTCL).
Figure 3.
Figure 3.
Forest plots list the odds ratio (OR) and 95% confidence interval (CI) for being diagnosed with non-Hodgkin lymphoma (NHL), or its specific subtypes, for individuals with a history of (A) B-cell-activating autoimmune disease, (B) Sjögren’s syndrome, (C) T-cell-activating autoimmune disease, and (D) celiac disease, compared to individuals without a family history. ORs were adjusted for age, ethnicity, sex, and study. Bold font indicates associated subtypes in ASSET and colors represent distinct tree nodes. The trees on the right of the figure split the NHL subtypes into groups of subtypes that were similarly affected by the given exposure. Hairy cell leukemia (HCL) and acute lymphoblastic leukemia/lymphoma (ALL) were excluded from trees because small sample sizes prevented reliable clustering. PNODE is the P-value for creation of that node during hierarchical clustering. Subtypes include Burkitt/Burkitt-like lymphoma/leukemia (BL); chronic lymphocytic leukemia/small lymphocytic lymphoma (CLL/SLL); diffuse large B-cell lymphoma (DLBCL); follicular lymphoma (FL); lymphoplasmacytic lymphoma/Waldenström macroglobulinemia (LPL/WM); mantle cell lymphoma (MCL); marginal zone lymphoma (MZL); mycosis fungoides/Sézary syndrome (MF/SS); peripheral T-cell lymphoma (PTCL).
Figure 4.
Figure 4.
Forest plots list the odds ratio (OR) for being diagnosed with non-Hodgkin lymphoma (NHL), or its specific subtypes, for individuals with (A) hepatitis c virus (HCV) seropositivity, (B) eczema, and (C) blood transfusion prior to 1990, compared to individuals without that condition. ORs were adjusted for age, ethnicity, sex, and study. Bold font indicates associated subtypes in ASSET and colors represent distinct tree nodes. The trees on the right of the figure split the NHL subtypes into groups of subtypes that were similarly affected by the given exposure. Hairy cell leukemia (HCL) and acute lymphoblastic leukemia/lymphoma (ALL) were excluded from trees because small sample sizes prevented reliable clustering. PNODE is the P-value for creation of that node during hierarchical clustering. Subtypes include Burkitt/Burkitt-like lymphoma/leukemia (BL); chronic lymphocytic leukemia/small lymphocytic lymphoma (CLL/SLL); diffuse large B-cell lymphoma (DLBCL); follicular lymphoma (FL); lymphoplasmacytic lymphoma/Waldenström macroglobulinemia (LPL/WM); mantle cell lymphoma (MCL); marginal zone lymphoma (MZL); mycosis fungoides/Sézary syndrome (MF/SS); peripheral T-cell lymphoma (PTCL).
Figure 5.
Figure 5.
Forest plots list the odds ratio (OR) for being diagnosed with non-Hodgkin lymphoma (NHL), or its specific subtypes, for individuals (A) consuming ≥ 1 serving of wine/month; (B) smoking longer, smoking duration categorized into groupings of 0, 1–19, 20–29, 30–39, and ≥40 years, with assigned values of 0, 1/4, 2/4, 3/4, and 1 for calculating OR; (C) occupation as teacher; and (D) occupation as Painter. ORs were adjusted for age, ethnicity, sex, and study. Bold font indicates associated subtypes in ASSET and colors represent distinct tree nodes. The trees on the right of the figure split the NHL subtypes into groups of subtypes that were similarly affected by the given exposure. Hairy cell leukemia (HCL) and acute lymphoblastic leukemia/lymphoma (ALL) were excluded from trees because small sample sizes prevented reliable clustering. PNODE is the P-value for creation of that node during hierarchical clustering. Subtypes include Burkitt/Burkitt-like lymphoma/leukemia (BL); chronic lymphocytic leukemia/small lymphocytic lymphoma (CLL/SLL); diffuse large B-cell lymphoma (DLBCL); follicular lymphoma (FL); lymphoplasmacytic lymphoma/Waldenström macroglobulinemia (LPL/WM); mantle cell lymphoma (MCL); marginal zone lymphoma (MZL); mycosis fungoides/Sézary syndrome (MF/SS); peripheral T-cell lymphoma (PTCL).
Figure 6.
Figure 6.
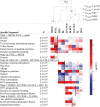
Top-down heierarchical clustering identified groups of subtypes that had similar risk profiles among significant exposures (P ASSET < 0.01). The tree at the top of the figure illustrates that the first split separated MF/SS and PTCL from the remaining seven subtypes, the second split further divided that larger group, separating MZL and BL from the remaining five subtypes, and so forth. For each split, the table lists the risk factors that distinguish the subtypes in the two resulting nodes at a statistically significant level (p < .05) and the colored grid (similar to Figure 1) indicates the odds ratios for the relevant subtype/risk factor pairings. PNODE is the P-value for creation of that node during hierarchical clustering. Hairy cell leukemia (HCL) and acute lymphoblastic leukemia/lymphoma (ALL) were excluded from the tree because small sample sizes prevented reliable clustering. Subtypes include Burkitt/Burkitt-like lymphoma/leukemia (BL); chronic lymphocytic leukemia/small lymphocytic lymphoma (CLL/SLL); diffuse large B-cell lymphoma (DLBCL); follicular lymphoma (FL); lymphoplasmacytic lymphoma/Waldenström macroglobulinemia (LPL/WM); mantle cell lymphoma (MCL); marginal zone lymphoma (MZL); mycosis fungoides/Sézary syndrome (MF/SS); peripheral T-cell lymphoma (PTCL). A Details regarding specific risk factors are provided in the footnote for Figure 1.

References

    1. Ferlay J, Soerjomataram L, Ervik M, et al. GLOBOCAN 2012 v1.0, Cancer Incidence and Mortality Worldwide: IARC CancerBase No. 11 [Internet]. Lyon, France: International Agency for Research on Cancer; 2013. http://globocan.iarc.fr Accessed February 22, 2014
    1. Jaffe ES, Harris NL, Stein H, Vardiman JW. eds. World Health Organization Classification of Tumours of Haematopoietic and Lymphoid Tissues. Lyon, France: IARC Press; 2001
    1. Swerdlow SH, Campo E, Harris NL, et al. World Health Organization Classification of Tumours of Haematopoietic and Lymphoid Tissues. 4th ed. Lyon, France: IARC Press; 2008
    1. Morton LM, Wang SS, Devesa SS, Hartge P, Weisenburger DD, Linet MS. Lymphoma incidence patterns by WHO subtype in the United States, 1992–2001. Blood. 2006;107(1):265–276 - PMC - PubMed
    1. Smith A, Howell D, Patmore R, Jack A, Roman E. Incidence of haematological malignancy by sub-type: a report from the Haematological Malignancy Research Network. Br J Cancer. 2011;105(11):1684–1692 - PMC - PubMed

Publication types

MeSH terms

Grants and funding