. 2015 Jul;34(27):3493-503.
doi: 10.1038/onc.2014.286. Epub 2014 Sep 1.

Th17-type cytokines, IL-6 and TNF-α synergistically activate STAT3 and NF-kB to promote colorectal cancer cell growth

Affiliations

Th17-type cytokines, IL-6 and TNF-α synergistically activate STAT3 and NF-kB to promote colorectal cancer cell growth

V De Simone et al. Oncogene. 2015 Jul.

Abstract

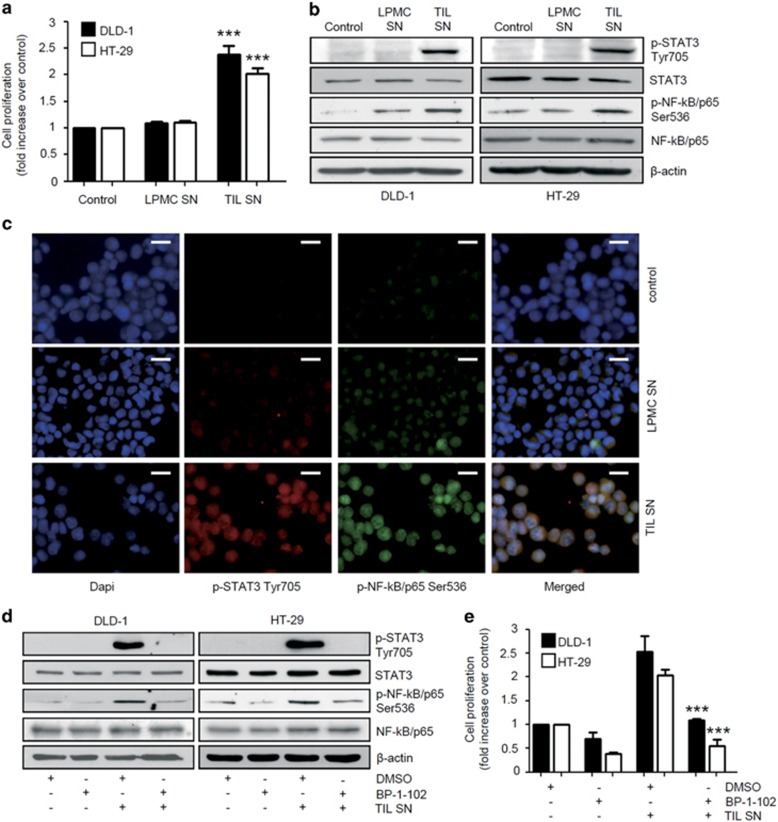
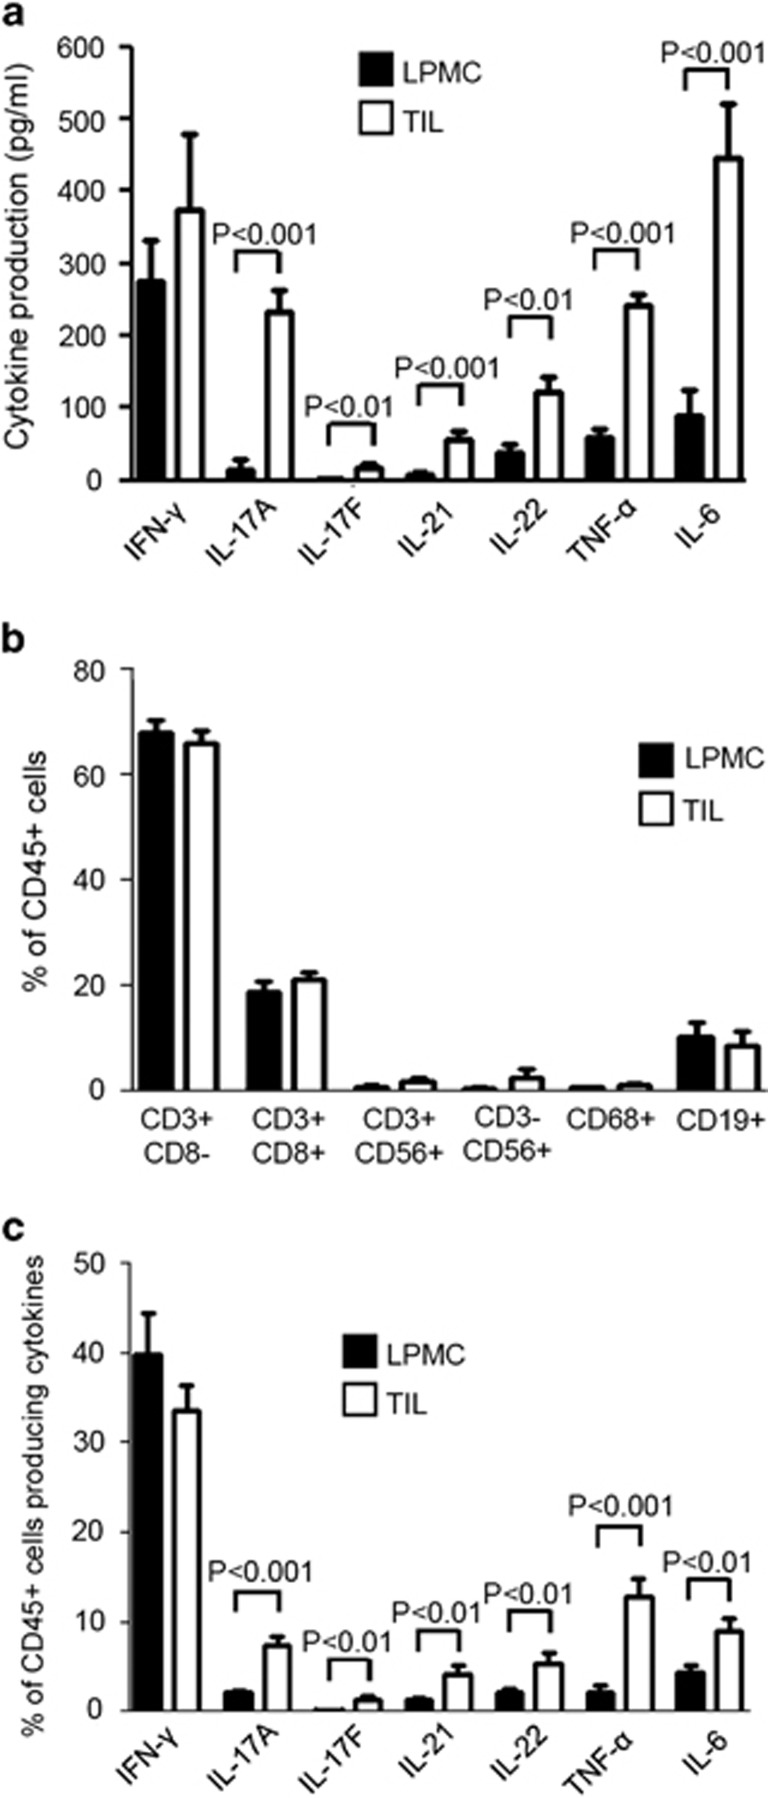
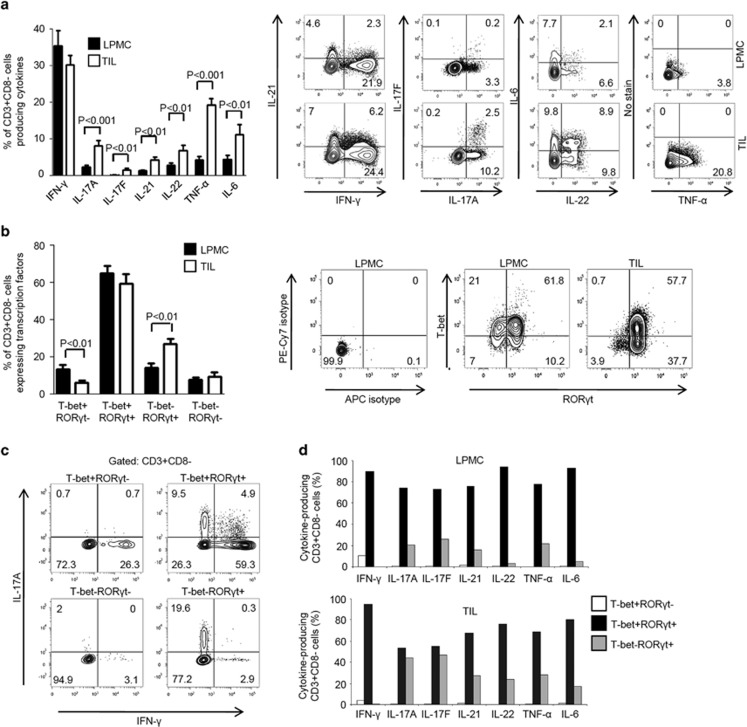
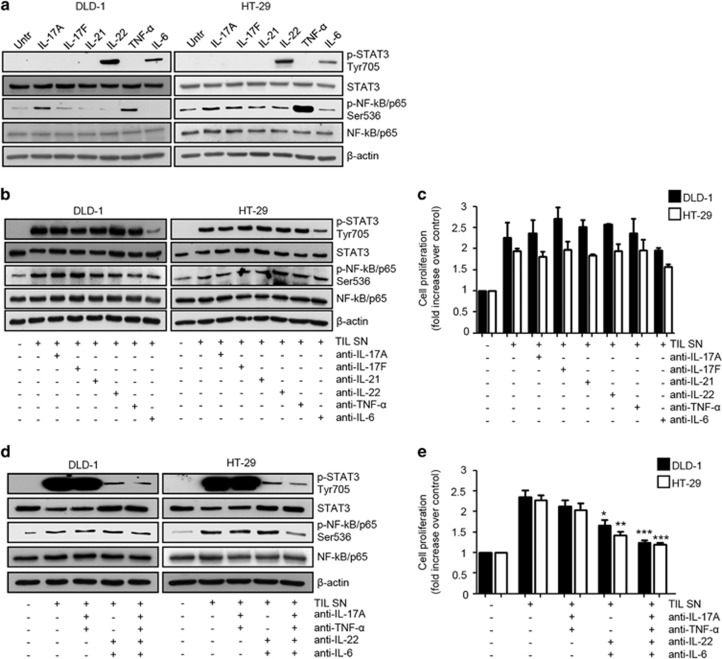
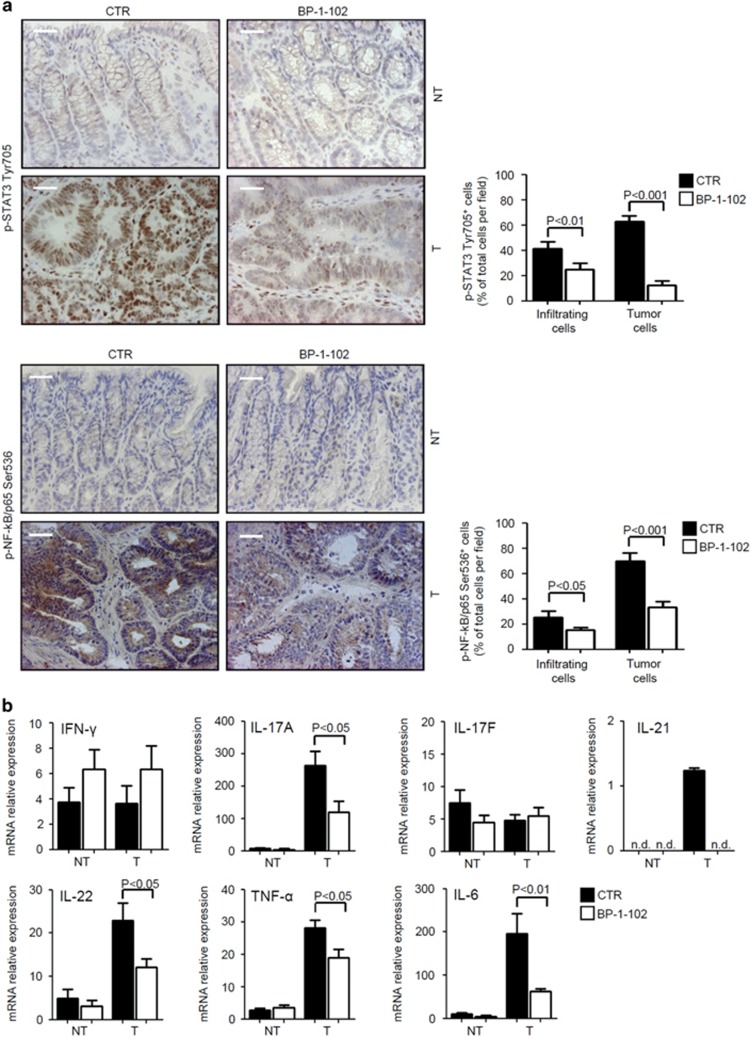
Colorectal cancers (CRCs) often show a dense infiltrate of cytokine-producing immune/inflammatory cells. The exact contribution of each immune cell subset and cytokine in the activation of the intracellular pathways sustaining CRC cell growth is not understood. Herein, we isolate tumor-infiltrating leukocytes (TILs) and lamina propria mononuclear cells (LPMCs) from the tumor area and the macroscopically unaffected, adjacent, colonic mucosa of patients who underwent resection for sporadic CRC and show that the culture supernatants of TILs, but not of LPMCs, potently enhance the growth of human CRC cell lines through the activation of the oncogenic transcription factors signal transducer and activator of transcription 3 (STAT3) and nuclear factor-kappa B (NF-kB). Characterization of immune cell complexity of TILs and LPMCs reveals no differences in the percentages of T cells, natural killer T cells, natural killer (NK) cells, macrophages and B cells. However, T cells from TILs show a functional switch compared with those from LPMCs to produce large amounts of T helper type 17 (Th17)-related cytokines (that is, interleukin-17A (IL-17A), IL-17F, IL-21 and IL-22), tumor necrosis factor-α (TNF-α) and IL-6. Individual neutralization of IL-17A, IL-17F, IL-21, IL-22, TNF-α or IL-6 does not change TIL-derived supernatant-driven STAT3 and NF-kB activation, as well as their proproliferative effect in CRC cells. In contrast, simultaneous neutralization of both IL-17A and TNF-α, which abrogates NF-kB signaling, and IL-22 and IL-6, which abrogates STAT3 signaling, reduces the mitogenic effect of supernatants in CRC cells. IL-17A, IL-21, IL-22, TNF-α and IL-6 are also produced in excess in the early colonic lesions in a mouse model of sporadic CRC, associated with enhanced STAT3/NF-kB activation. Mice therapeutically given BP-1-102, an orally bioavailable compound targeting STAT3/NF-kB activation and cross-talk, exhibit reduced colon tumorigenesis and diminished expression of STAT3/NF-kB-activating cytokines in the neoplastic areas. These data suggest that strategies aimed at the cotargeting of STAT3/NF-kB activation and interaction between them might represent an attractive and novel approach to combat CRC.


Figures

Figure 1
Figure 1
TIL-derived supernatants (TIL SNs) increase CRC cell proliferation through activation of STAT3 and NF-kB. (a) TIL SNs, lamina propria mononuclear cell-derived supernatants (LPMC SNs) and RPMI 1640 complete medium (control) (all used at 1:20 final dilution) were added to DLD-1 and HT-29 cell cultures. After 24 h, cell proliferation was assessed by 5-bromodeoxyuridine (BrdU) assay. Data indicate mean±s.e.m. of four independent experiments in which culture supernatants derived from TILs and LPMCs isolated from the tumor area and the macroscopically unaffected, adjacent, colonic mucosa of four patients who had undergone resection for sporadic CRC were used. Differences between groups were compared using one-way analysis of variance (ANOVA) followed by Bonferroni's post hoc test. DLD-1: TIL SN-stimulated cells vs either LPMC SN-stimulated cells or control, ***P<0.001; HT-29: TIL SN-stimulated cells vs either LPMC SN-stimulated cells or control, ***P<0.001. (b) DLD-1 and HT-29 cells were cultured in the presence of either TIL SNs or LPMC SNs or RPMI 1640 complete medium (control) (all used at 1:20 final dilution) for 15 min. P-STAT3 Tyr705, STAT3, p-NF-kB/p65 Ser536 and NF-kB/p65 expression was assessed by western blotting. β-Actin was used as loading control. Shown is one of four representative experiments in which culture supernatants derived from TILs and LPMCs isolated from the same patients described in (a) were used. (c) Representative immunofluorescence pictures showing activated STAT3 colocalization with activated NF-kB/p65 in DLD-1 cells cultured in the presence of TIL SNs for 15 min. Cells were cultured as indicated in (b), fixed and stained with anti-p-STAT3 Tyr705 antibody and secondary Alexa Fluor 546 antibody (red), anti-p-NF-kB/p65 Ser536 and secondary Alexa Fluor 488 antibody (green) or 4',6-diamidino-2-phenylindole (DAPI) nuclear staining (blue). The scale bars are 10 μm. The figure is representative of three separate experiments in which culture supernatants derived from TILs and LPMCs isolated from the same patients described in (a) were used. (d) Effect of STAT3 inhibitor BP-1-102 on TIL SN-mediated STAT3 and NF-kB activation. Representative western blotting showing p-STAT3 Tyr705, STAT3, p-NF-kB/p65 Ser536 and NF-kB/p65 expression in DLD-1 and HT-29 cells stimulated or not with TIL SNs in the presence or absence of BP-1-102. β-Actin was used as a loading control. Blots are representative of four independent experiments in which culture supernatants derived from TILs isolated from the tumor area of four patients who had undergone resection for sporadic CRC were used. (e) Inhibition of STAT3 and NF-kB activation by BP-1-102 completely suppresses TIL SN-mediated increase of CRC cell proliferation. Representative histograms showing cell proliferation of DLD-1 and HT-29 cells stimulated or not with TIL SNs in the presence or absence of BP-1-102 for 24 h. Data indicate mean±s.e.m. of four experiments in which culture supernatants derived from TILs isolated from the same patients described in (d) were used. Differences between groups were compared using one-way ANOVA followed by Bonferroni's post hoc test. DLD-1: TIL SN+BP-1-102-treated cells vs TIL SN-treated cells, ***P<0.001; HT-29: TIL SN+BP-1-102-treated cells vs TIL SN-treated cells, ***P<0.001.
Figure 2
Figure 2
The neoplastic area of CRC samples is massively infiltrated with Th17-related cytokine-, TNF-α- and IL-6-producing cells. (a) IFN-γ, IL-17A, IL-17F, IL-21, IL-22, TNF-α and IL-6 proteins were analyzed by enzyme-linked immunosorbent assay (ELISA) in LPMC-derived supernatants (LPMC SNs) and TIL-derived supernatants (TL SNs), and data are expressed as pg/ml supernatants. Data indicate mean±s.e.m. of six experiments. Differences were calculated using the two-tailed Student's t-test. (b) Characterization of immune cell infiltrate in LPMCs and TIsL. Representative histograms showing the fraction of T cells, natural killer T (NKT) cells, NK cells, macrophages and B cells in LPMCs and TILs isolated from adjacent tumor and non-tumor areas of 14 patients undergoing colectomy for sporadic CRC. CD45+ cells were gated and analyzed for the indicated markers. Data are expressed as mean±s.e.m. and differences were calculated using the two-tailed Student's t-test. (c) Representative histograms showing the fraction of IFN-γ-, IL-17A-, IL-17F-, IL-21-, IL-22-, TNF-α- and IL-6-expressing CD45+ cells in LPMCs and TILs isolated from adjacent tumor and non-tumor areas of 14 patients undergoing colectomy for sporadic CRC. Data are expressed as mean±s.e.m. and differences were calculated using the two-tailed Student's t-test.
Figure 3
Figure 3
Analysis of cytokine production and T-bet/RORγt expression in LPMC- and TIL-derived CD3+CD8− subsets. (a) Representative histograms showing the fraction of IFN-γ-, IL-17A-, IL-17F-, IL-21-, IL-22-, TNF-α- and IL-6-expressing CD3+CD8− cells in LPMCs and TILs isolated from adjacent tumor and non-tumor areas of 14 patients undergoing colectomy for sporadic CRC. Data are expressed as mean±s.e.m. and differences were calculated using the two-tailed Student's t-test. Right insets. Representative dot plots showing the percentage of IFN-γ- and/or IL-21-, IL-17A- and/or IL-17F-, IL-22- and/or IL-6- and TNF-α-producing CD3+CD8− cells in LPMCs and TILs. The numbers indicate the percentage of cells in the designated quadrants. (b) Representative histograms showing the fraction of T-bet+ and/or Rorγt+ CD3+CD8− cells in LPMCs and TILs isolated from adjacent tumor and non-tumor areas of 14 patients undergoing colectomy for sporadic CRC. Data are expressed as mean±s.e.m. and differences were calculated using the two-tailed Student's t-test. Right insets. Representative dot plots showing the percentage of T-bet+ and/or Rorγt+ CD3+CD8− cells in LPMCs and TILs. The numbers indicate the percentage of cells in the designated quadrants. Staining of LPMCs with APC- and PE-Cy7-conjugated control isotype IgG is also shown. (c) Representative dot plots showing the ability to produce IFN-γ and/or IL-17A by the indicated subsets of TILs. The numbers indicate the percentage of cells in the designated quadrants. (d) Representative histograms showing the percentage of IFN-γ-, IL-17A-, IL-17F-, IL-21-, IL-22-, TNF-α- and IL-6-producing CD3+CD8− cells in LPMCs and TILs isolated from adjacent tumor and non-tumor areas of one patient undergoing colectomy for sporadic CRC . IFN-γ-, IL-17A-, IL-17F-, IL-21-, IL-22-, TNF-α- and IL-6-producing CD3+CD8− cells were gated and analyzed for the indicated markers. The example is representative of 10 independent experiments in which cells isolated from 10 patients undergoing colectomy for sporadic CRC were analyzed.
Figure 4
Figure 4
IL-17A, IL-22, TNF-α and IL-6 contribute to TIL-derived supernatant (TIL SN)-mediated STAT3/NF-kB activation and mitogenic effect in CRC cells. (a) Representative western blotting showing p-STAT3 Tyr705, STAT3, p-NF-kB/p65 Ser536 and NF-kB/p65 expression in DLD-1 and HT-29 cells stimulated or not with IL-17A, IL-17F, IL-21, IL-22, TNF-α- and IL-6 (all used at 25 ng/ml) for 15 min. β-Actin was used as a loading control. One of three representative experiments in which similar results were obtained is shown. (b) Representative western blotting showing p-STAT3 Tyr705, STAT3, p-p65 Ser536 and NF-kB/p65 expression in DLD-1 and HT-29 cells stimulated or not with TIL SNs in the presence or absence of anti-IL-17A, anti-IL-17F, anti-IL-21, anti-IL-22, anti-TNF-α and anti-IL-6 (all used at 10 μg/ml) as indicated. β-Actin was used as a loading control. One of three representative experiments in which similar results were obtained is shown. (c) Representative histograms showing cell proliferation of DLD-1 and HT-29 cells stimulated as indicated in (b). Data indicate mean±s.e.m. of four experiments. Differences between groups were compared using one-way analysis of variance (ANOVA) followed by Bonferroni's post hoc test. (d) Representative western blotting showing p-STAT3 Tyr705, STAT3, p-NF-kB/p65 Ser536 and NF-kB/p65 expression in DLD-1 and HT-29 cells stimulated or not with TIL SNs in the presence or absence of anti-IL-17A, anti-IL-22, anti-TNF-α and anti-IL-6, used in combination as indicated. β-Actin was used as a loading control. One of three representative experiments in which similar results were obtained is shown. (e) Representative histograms showing cell proliferation of DLD-1 and HT-29 cells stimulated as indicated in (d). Data indicate mean±s.e.m. of five experiments. Differences between groups were compared using one-way analysis of variance (ANOVA) followed by Bonferroni's post hoc test. DLD-1: TIL SN+anti-IL-22+anti-IL-6- vs TIL SN-treated cells, *P<0.05, TIL SN+anti-IL-17A+anti-TNF-α+anti-IL-22+anti-IL-6- vs TIL SN-treated cells, ***P<0.001; HT-29: TIL SN+anti-IL-22+anti-IL-6- vs TIL SN-treated cells, **P<0.01, TIL SN+anti-IL-17A+anti-TNF-α+anti-IL-22+anti-IL-6- vs TIL SN-treated cells, ***P<0.001.
Figure 5
Figure 5
Orally administered BP-1-102 reduces colonic tumorigenesis in Apcmin/+ mice. (a) Experimental protocol used to assess the effect of BP-1-102 treatment on colonic tumorigenesis in Apcmin/+ mice. (b) Upper panels show representative endoscopic pictures of colon tumors developed in mice treated with either dimethyl sulfoxide (DMSO) (CTR) or BP-1-102. Graphs show the number of lesions and the endoscopic scoring of tumors developed in mice treated with either DMSO (CTR) or BP-1-102. Data indicate mean±s.e.m. of three independent experiments in which at least four mice per group were considered. Differences were calculated using the two-tailed Student's t-test. (c) Representative images showing proliferating cell nuclear antigen (PCNA) immunostaining in colonic sections taken from Apcmin/+ mice treated with either DMSO (CTR) or BP-1-102. The scale bars are 20 μm. One of six representative experiments in which similar results were obtained is shown. NT, non-tumor area; T, tumor area.
Figure 6
Figure 6
Reduced STAT3/NF-kB activation and reduced expression of IL-17A, IL-21, IL-22, TNF-α and IL-6 are seen in the colonic tumors of BP-1-102-treated Apcmin/+ mice. (a) Representative images showing p-STAT3 Tyr705- or p-NF-kB/p65 Ser536-positive cells in colonic sections taken from the tumor areas Apcmin/+ mice treated with either dimethyl sulfoxide (DMSO) (CTR) or BP-1-102 and killed on day 56. The scale bars are 20 μm. One of six representative experiments in which similar results were obtained is shown. Right insets. Quantification of p-STAT3 Tyr705- or p-NF-kB/p65 Ser536-positive infiltrating and epithelial cells in colonic sections taken from the tumor areas of Apcmin/+ mice treated with either DMSO (CTR) or BP-1-102 and killed on day 56. Data are presented as mean values of positive cells per high power field (h.p.f.)±s.e.m. of three independent experiments in which two sections per group were analyzed. Differences were calculated using the two-tailed Student's t-test. NT, non-tumor area; T, tumor area. (b) IFN-γ, IL-17A, IL-17F, IL-21, IL-22, TNF-α- and IL-6 expression was assessed by real-time PCR in colonic tissues taken from Apcmin/+ mice treated with either DMSO (CTR) or BP-1-102 and killed on day 56. Values are mean±s.e.m. of two independent experiments containing at least three mice per group. Differences were calculated using the two-tailed Student's t-test. ND, not detectable; NT, non-tumor area; T, tumor area.

References

    1. Center MM, Jemal A, Smith RA, Ward E. Worldwide variations in colorectal cancer. CA Cancer J Clin. 2009;59:366–378. - PubMed
    1. Fearon ER, Vogelstein B. A genetic model for colorectal tumorigenesis. Cell. 1990;61:759–767. - PubMed
    1. Eaden JA, Abrams KR, Mayberry JF. The risk of colorectal cancer in ulcerative colitis: a meta-analysis. Gut. 2001;48:526–535. - PMC - PubMed
    1. Grivennikov S, Karin E, Terzic J, Mucida D, Yu GY, Vallabhapurapu S, et al. IL-6 and Stat3 are required for survival of intestinal epithelial cells and development of colitis-associated cancer. Cancer Cell. 2009;15:103–113. - PMC - PubMed
    1. Huber S, Gagliani N, Zenewicz LA, Huber FJ, Bosurgi L, Hu B, et al. IL-22BP is regulated by the inflammasome and modulates tumorigenesis in the intestine. Nature. 2012;491:259–263. - PMC - PubMed

Publication types

MeSH terms