. 2014 Nov;45(5):2013-23.
doi: 10.3892/ijo.2014.2618. Epub 2014 Aug 22.

MicroRNA-29b-1 impairs in vitro cell proliferation, self‑renewal and chemoresistance of human osteosarcoma 3AB-OS cancer stem cells

Affiliations

MicroRNA-29b-1 impairs in vitro cell proliferation, self‑renewal and chemoresistance of human osteosarcoma 3AB-OS cancer stem cells

Riccardo Di Fiore et al. Int J Oncol. 2014 Nov.

Abstract

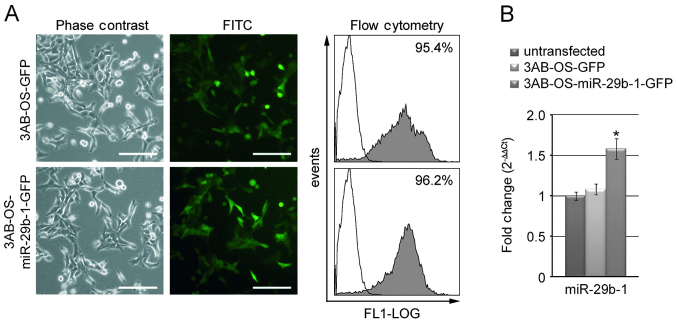
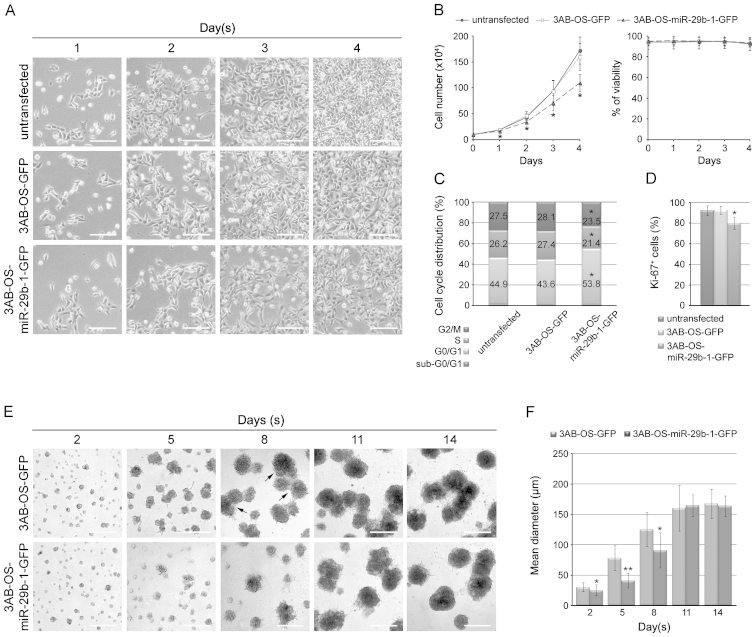
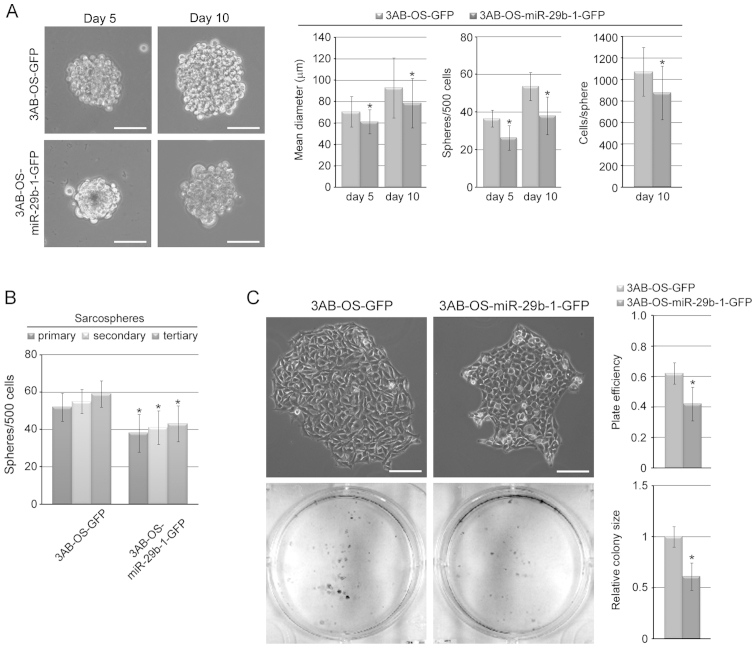
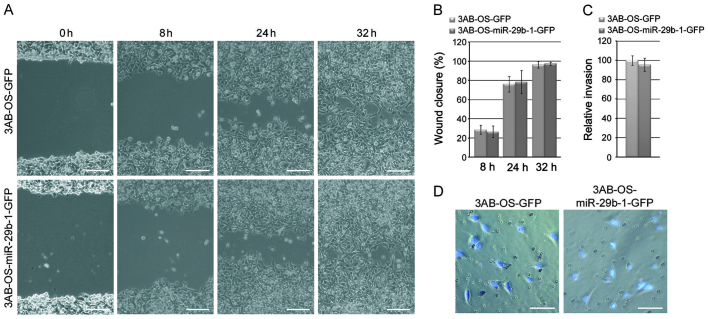
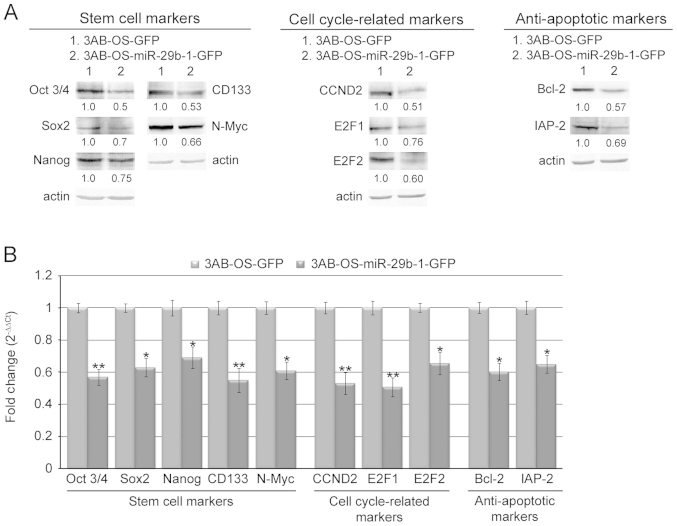
Osteosarcoma (OS) is the most common type of bone cancer, with a peak incidence in the early childhood. Emerging evidence suggests that treatments targeting cancer stem cells (CSCs) within a tumor can halt cancer and improve patient survival. MicroRNAs (miRNAs) have been implicated in the maintenance of the CSC phenotype, thus, identification of CSC-related miRNAs would provide information for a better understanding of CSCs. Downregulation of miRNA-29 family members (miR-29a/b/c; miR‑29s) was observed in human OS, however, little is known about the functions of miR-29s in human OS CSCs. Previously, during the characterization of 3AB-OS cells, a CSC line selected from human OS MG63 cells, we showed a potent downregulation of miR-29b. In this study, after stable transfection of 3AB-OS cells with miR-29b-1, we investigated the role of miR-29b-1 in regulating cell proliferation, sarcosphere-forming ability, clonogenic growth, chemosensitivity, migration and invasive ability of 3AB-OS cells, in vitro. We found that, miR-29b-1 overexpression consistently reduced both, 3AB-OS CSCs growth in two- and three-dimensional culture systems and their sarcosphere- and colony-forming ability. In addition, while miR-29b-1 overexpression sensitized 3AB-OS cells to chemotherapeutic drug-induced apoptosis, it did not influence their migratory and invasive capacities, thus suggesting a context-depending role of miR-29b-1. Using publicly available databases, we proceeded to identify potential miR-29b target genes, known to play a role in the above reported functions. Among these targets we analyzed CD133, N-Myc, CCND2, E2F1 and E2F2, Bcl-2 and IAP-2. We also analyzed the most important stemness markers as Oct3/4, Sox2 and Nanog. Real-time RT-PCR and western-blot analyses showed that miR-29b-1 negatively regulated the expression of these markers. Overall, the results show that miR-29b-1 suppresses stemness properties of 3AB-OS CSCs and suggest that developing miR-29b-1 as a novel therapeutic agent might offer benefits for OS treatment.


Figures

Figure 1
Figure 1
Evaluation of efficiency of miR-29b-1 transfection and expression in 3AB-OS cells. (A) Phase contrast (left panels) and fluorescence (middle panels) images of 3AB-OS-GFP cells (top panels) or 3AB-OS-miR-29b-1-GFP cells (bottom panels). The scale bar represents 100 μm. Cytometric analysis for the green fluorescent protein (GFP) expression (right panels) in 3AB-OS-GFP cells (top panel) and 3AB-OS-miR-29b-1-GFP cells (bottom panel). The open histogram indicates negative control (untransfected cells), filled histogram indicates the expression of GFP. Images are representative of four independent experiments. (B) Real-time RT-PCR analysis of miR-29b-1 in 3AB-OS untransfected cells, 3AB-OS-GFP cells and 3AB-OS-miR-29b-1-GFP cells. Data represent the mean with standard deviation (n=4); *P<0.01 as compared to untransfected cells.
Figure 2
Figure 2
Effect of miR-29b-1 overexpression on growth and proliferation of 3AB-OS cells. (A) Phase contrast microscopy images at days 1–4 of untransfected cells (top panels), 3AB-OS-GFP cells (middle panels) and 3AB-OS-miR-29b-1-GFP cells (bottom panels) in culture. The scale bar represents 100 μm. Images are representative of four independent experiments. (B) Growth curves (cell number) and cell viability of untransfected cells, 3AB-OS-GFP cells and 3AB-OS-miR-29b-1-GFP cells. Data represent the mean with standard deviation (n=4); *P<0.05 as compared to untransfected cells. (C) Cell cycle distributions determined using flow cytometry. Results are indicated as relative percentage of total cell cycle (*P<0.05, as untransfected cells). (D) Graph summarizing Ki-67 reactivity. Data represent the mean with standard deviation (n=4); *P<0.05 as compared to untransfected cells. (E) Phase contrast microscopy images of 3AB-OS-GFP cells (top panels) and 3AB-OS-miR-29b-1-GFP cells (bottom panels) in a three-dimensional (3D) culture model on Matrigel. The black arrows indicate multi-cellular shere structures. The scale bar represents 200 μm. Images are representative of four independent experiments. (F) Graphs summarizing size of spherical masses from 3AB-OS-GFP and 3AB-OS-miR-29b-1-GFP cells cultured in 3D (on days 2, 5, 8, 11 and 14). Data represent the mean with standard deviation (n=4); *P<0.05, **P<0.01 as compared to 3AB-OS-GFP cells.
Figure 3
Figure 3
Effect of miR-29b-1 overexpression on sarcosphere- and colony-forming ability of 3AB-OS cells. (A) Phase contrast images of primary sarcospheres formed from 3AB-OS-GFP and 3AB-OS-miR-29b-1-GFP cells after 5 and 10 days of culturing. The scale bar represents 50 μm. Graphs summarizing size and number of sarcospheres from 500 cells (days 5 and 10) and number of cells/sphere on day 10. Data represent the mean with standard deviation (n=4); *P<0.05 as compared to 3AB-OS-GFP cells. (B) Graph summarizing numbers of primary, secondary (generated from dissociated primary spheres) and tertiary (generated from dissociated secondary spheres) sarcospheres on day 10 from 500 cells. Data represent the mean with standard deviation (n=4); *P<0.05 as compared to 3AB-OS-GFP cells. (C) Clonogenic growth of 3AB-OS-GFP and 3AB-OS-miR-29b-1-GFP cells after 10 days of culture. Phase contrast images (top; the scale bar represents 100 μm) and an image (bottom) of 6-well plate after staining with methylene blue. Graphs summarizing plate efficiency (colonies/100 cells) and relative colony size (mean area relative to 3AB-OS-GFP cells). Data represent the mean with standard deviation (n=4); *P<0.05 as compared to 3AB-OS-GFP cells.
Figure 4
Figure 4
Effect of miR-29b-1 overexpression on chemosensitivity of 3AB-OS cells. Both 3AB-OS-GFP cells and 3AB-OS-miR-29b-1-GFP cells were treated with (A) doxorubicin (250 nM); (B) cisplatin (10 μM); and (C) etoposide (5 μM) for indicated times. Cell viability (left panels) was determined by trypan blue exclusion assay; apoptosis (right panels) was evaluated by flow cytometric analysis of propidium iodide DNA staining (percentages of cells in sub-G0/G1 phase). Data represent the mean with standard deviation (n=4); *P<0.05, **P<0.01 and #P<0.005 as compared to 3AB-OS-GFP cells.
Figure 5
Figure 5
Effects of miR-29b-1 overexpression on migratory and invasion ability of 3AB-OS cells. (A) Representative images from the scratch wound-healing assay in 3AB-OS-GFP cells (top panels) and 3AB-OS-miR-29b-1-GFP cells (bottom panels). Cells were scratched and wound margins were imaged 0, 8, 24 and 32 h later. The scale bar represents 100 μm. (B) Quantification of the scratch wound-healing assay. The extent of wound closure was quantified by measuring the wound area compared to the initial wound area. Data represent the mean with standard deviation (n=4; P>0.05 as compared to 3AB-OS-GFP cells). (C) Graphs summarizing relative invasion (mean of the percentage of the number of cells relative to 3AB-OS-GFP cells). Data represent the mean with standard deviation (n=4; P>0.05 as compared to 3AB-OS-GFP cells). (D) Representative images from the transwell invasion assays in 3AB-OS-GFP and 3AB-OS-miR-29b-1-GFP cells. After 48 h of incubation, cells migrated to the underside of the insert were stained with Hoechst 33342. The scale bar represents 50 μm.
Figure 6
Figure 6
Effects of miR-29b-1 overexpression on stem-cell, cell cycle and anti-apoptotic marker expression in 3AB-OS cells. (A) Western blot analysis of stemness, cell cycle and anti-apoptotic proteins. Expression level relative to 3AB-OS-GFP cells is shown below the blots. The results are representative of four independent experiments. (B) Real-time RT-PCR analysis of mRNAs related to the above reported proteins. Data represent the mean with standard deviation (n=4); *P<0.05 and **P<0.01 as compared to 3AB-OS-GFP cells.

References

    1. Ottaviani G, Jaffe N. The epidemiology of osteosarcoma. Cancer Treat Res. 2009;152:3–13. - PubMed
    1. Gorlick R, Khanna C. Osteosarcoma. J Bone Miner Res. 2010;25:683–691. - PubMed
    1. Ta HT, Dass CR, Choong PF, Dunstan DE. Osteosarcoma treatment: state of the art. Cancer Metastasis Rev. 2009;28:247–263. - PubMed
    1. Chou AJ, Gorlick R. Chemotherapy resistance in osteosarcoma: current challenges and future directions. Expert Rev Anticancer Ther. 2006;6:1075–1085. - PubMed
    1. Clevers H. The cancer stem cell: premises, promises and challenges. Nat Med. 2011;17:313–319. - PubMed

Publication types