. 2015 Jul;25(4):491-504.
doi: 10.1111/bpa.12194. Epub 2014 Nov 20.

MIF Receptor CD74 is Restricted to Microglia/Macrophages, Associated with a M1-Polarized Immune Milieu and Prolonged Patient Survival in Gliomas

Affiliations

MIF Receptor CD74 is Restricted to Microglia/Macrophages, Associated with a M1-Polarized Immune Milieu and Prolonged Patient Survival in Gliomas

Pia S Zeiner et al. Brain Pathol. 2015 Jul.

Abstract

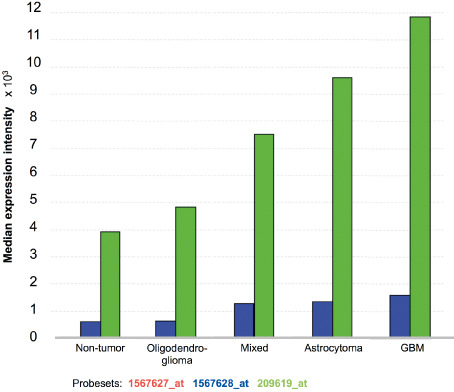
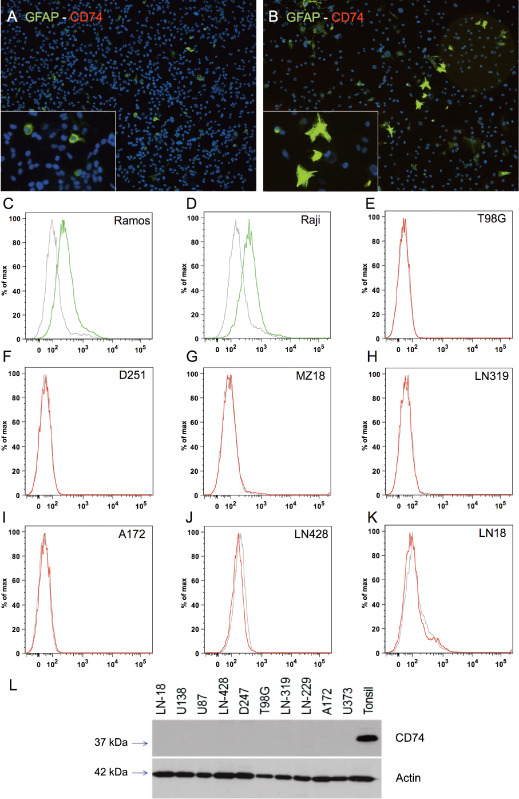
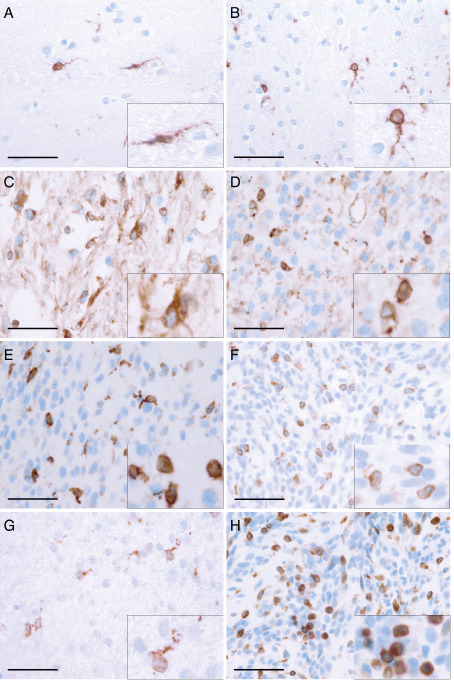
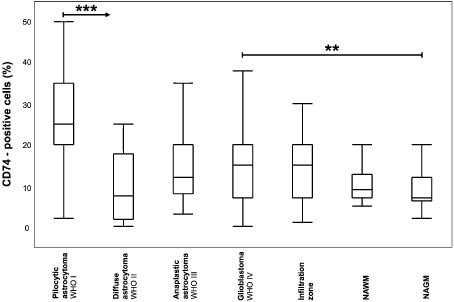
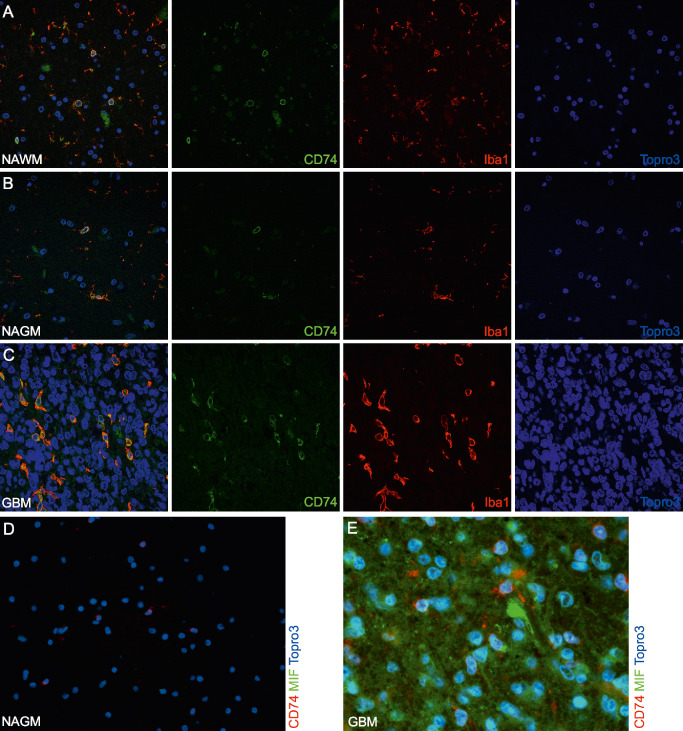
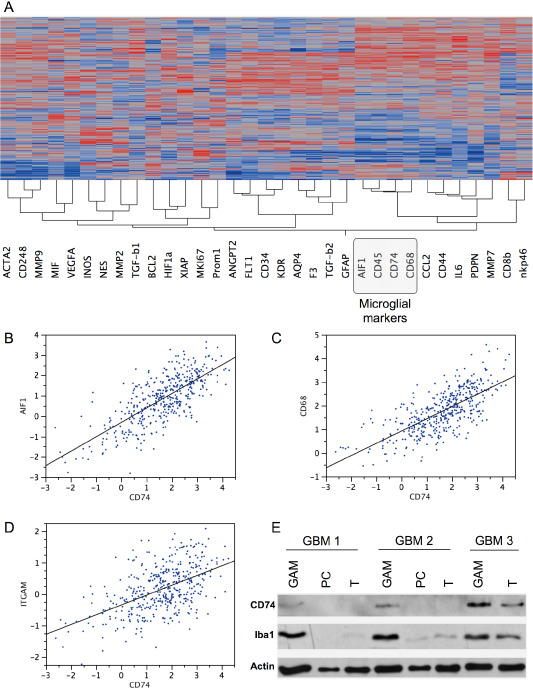
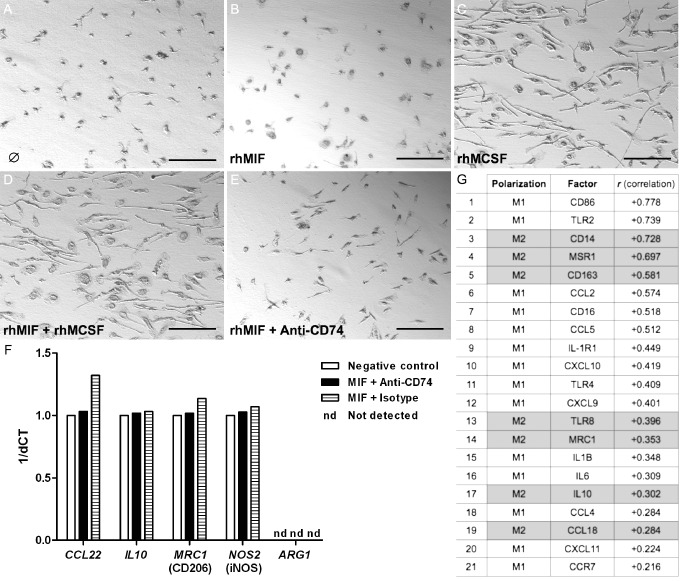
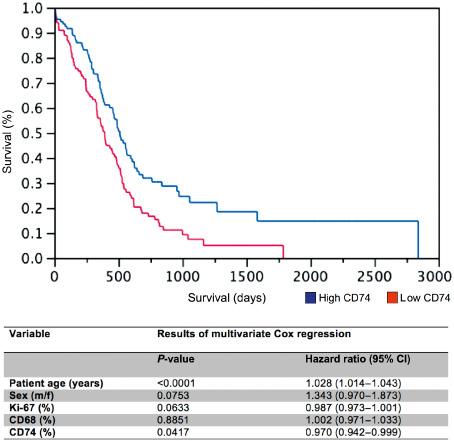
The macrophage migration inhibitory factor (MIF) receptor CD74 is overexpressed in various neoplasms, mainly in hematologic tumors, and currently investigated in clinical studies. CD74 is quickly internalized and recycles after antibody binding, therefore it constitutes an attractive target for antibody-based treatment strategies. CD74 has been further described as one of the most up-regulated molecules in human glioblastomas. To assess the potential relevance for anti-CD74 treatment, we determined the cellular source and clinicopathologic relevance of CD74 expression in human gliomas by immunohistochemistry, immunofluorescence, immunoblotting, cell sorting analysis and quantitative polymerase chain reaction (qPCR). Furthermore, we fractionated glioblastoma cells and glioma-associated microglia/macrophages (GAMs) from primary tumors and compared CD74 expression in cellular fractions with whole tumor lysates. Our results show that CD74 is restricted to GAMs in vivo, while being absent in tumor cells, the latter strongly expressing its ligand MIF. Most interestingly, a higher amount of CD74-positive GAMs was associated with beneficial patient survival constituting an independent prognostic parameter and with an anti-tumoral M1 polarization. In summary, CD74 expression in human gliomas is restricted to GAMs and positively associated with patient survival. In conclusion, CD74 represents a positive prognostic marker most probably because of its association with an M1-polarized immune milieu in high-grade gliomas.

Keywords: CD74; MIF; glioma; immune polarization.


Conflict of interest statement

The authors declare that they have no conflict of interest.

Figures

Figure 1
Figure 1
CD74 mRNA levels increase with the grade of malignancy in human glioma tissue. The Repository of Molecular Brain Neoplasia Data (REMBRANDT) data analysis of the CD74 gene expression (median expression × 103) in 454 gliomas [REMBRANDT National Institutes of Health (NIH) 2011; https://caintegrator.nci.nih.gov/rembrandt/]. Three different probesets were studied: 1567627_at (red; on chromosome 5 at 149.762876 Mb on the plus strand); 1567628_at (blue; on chromosome 5 at 149.762876 on the minus strand); 209619_at (green; on chromosome at 149.761492 Mb on the minus strand).
Figure 2
Figure 2
CD74 expression is absent in human malignant glioma cell lines. In double‐immunofluorescence (IF) staining CD74 (Alexa 568, red) was absent in all tested glioma cell lines (not shown), only glial fiber acid protein (GFAP) (Alexa 488, green) was positive in (A) U251 and (B) U373 (original magnification ×10 in A and B; images taken with the Eclipse 80i fluorescent microscope). While human lymphoma cell lines Ramos (C) and Raji (D) exhibited CD74 expression on the cell surface thereby serving as positive controls, glioma cell lines (EK) did not show CD74 expression. The CD74 immunoblot from glioma cell lysates and human tonsil as positive control showed a complete absence of CD74 protein in glioma cell lines (L).
Figure 3
Figure 3
CD74 is strongly expressed in normal and neoplastic central nervous system (CNS) tissue in vivo. Representative immunhistochemical stainings showing CD74 expression on a distinct cellular subset in (A) normal‐appearing grey matter (n = 44), (B) normal‐appearing white matter (n = 16) and astrocytomas of (C) World Health Organization (WHO) grade I (n = 47), (D) WHO grade II (n = 16), (E) WHO grade III (n = 35) as well as (F) glioblastoma, WHO grade IV (n = 252). Histomorphologic characteristics of CD74‐positive cells were also analyzed with regard to the microlocalisation such as (F) GBM tumor centers (n = 252), (G) GBM infiltration zones (n = 37) or (H) in GBM recurrence (n = 114). While in tumor centers of both primary (F) and recurrent (H) GBMs CD74 expression was detected on the surface of mostly rounded to ovoid cells, CD74 expression in normal CNS tissue (A, B) and GBM infiltration zones (G) was mainly observed on elongated cellular protrusions. (scale bars = 50 μm; inserts = higher magnification).
Figure 4
Figure 4
CD74 expression is differentially regulated in astrocytic tumors and normal central nervous system (CNS) tissues. Box and Whisker plots for CD74‐positive cells (in %) in astrocytomas IIV, GBM infiltration zones as well as normal‐appearing CNS tissues are depicted. The relative amount of CD74‐positive cells in pilocytic astrocytoma, World Health Organization (WHO) grade I (n = 47); diffuse astrocytoma WHO grade II (n = 16); anaplastic astrocytoma WHO grade III (n = 35); glioblastoma WHO grade IV (n = 252), GBM infiltration zone (n = 37), normal‐appearing white matter of GBM samples (NAWM; n = 16) as well as normal‐appearing grey matter of GBM samples (NAGM; n = 44) was statistically assessed using the nonparametric Wilcoxon's test. A significance level of alpha = 0.05 was chosen for all testings. For adjustment of the P‐values because of multiple testing we used the method of Bonferroni–Holm. Statistical analysis was performed using JMP 8.0.1 software (SAS).
Figure 5
Figure 5
CD74 expression in vivo is restricted to microglia cells in normal central nervous system (CNS) tissues as well as glioma‐associated microglia/macrophages (GAMs) in gliomas. Representative double‐immunofluorescence (IF) stainings of CD74 (Alexa 488, green) and the microglia/macrophage marker Iba1 (Alexa 568, red) show a colocalization in (A) normal white (n = 4), (B) grey matter (n = 4) and (C) glioblastoma World Health Organization (WHO) grade IV (n = 15) samples (images AC were taken with the C1 confocal microscope). No colocalization of the ligand migration inhibitory factor (MIF) (Alexa 488, green) and its receptor CD74 (Alexa 568, red) was seen in (D) normal brain or (E) glioblastoma WHO grade IV samples (images DE were taken with the Eclipse 80i fluorescent microscope; original magnification AD: 20×; E: 40×). In addition, pilocytic astrocytoma WHO grade I (n = 2) as well as WHO grade II (n = 2) and III (n = 2) astrocytomas were assessed revealing similar staining results (data not shown).
Figure 6
Figure 6
CD74 mRNA and protein levels correlate with the content of glioma‐associated microglia/macrophages (GAMs). Hierarchical cluster analyses (A) of gene expression signatures of selected key factors of immune cells, glioblastoma cells as well as glioblastoma micromilieu of 424 primary glioblastomas and 11 normal brain samples deriving from the cancer genome atlas (TCGA) data portal using the Agilent 244K G4502A microarray to determine mRNA profiles. Hierarchical clustering of this data was performed using the Ward's minimum variance method. Dark red color indicates a perfect positive correlation (+1) gradually decreasing to a perfect negative correlation (−1) indicated in blue. Correlation analyses of the same data subset comparing CD74 with either (B) Iba1 (AIF1), (C) CD68 or (D) CD11b (ITGAM) are depicted. CD74 and Iba1 immunoblotting (E) of GAMs, glioblastoma cells (PC) and whole glioblastoma tissue (T) of three different patients with primary glioblastoma World Health Organization (WHO) grade IV showing a positive correlation of CD74 and Iba1 protein expression. Actin served as positive control.
Figure 7
Figure 7
The migration inhibitory factor (MIF)‐CD74 system is associated with a distinct M1‐polarized, phagocytic glioma‐associated microglia/macrophage (GAM)‐phenotype in glioblastomas. Light microscopy of unstimulated GAMs (A) or GAMs after stimulation with (B) recombinant human MIF (rhMIF) 10 ng/mL, (C) human recombinant macrophage colony stimulating factor (rhMCSF) 10 ng/mL, (D) rhMIF 10 ng/mL and rhMCSF 10 ng/mL, (E) rhMIF 10 ng/mL and neutralizing anti‐CD74 antibody (GAM in AE were derived from glioblastoma World Health Organization (WHO) grade IV). (F) Differential mRNA expression for classical M1/M2 molecules as assessed by quantitative polymerase chain reaction (qPCR) [using TaqMan Fast Universal PCR Master Mix, the target assay (Applied Biosystems) and 20 ng of complementary DNA (cDNA) ] did not reveal any considerable differences between the stimulation of GAMs with MIF and an anti‐CD74 approach as compared with the IgG1 isotype (at the same concentration as anti‐CD74 antibody) or negative (bovine serum albumin at 10 ng/mL also serving as diluent for rhMIF) control. (G) Analyses of the cancer genome atlas (TCGA) data using the R2 platform revealed a distinct, mainly M1‐based profile with additional phagocytic or adhesion molecules (correlation with CD74 expression is given in descending order).
Figure 8
Figure 8
The amount of CD74‐positive glioma‐associated microglia/macrophages (GAMs) is an independent prognostic marker for patient survival in GBM. Kaplan–Meier survival curves of GBM patients were obtained by performing median split for CD74 (high expression > 15% CD74‐positive GAMs; low expression ≤ 15% CD74‐positive GAMs) levels. Curves were compared by both log–rank (P = 0.0018) and Wilcoxon (P = 0.0066) tests. Multivariate analysis was performed using the Cox proportional hazard model controlling for CD74‐positive GAMs (positive cells/all cells), Ki67 proliferation rate, CD68‐positive GAMs, sex and patient age.

References

    1. Al Abed Y, Dabideen D, Aljabari B, Valster A, Messmer D, Ochani M et al (2005) ISO‐1 binding to the tautomerase active site of MIF inhibits its pro‐inflammatory activity and increases survival in severe sepsis. J Biol Chem 280:36541–36544. - PubMed
    1. An JH, Lee SY, Jeon JY, Cho KG, Kim SU, Lee MA (2009) Identification of gliotropic factors that induce human stem cell migration to malignant tumor. J Proteome Res 8:2873–2881. - PubMed
    1. Apte RS, Sinha D, Mayhew E, Wistow GJ, Niederkorn JY (1998) Cutting edge: role of macrophage migration inhibitory factor in inhibiting NK cell activity and preserving immune privilege. J Immunol 160:5693–5696. - PubMed
    1. Bacher M, Schrader J, Thompson N, Kuschela K, Gemsa D, Waeber G, Schlegel J (2003) Up‐regulation of macrophage migration inhibitory factor gene and protein expression in glial tumour cells during hypoxic and hypoglycemic stress indicates a critical role for angiogenesis in glioblastoma multiforme. Am J Pathol 162:11–17. - PMC - PubMed
    1. Baron N, Deuster O, Noelker C, Stüer C, Strik H, Schaller C et al (2011) Role of macrophage migration inhibitory factor in primary glioblastoma multiforme cells. J Neurosci Res 89:711–717. - PubMed

MeSH terms