. 2014 Sep 11;8(5):1509-21.
doi: 10.1016/j.celrep.2014.07.061. Epub 2014 Aug 28.

Autophagy impairment in muscle induces neuromuscular junction degeneration and precocious aging

Affiliations

Autophagy impairment in muscle induces neuromuscular junction degeneration and precocious aging

Silvia Carnio et al. Cell Rep. .

Abstract

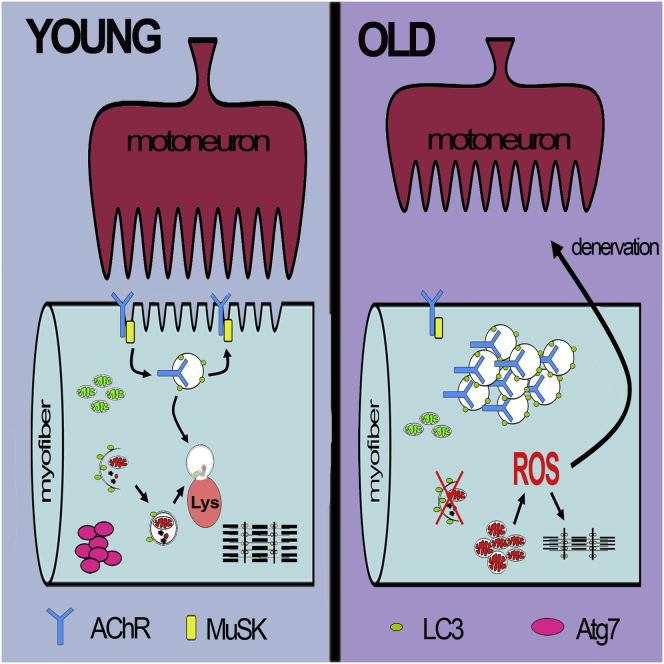
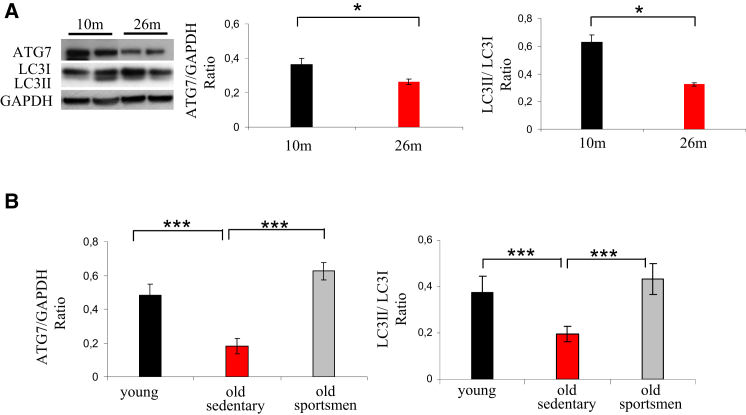
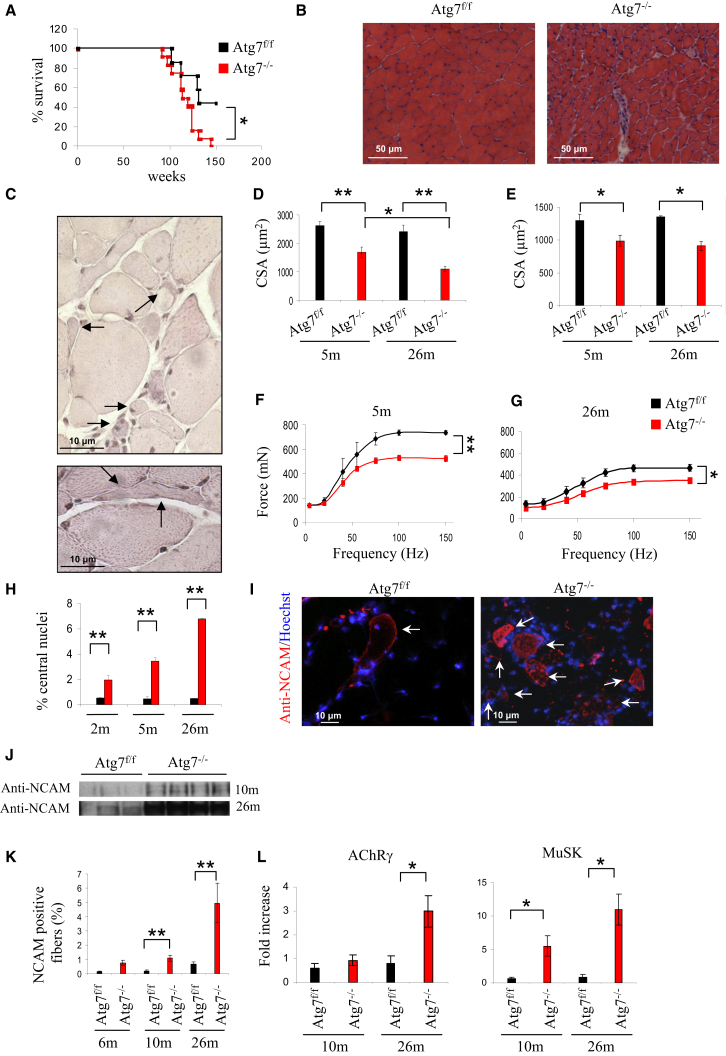
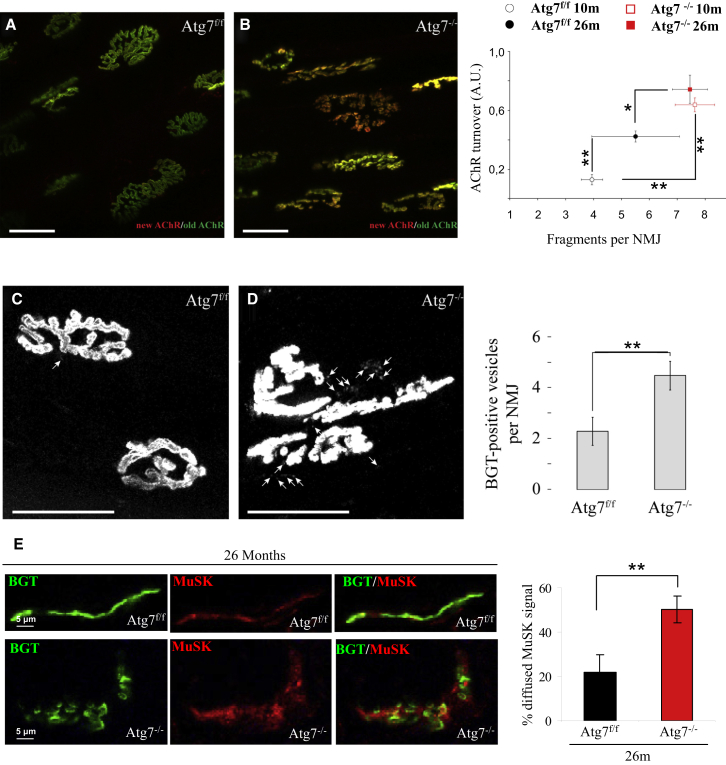
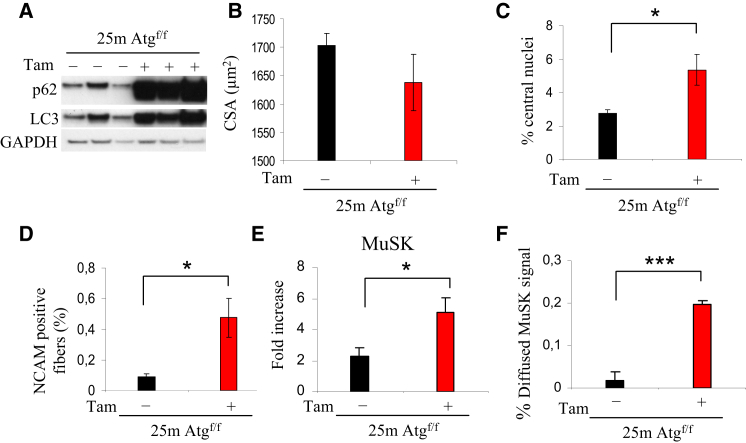
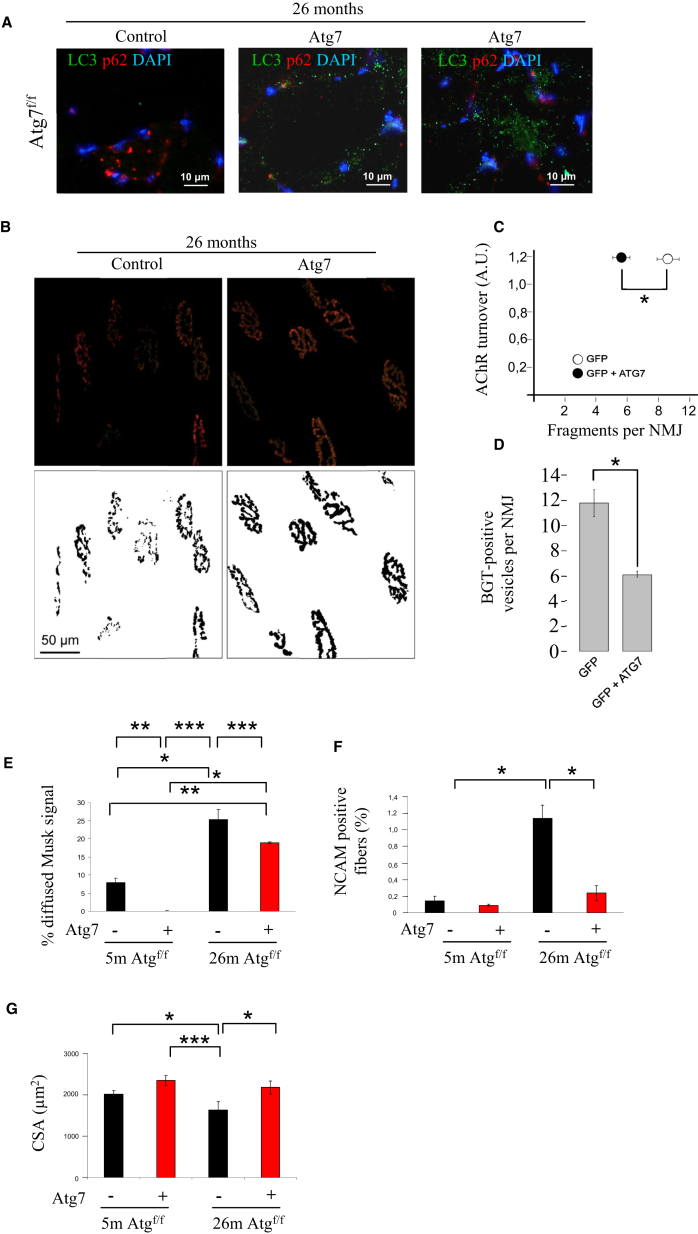
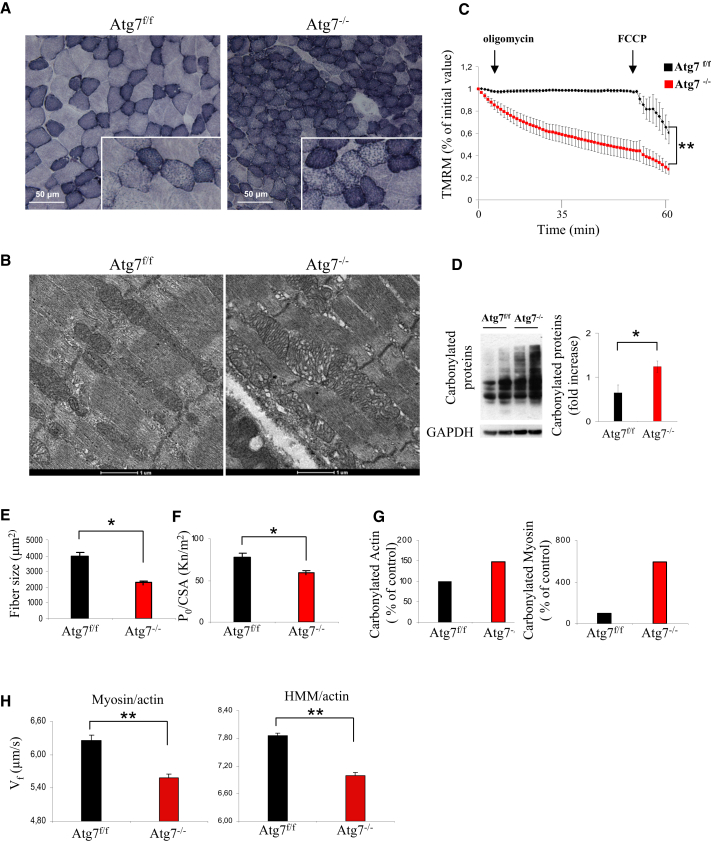
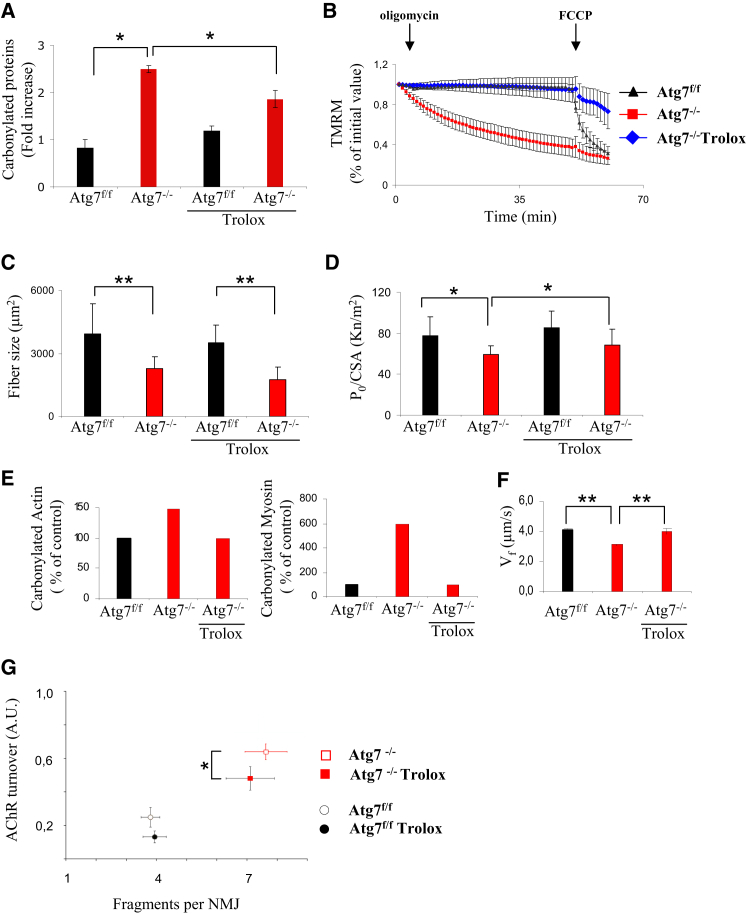
The cellular basis of age-related tissue deterioration remains largely obscure. The ability to activate compensatory mechanisms in response to environmental stress is an important factor for survival and maintenance of cellular functions. Autophagy is activated both under short and prolonged stress and is required to clear the cell of dysfunctional organelles and altered proteins. We report that specific autophagy inhibition in muscle has a major impact on neuromuscular synaptic function and, consequently, on muscle strength, ultimately affecting the lifespan of animals. Inhibition of autophagy also exacerbates aging phenotypes in muscle, such as mitochondrial dysfunction, oxidative stress, and profound weakness. Mitochondrial dysfunction and oxidative stress directly affect acto-myosin interaction and force generation but show a limited effect on stability of neuromuscular synapses. These results demonstrate that age-related deterioration of synaptic structure and function is exacerbated by defective autophagy.


Figures

None
Graphical abstract
Figure 1
Figure 1
Autophagy Is Impaired during Aging (A) Representative immunoblotting for the critical E1-like enzyme, ATG7, LC3II, and LC3I on muscle extracts from gastrocnemius of 10- and 26-month-old mice. The graphs show the quantification of ATG7 protein and the LC3II/LC3I ratio. Values are mean ± SEM; n = 4 of each condition; p < 0.05. (B) Aging reduces whereas exercise maintains expression of ATG7 and LC3 lipidation in humans. The graphs show the quantification of ATG7 protein and LC3II/LC3I ratio revealed by immunoblotting on muscle biopsies. Values are mean ± SEM; n = 6 young; n = 10 elderly, sedentary men; and n = 4 senior sportsmen; ∗∗∗p < 0.0001.
Figure 2
Figure 2
Morphological and Functional Changes in Muscles of Atg7−/− during Aging (A) Kaplan-Meier curve of Atg7f/f and Atg7−/− mice. Atg7−/− mice die earlier than their Atg7f/f counterparts. Comparison of Atg7f/f and Atg7−/− survival curves was performed by both Mantel-Cox and Gehan-Breslow-Wilcoxon tests. Atg7−/− mice show a significant reduction in the lifespan compared to controls (p < 0.05). (B) Morphological analyses of aged Atg7f/f and Atg7−/− tibialis anterior (TA) muscles. H&E staining shows that Atg7−/− muscles are atrophic with interstitial inflammation and center-nucleated fibers. (C) Higher magnification of atrophic fibers of aged Atg7−/− mice showing angular, flat fibers and extremely small fibers (arrows). (D) Quantification of the cross-sectional area (CSA) of glycolitic myofibers in TA muscles of adult and aged Atg7f/f and Atg7−/− mice. Values are mean ± SEM. At least four muscles of each group were analyzed; ∗∗p < 0.01; p < 0.05. (E) Quantification of CSA of oxidative myofibers of TA. Values are mean ± SEM; n > 4 for each group; p < 0.05. (F and G) Force measurements performed in vivo. (F) Atg7−/− mice show a profound decrease in maximal force generation in adult animals. Values are mean ± SEM (n = 5); ∗∗p < 0.01. (G) Aging reduces force production in both Atg7f/f and Atg7−/− mice, therefore aggravating the already profound weakness of Atg7−/− mice. Values are mean ± SEM; n = 4; p < 0.05. (H) Quantification of center-nucleated myofibers in TA (n > 4 for each group; ∗∗p < 0.01). Values are mean ± SEM. (I) Representative images of immunostaining for NCAM expression in aged mice. Localization of NCAM along the entire fibers indicates the loss of muscle-nerve interaction. (J) Immunoblotting for NCAM protein on muscle extracts from adult and aged gastrocnemius muscles. Atg7−/− muscles express higher levels of NCAM than age-matched Atg7f/f. (K) Quantification of NCAM-positive fibers. Values were normalized for the total number of myofibers in muscle section (at least four muscles of each group were analyzed; ∗∗p < 0.01). Atg7−/− mice are characterized by much-higher age-dependent increase in NCAM-positive fibers than age-matched Atg7f/f. Values are mean ± SEM. (L) Expression levels of acetylcholine receptor AChR γ-subunit (CHRNG) (left) and MuSK (right). MuSK and AChR are upregulated in adult and aged Atg7−/− muscles (n > 5; p < 0.05). Values are mean ± SEM.
Figure 3
Figure 3
Neuromuscular Junctions of Atg7−/− Myofibers Are Unstable and Fragmented (A and B) Representative images of Atg7f/f and Atg7−/− neuromuscular junctions (NMJ) obtained using confocal in vivo microscopy. Muscles were in vivo pulse labeled with bungarotoxins (BGTs) conjugated with different fluorophores. BGT-Alexa Fluor 647 (shown in green) was injected 10 days before microscopy, thus identifying stable AChR, whereas BGT-Alexa Fluor 555 (shown in red), injected 1 hr prior to microscopy, identifies newly incorporated AChR. Micrographs show representative maximum z projections of confocal in vivo images of NMJs from Atg7f/f (A) and Atg7−/− (B). The panel on the right shows the quantification of AChR turnover as a function of NMJ fragmentation of adult and aged Atg7f/f versus Atg7−/−. Data are from at least four muscles of each group; ∗∗p < 0.01; p < 0.05. A.U., arbitrary units. In the right panel of (B), values are mean ± SEM. (C and D) Muscles were labeled with BGT-Alexa Fluor 555 48 hr before microscopy. In vivo confocal imaging was used to determine the amount of structures containing endocytic AChR. Micrographs show representative maximum z projections of confocal in vivo images of NMJs from Atg7f/f (C) and Atg7−/− (D). The panel on the right shows the average number of vesicular BGT-Alexa Fluor 555-positive structures per optical section. Data from 13 and 27 NMJs for Atg7f/f and Atg7−/−, respectively; ∗∗p < 0.01. In the right panel of (D), values are mean ± SEM. (E) Immunohistochemistry of MuSK expression on aged Atg7f/f and Atg7−/− myofibers. Upper panel shows normal pattern of NMJs in Atg7f/f mice, where MuSK (red) localizes to NMJ, revealed by BGT-Alexa Fluor 647 (green). Lower panel shows MuSK (red) that accumulates inside myofibers at the level of NMJ (green). Panel on the right shows that the amount of diffused MuSK staining normalized over the total number of MuSK-positive NMJs is higher in aged Atg7−/− than Atg7f/f; ∗∗p < 0.01. In the right panel, values are mean ± SEM.
Figure 4
Figure 4
Acute Inhibition of Autophagy in Aged Mice Exacerbates Features of Sarcopenia and NMJ Degeneration (A) Immunoblotting for LC3 and p62 proteins on muscle extracts from 25-month-old tamoxifen-inducible Atg7−/− female mice. Three months after the tamoxifen treatment, skeletal muscles were collected and analyzed. (B) Acute inhibition of autophagy in old mice induces muscle degeneration. Quantification of the CSA of myofibers in TA muscles of aged tamoxifen-inducible Atg7−/− and Atg7f/f mice. Values are mean ± SEM; at least five muscles of each group were analyzed. (C) Quantification of center-nucleated myofibers in TA of tamoxifen-inducible Atg7−/− (n > 5 for each group; p < 0.05). Values are mean ± SEM. (D) Acute inhibition of Atg7 in aged female mice increases the number of denervated NCAM-positive fibers when compared to age-matched controls. Values were normalized for the total number of myofibers in muscle section (at least five muscles of each group were analyzed; p < 0.05). Values are mean ± SEM. (E) Expression levels of MuSK after acute inhibition of Atg7 in old mice. MuSK is upregulated in aged tamoxifen-inducible Atg7−/− muscles (p < 0.05; n > 5). Values are mean ± SEM. (F) Acute inhibition of autophagy in aged mice led to an increased amount of diffused MuSK staining; at least four muscles of each group were analyzed; ∗∗∗p < 0.001. Values are mean ± SEM.
Figure 5
Figure 5
Rescue of Atg7 Expression in Aged Mice Improves Neuromuscular Synaptic Function (A) Rescue of Atg7 expression restores autophagosome formation in 26-month-old mice. TA muscles were transfected with Atg7 expression plasmid, and 14 days later, TA were collected and stained for LC3 (green), p62 (red), and nuclei (blue). (B) Confocal in vivo microscopy showing that rescue of ATG7 expression greatly reduces AChR fragmentation (data from at least four muscles per group; p < 0.05) of aged Atg7f/f mice. Representative images are shown. (C) Quantification of the AChR turnover as a function of NMJ fragmentation of aged Atg7f/f. Restoring Atg7 expression greatly improves NMJ fragmentation; n = 189 NMJs for Atg7f/f -GFP and 158 Atg7f/f GFP-ATG7; ∗∗p < 0.01. Values are mean ± SEM. (D) Average number of vesicular BGT-Alexa Fluor 555-positive structures per optical section. Data from 189 NMJs for Atg7f/f -GFP and 158 Atg7f/f GFP-ATG7, respectively; p < 0.05. Values are mean ± SEM. (E) Rescue of Atg7 expression and autophagy in aged mice decreased the amount of diffused MuSK staining (at least three muscles of each group were analyzed; ∗∗∗p < 0.001; ∗∗p < 0.01; p < 0.05). Values are mean ± SEM. (F) Restoring Atg7 expression in aged mice improves the number of denervated NCAM-positive fibers when compared to age-matched controls and adult mice (three muscles of each group were analyzed; p < 0.05). Values are mean ± SEM. (G) Quantification of the CSA of myofibers in TA muscles of adult and aged Atg7f/f in presence or absence of Atg7 expression. Values are mean ± SEM; at least three muscles of each group were analyzed; p < 0.05.
Figure 6
Figure 6
Autophagy Inhibition Induces Oxidative Stress and Mitochondrial Dysfunction (A) SDH staining on serial sections of aged Atg7f/f and Atg7−/− muscles (TA) shows an accumulation of abnormal mitochondria in Atg7−/− myofibers. (B) Electron microscopy images of extensor digitorum longus muscles from aged Atg7f/f and Atg7−/− mice show accumulation of abnormal mitochondria displaying alterations in size, cristae morphology, and matrix density. (C) Measurement of mitochondrial membrane potential. TMRM staining was monitored in at least 20 fibers per group (∗∗p < 0.001). Values are mean ± SEM. (D) Overall protein carbonylation of aged Atg7f/f and Atg7−/− muscles, revealed by Oxyblot. A representative immunoblot for carbonylated proteins is depicted on the left, and densitometric quantification of the carbonylated proteins is in the graph on the right. Aged Atg7−/− mice show higher ongoing protein carbonylation than Atg7f/f (n = 5; p < 0.05). Values are mean ± SEM. (E and F) In vitro analysis of isolated skinned muscle fibers from gastrocnemius muscles of Atg7f/f and Atg7−/−. (E) Single Atg7−/− myofibers are more atrophic (E) and weaker (F) than Atg7f/f counterparts (at least 20 fibers for each condition; p < 0.05). Values are mean ± SEM. (G) Carbonylation of the pooled actin (on the left) and myosin (on the right) proteins, extracted from Atg7f/f and Atg7−/− GCN and used for in vitro motility assay. Atg7−/− show higher carbonylation than Atg7f/f. (H) In vitro motility assay reveals reduced actin sliding velocity (Vf) on myosin (left panel) and HMM (right panel) extracted from adult Atg7−/− muscles in comparison with Atg7f/f. Reduced actin sliding velocity was statistically significant in Atg7−/− (n = 4 of each condition; ∗∗p < 0.01) on both myosin and HMM. Values are mean ± SEM.
Figure 7
Figure 7
Inhibition of Oxidative Stress Restores the Ability of Mitochondria to Maintain Membrane Potential and the Functionality of Actin-Myosin Complex but Shows Limited Effect on NMJ (A) Trolox treatment reduces the level of overall protein carbonylation in Atg7−/− muscles, thus abolishing the difference with Atg7f/f (n = 4 mice per condition; p < 0.05). Values are mean ± SEM. (B) Trolox treatment restores the ability of Atg7−/− mitochondria to maintain membrane potential (n > 20 fibers per group; ∗∗p < 0.001). Values are mean ± SEM. (C) Trolox treatment does not affect fiber size in both Atg7f/f and Atg7−/− muscles (n = 4 mice per condition; ∗∗p < 0.01). Values are mean ± SEM. (D) In vitro isolated skinned fiber analysis: Trolox treatment rescues the specific muscle force of isolated Atg7−/− myofibers; data re-expressed as mean ± SD; n = 4 mice per condition; p < 0.05. (E) Trolox treatment reduces the level of actin (left panel) and myosin (right panel) protein carbonylation in Atg7−/− muscles, thus abolishing the difference with Atg7f/f; n = 4 samples. Values are mean ± SEM. (F) Trolox treatment rescues actin sliding velocity (Vf) in adult Atg7−/− muscles in in vitro motility assay; n = 4 mice per condition; ∗∗p < 0.01. Values are mean ± SEM. (G) Confocal in vivo microscopy showing that Trolox treatment slightly reduces AChR turnover (data from at least four muscles per group; p < 0.05) but does not have any effect on NMJ fragmentation of adult Atg7f/f and Atg7−/− mice. Values are mean ± SEM.

References

    1. Anson M., Drummond D.R., Geeves M.A., Hennessey E.S., Ritchie M.D., Sparrow J.C. Actomyosin kinetics and in vitro motility of wild-type Drosophila actin and the effects of two mutations in the Act88F gene. Biophys. J. 1995;68:1991–2003. - PMC - PubMed
    1. Blaauw B., Mammucari C., Toniolo L., Agatea L., Abraham R., Sandri M., Reggiani C., Schiaffino S. Akt activation prevents the force drop induced by eccentric contractions in dystrophin-deficient skeletal muscle. Hum. Mol. Genet. 2008;17:3686–3696. - PubMed
    1. Bottinelli R., Canepari M., Pellegrino M.A., Reggiani C. Force-velocity properties of human skeletal muscle fibres: myosin heavy chain isoform and temperature dependence. J. Physiol. 1996;495:573–586. - PMC - PubMed
    1. Bottinelli R., Pellegrino M.A., Canepari M., Rossi R., Reggiani C. Specific contributions of various muscle fibre types to human muscle performance: an in vitro study. J. Electromyogr. Kinesiol. 1999;9:87–95. - PubMed
    1. Canepari M., Rossi R., Pellegrino M.A., Bottinelli R., Schiaffino S., Reggiani C. Functional diversity between orthologous myosins with minimal sequence diversity. J. Muscle Res. Cell Motil. 2000;21:375–382. - PubMed

Publication types