. 2014 Aug 13:5:402.
doi: 10.3389/fmicb.2014.00402. eCollection 2014.

Aromatic inhibitors derived from ammonia-pretreated lignocellulose hinder bacterial ethanologenesis by activating regulatory circuits controlling inhibitor efflux and detoxification

Affiliations

Aromatic inhibitors derived from ammonia-pretreated lignocellulose hinder bacterial ethanologenesis by activating regulatory circuits controlling inhibitor efflux and detoxification

David H Keating et al. Front Microbiol. .

Abstract

Efficient microbial conversion of lignocellulosic hydrolysates to biofuels is a key barrier to the economically viable deployment of lignocellulosic biofuels. A chief contributor to this barrier is the impact on microbial processes and energy metabolism of lignocellulose-derived inhibitors, including phenolic carboxylates, phenolic amides (for ammonia-pretreated biomass), phenolic aldehydes, and furfurals. To understand the bacterial pathways induced by inhibitors present in ammonia-pretreated biomass hydrolysates, which are less well studied than acid-pretreated biomass hydrolysates, we developed and exploited synthetic mimics of ammonia-pretreated corn stover hydrolysate (ACSH). To determine regulatory responses to the inhibitors normally present in ACSH, we measured transcript and protein levels in an Escherichia coli ethanologen using RNA-seq and quantitative proteomics during fermentation to ethanol of synthetic hydrolysates containing or lacking the inhibitors. Our study identified four major regulators mediating these responses, the MarA/SoxS/Rob network, AaeR, FrmR, and YqhC. Induction of these regulons was correlated with a reduced rate of ethanol production, buildup of pyruvate, depletion of ATP and NAD(P)H, and an inhibition of xylose conversion. The aromatic aldehyde inhibitor 5-hydroxymethylfurfural appeared to be reduced to its alcohol form by the ethanologen during fermentation, whereas phenolic acid and amide inhibitors were not metabolized. Together, our findings establish that the major regulatory responses to lignocellulose-derived inhibitors are mediated by transcriptional rather than translational regulators, suggest that energy consumed for inhibitor efflux and detoxification may limit biofuel production, and identify a network of regulators for future synthetic biology efforts.

Keywords: Escherichia coli; RNAseq; aromatic inhibitors; biofuels; ethanol; lignocellulosic hydrolysate; proteomics; transcriptomics.


Figures
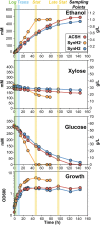
Figure 1
Figure 1
Growth, sugar utilization, and ethanol production of GLBRCE1 in ACSH, SynH2, and SynH2. GLBRCE1 was cultured under anaerobic conditions at 37°C in a bioreactor in ACSH, SynH2, or SynH2 (SynH2 lacking aromatic inhibitors; Materials and Methods). Cell density measurements (bottom panel), changes in glucose and xylose concentrations in the extracellular medium (middle panels), and ethanol concentrations in the vessel (top panel) were periodically determined and plotted relative to time. Blue, green, and yellow shaded bars represent points at which samples for metabolite, RNA, and protein analyses were collected during exponential, transition, and stationary phases of growth.
Figure 2
Figure 2
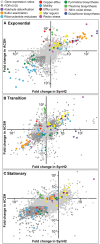
Relative gene expression patterns in SynH2 and ACSH cells relative to SynH2 cells. Scatter plots were prepared with the ACSH/SynH2 gene expression ratios plotted on the y-axis and the SynH2/SynH2 ratios on the x-axis (both on a log10 scale). GLBRCE1 was cultured in a bioreactor anaerobically (Figure 1 and Figure S5); RNAs were prepared from exponential (A), transition (B), or stationary (C) phase cells and subjected to RNA-seq analysis (Materials and Methods). Dark gray dots represent genes for which p = 0.05 for each expression ratio. Sets of genes with related functions that exhibited significant discrepant or parallel changes are color-coded and described in the legend at the top (see also Tables S3, S4, respectively).
Figure 3
Figure 3
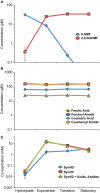
Growth phase-dependent changes in SynH2 aromatic inhibitor levels. GLBRCE1 was cultured under anaerobic conditions in SynH2 in bioreactors. Levels of the major LC-derived inhibitors in the culture medium were determined as described in Materials and Methods. “Hydrolysate” refers to medium immediately prior to inoculation, “Exp,” “Trans,” and “Stat” refers to samples collected during exponential, transition, and stationary phase growth, respectively. (A) Metabolic fate of hydroxymethylfurfural (HMF). Concentrations of HMF and 2,5-bis-HMF (2,5-bis-hydroxymethylfurfuryl alcohol) are represented. (B) Metabolic fates of the major aromatic acids and amides. Concentrations of ferulic acid, feruloyl amide, coumaric acid, and coumaroyl amide are shown. (C) Concentration of acetaldehyde in the culture medium when GLBRCE1 was grown in SynH2, SynH2, or SynH2 with aromatic aldehydes only omitted.
Figure 4
Figure 4
Relative metabolite levels in SynH2 and SynH2 cells. GLBRCE1 was cultured anaerobically in bioreactors in SynH2 and SynH2. Metabolites were prepared from exponential phase cells and analyzed as described in the Material and Methods. Shown are intracellular concentrations of ATP (A), pyruvate (B), fructose-1,6-bisphosphate (E), and cAMP (F). (C,D) show the ratios of NADH/NAD+ and NADPH/NADP+, respectively.
Figure 5
Figure 5
Growth phase-dependent changes in inhibitor-responsive gene expression. Changes in RNA levels for genes that comprise the major regulatory response to aromatic inhibitors in SynH2. Shown are normalized RNA-seq measurements (top panel) from GLBRCE1 grown in SynH2 (solid lines) or SynH2 (dotted lines) or their relative ratios (bottom panel) from exponential, transition, and stationary phases of growth as indicated. (A) Aldehyde detoxification genes (frmA, frmB, dkgA, and yqhC). (B) Genes that encode efflux pumps (aaeA, aaeB, acrA, acrB).
Figure 6
Figure 6
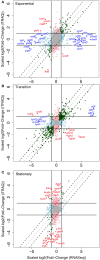
Effects of aromatic inhibitors on protein levels compared to effects on cognate RNA levels. Scatter plot comparing log2-fold RNA ratios (x-axis) to log2-fold protein ratios (y-axis) of GLBRCE1 genes and gene products for cells for grown in SynH2 compared to the reference medium, SynH2. Cells were collected and proteomic samples prepared from exponential (A), transition (B), and stationary (C) growth phases. The lines indicate boundaries beyond which changes exceed 2-fold. The dotted lines demarcate the area expected for parallel changes in protein and RNA levels. Red, genes for which changes in protein levels were not paralleled by changes in the corresponding RNA and for which the discrepancy had a p ≤ 0.05 (see Table S7). Blue, genes for which changes in RNA levels were not paralleled by changes in the corresponding protein and for which the discrepancy had a p ≤ 0.05. Gray, p > 0.05 for both RNA and protein ratios. Light blue, p ≤ 0.05 for RNA ratio but not for protein ratio. Light pink, p ≤ 0.05 for protein ratio but not for RNA ratio. Green, p ≤ 0.05 for both RNA and protein ratios and effects are parallel.
Figure 7
Figure 7
Major Regulatory responses of E. coli to aromatic inhibitors found in ACSH. The major E. coli responses to phenolic carboxylates and amides (left) or responses to aldehydes (right) are depicted. Green panels, regulators and signaling interactions that mediate the regulatory responses. Pink panels, direct targets of the regulators that consume reductant (NADPH) for detoxification reactions or deplete the proton motive force through continuous antiporter efflux of aromatic carboxylates. Blue panels, indirect effects of inhibitors mediated by reductions in ATP and NADPH levels.

References

    1. Bantscheff M., Boesche M., Eberhard D., Matthieson T., Sweetman G., Kuster B. (2008). Robust and sensitive iTRAQ quantification on an LTQ Orbitrap mass spectrometer. Mol. Cell. Proteomics 7, 1702–1713. 10.1074/mcp.M800029-MCP200 - DOI - PMC - PubMed
    1. Booth I. R., Ferguson G. P., Miller S., Li C., Gunasekera B., Kinghorn S. (2003). Bacterial production of methylglyoxal: a survival strategy or death by misadventure? Biochem. Soc. Trans. 31, 1406–1408. 10.1042/BST0311406 - DOI - PubMed
    1. Buescher J. M., Moco S., Sauer U., Zamboni N. (2010). Ultrahigh performance liquid chromatography-tandem mass spectrometry method for fast and robust quantification of anionic and aromatic metabolites. Anal. Chem. 82, 4403–4412. 10.1021/ac100101d - DOI - PubMed
    1. Chubiz L. M., Glekas G. D., Rao C. V. (2012). Transcriptional cross talk within the mar-sox-rob regulon in Escherichia coli is limited to the rob and marRAB operons. J. Bacteriol. 194, 4867–4875. 10.1128/JB.00680-12 - DOI - PMC - PubMed
    1. Chubiz L. M., Rao C. V. (2010). Aromatic acid metabolites of Escherichia coli K-12 can induce the marRAB operon. J. Bacteriol. 192, 4786–4789. 10.1128/JB.00371-10 - DOI - PMC - PubMed