

Phenome-wide association studies demonstrating pleiotropy of genetic variants within FTO with and without adjustment for body mass index
- PMID: 25177340
- PMCID: PMC4134007
- DOI: 10.3389/fgene.2014.00250
Phenome-wide association studies demonstrating pleiotropy of genetic variants within FTO with and without adjustment for body mass index
Abstract
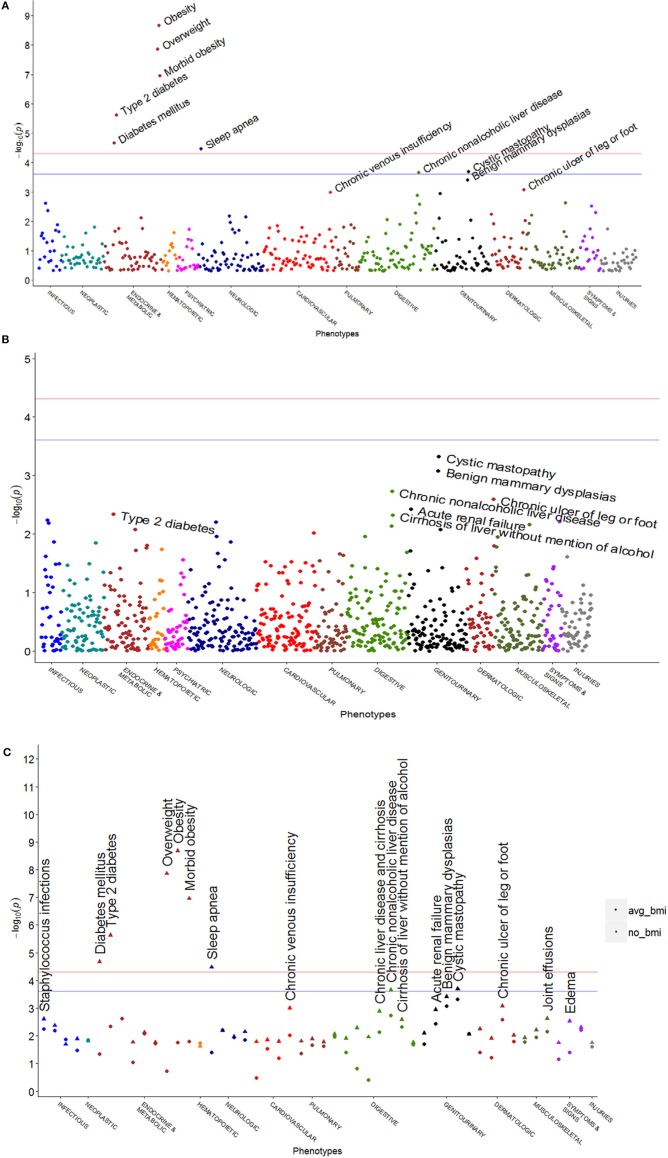
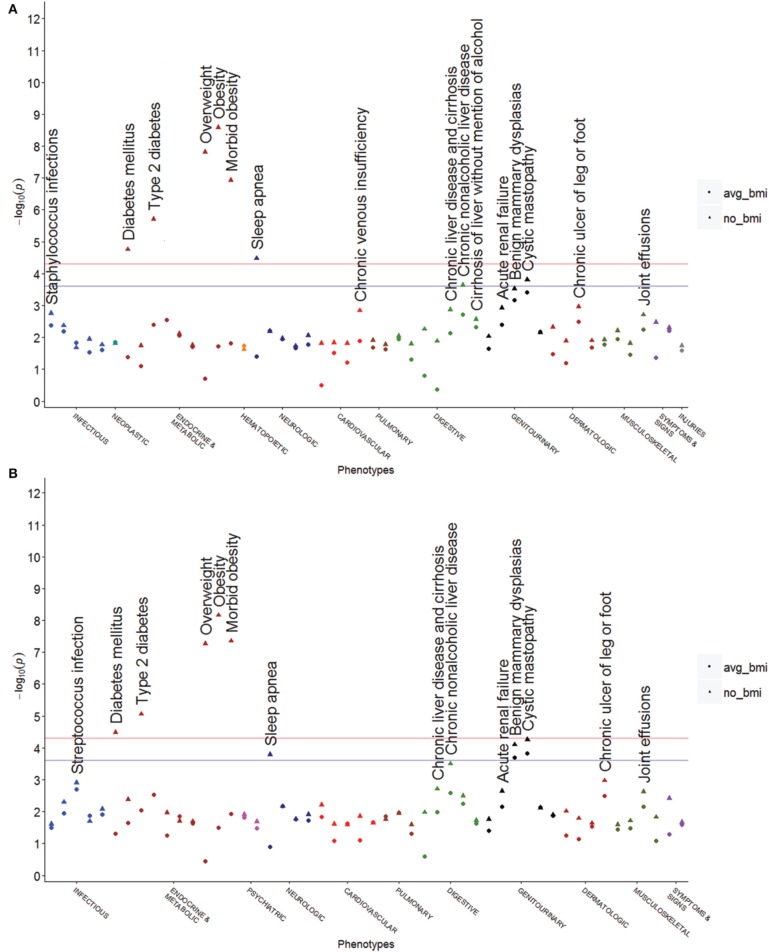
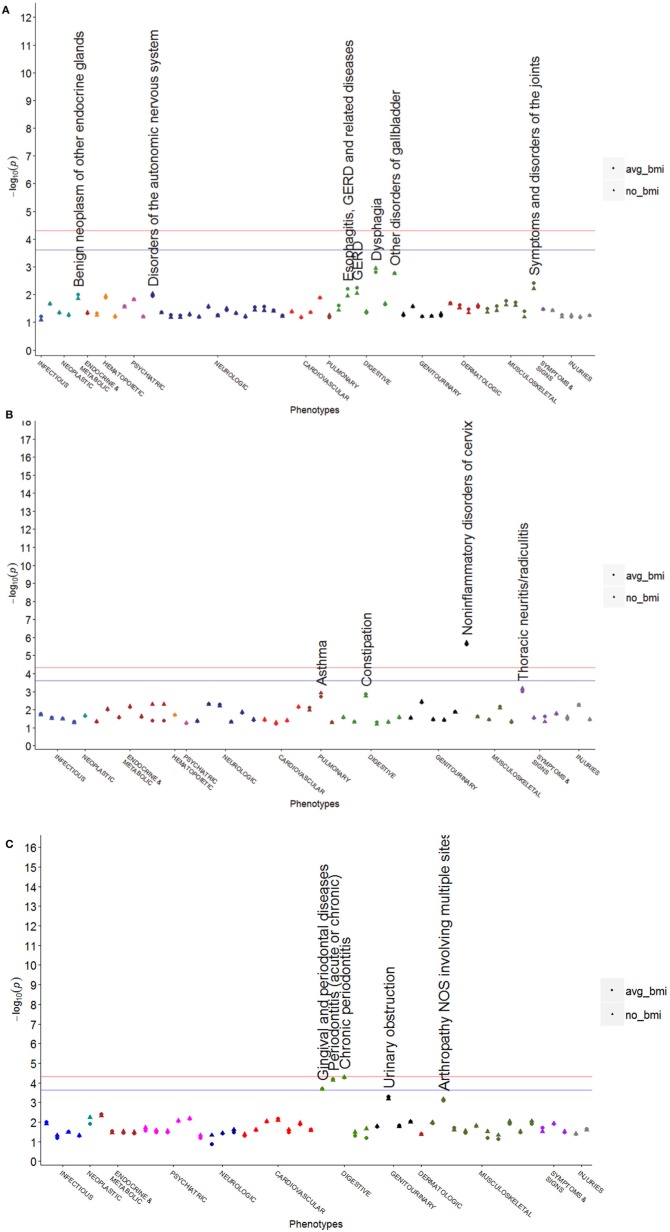
Phenome-wide association studies (PheWAS) have demonstrated utility in validating genetic associations derived from traditional genetic studies as well as identifying novel genetic associations. Here we used an electronic health record (EHR)-based PheWAS to explore pleiotropy of genetic variants in the fat mass and obesity associated gene (FTO), some of which have been previously associated with obesity and type 2 diabetes (T2D). We used a population of 10,487 individuals of European ancestry with genome-wide genotyping from the Electronic Medical Records and Genomics (eMERGE) Network and another population of 13,711 individuals of European ancestry from the BioVU DNA biobank at Vanderbilt genotyped using Illumina HumanExome BeadChip. A meta-analysis of the two study populations replicated the well-described associations between FTO variants and obesity (odds ratio [OR] = 1.25, 95% Confidence Interval = 1.11-1.24, p = 2.10 × 10(-9)) and FTO variants and T2D (OR = 1.14, 95% CI = 1.08-1.21, p = 2.34 × 10(-6)). The meta-analysis also demonstrated that FTO variant rs8050136 was significantly associated with sleep apnea (OR = 1.14, 95% CI = 1.07-1.22, p = 3.33 × 10(-5)); however, the association was attenuated after adjustment for body mass index (BMI). Novel phenotype associations with obesity-associated FTO variants included fibrocystic breast disease (rs9941349, OR = 0.81, 95% CI = 0.74-0.91, p = 5.41 × 10(-5)) and trends toward associations with non-alcoholic liver disease and gram-positive bacterial infections. FTO variants not associated with obesity demonstrated other potential disease associations including non-inflammatory disorders of the cervix and chronic periodontitis. These results suggest that genetic variants in FTO may have pleiotropic associations, some of which are not mediated by obesity.
Keywords: BMI; Exome chip; FTO; PheWAS; genetic association; pleiotropy.
Figures
References
-
- Benjamini Y., Hochberg Y. (1995). Controlling the false discovery rate: a practical and powerful approach to multiple testing. J. R. Statist. Soc. B Methodol. 57, 289–300
-
- Campbell P. G., Malone J., Yadla S., Chitale R., Nasser R., Maltenfort M. G., et al. (2011). Comparison of ICD-9-based, retrospective, and prospective assessments of perioperative complications: assessment of accuracy in reporting. J. Neurosurg. Spine 14, 16–22 10.3171/2010.9.SPINE10151 - DOI - PubMed
Grants and funding
- U01 HG006385/HG/NHGRI NIH HHS/United States
- UL1 TR000445/TR/NCATS NIH HHS/United States
- U01 HG006375/HG/NHGRI NIH HHS/United States
- UL1 TR000427/TR/NCATS NIH HHS/United States
- R01 LM010685/LM/NLM NIH HHS/United States
- U01 HG006389/HG/NHGRI NIH HHS/United States
- 16FTF30130005/AHA/American Heart Association-American Stroke Association/United States
- U01 HG006380/HG/NHGRI NIH HHS/United States
- U01 AG006781/AG/NIA NIH HHS/United States
- R01 GM105688/GM/NIGMS NIH HHS/United States
- U01 HG006379/HG/NHGRI NIH HHS/United States
- T32 GM007569/GM/NIGMS NIH HHS/United States
- T15 LM007450/LM/NLM NIH HHS/United States
- U01 HG006382/HG/NHGRI NIH HHS/United States
- U19 HL065962/HL/NHLBI NIH HHS/United States
- U01 HG006388/HG/NHGRI NIH HHS/United States
- U01 HG006378/HG/NHGRI NIH HHS/United States
LinkOut - more resources
Full Text Sources
Other Literature Sources