. 2014 Sep 2:4:6186.
doi: 10.1038/srep06186.

Resting-sate functional reorganization of the rat limbic system following neuropathic injury

Affiliations

Resting-sate functional reorganization of the rat limbic system following neuropathic injury

M N Baliki et al. Sci Rep. .

Erratum in

Abstract

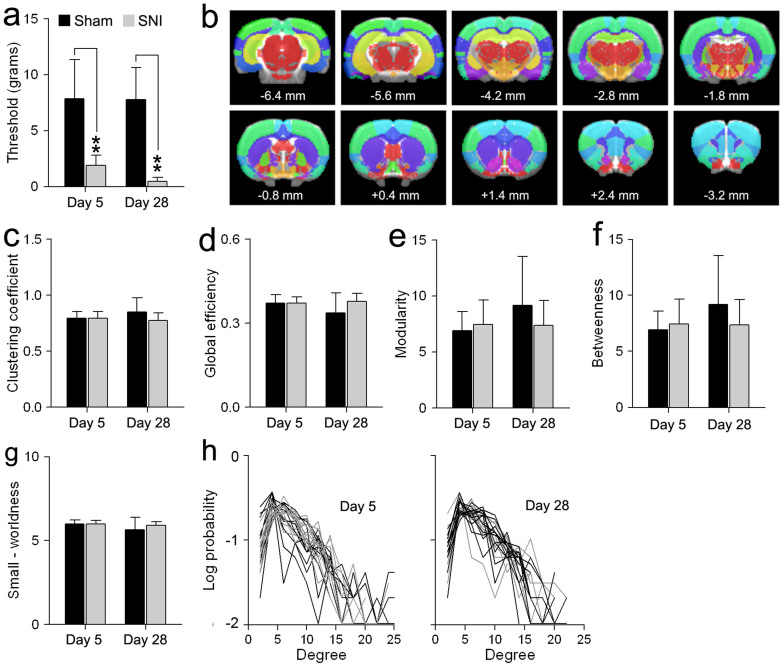
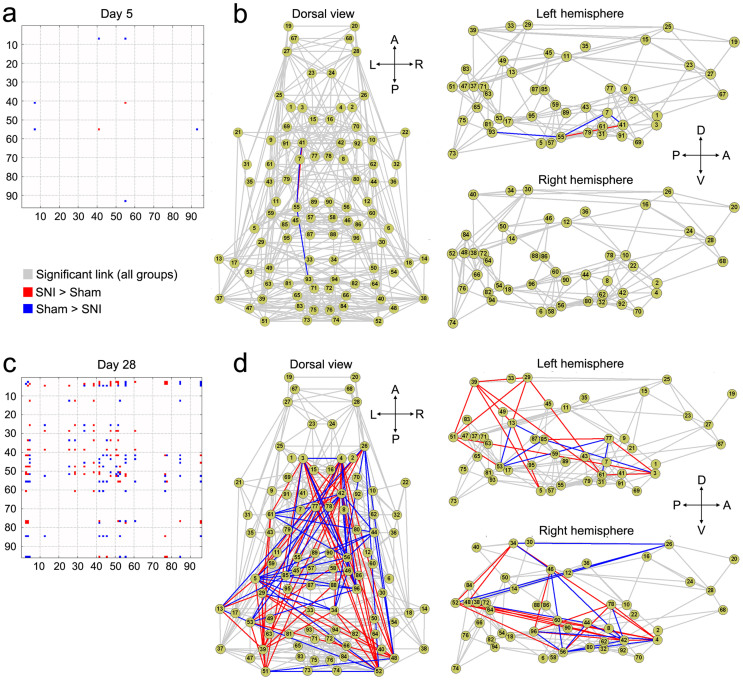
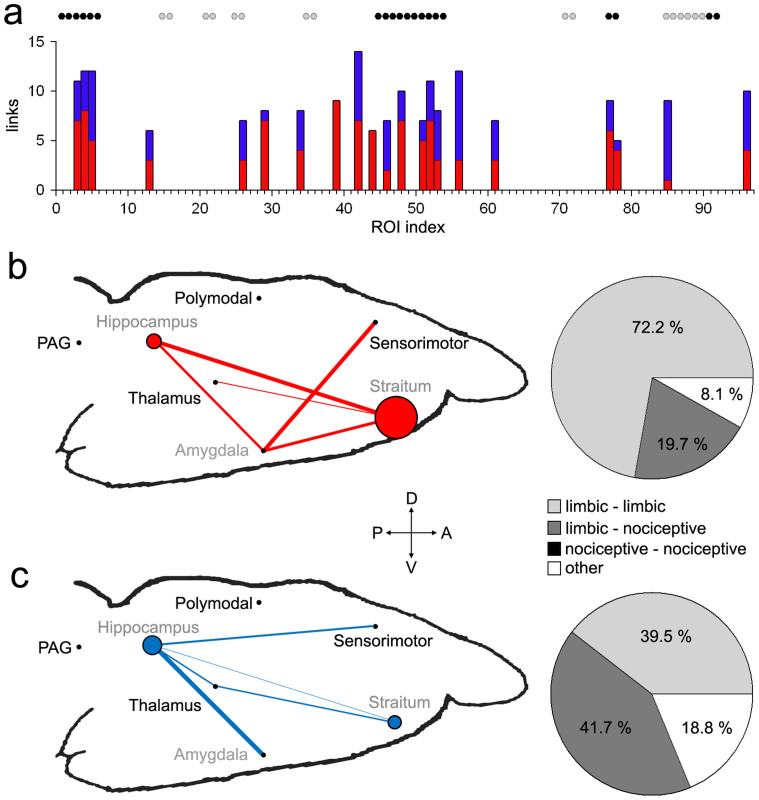
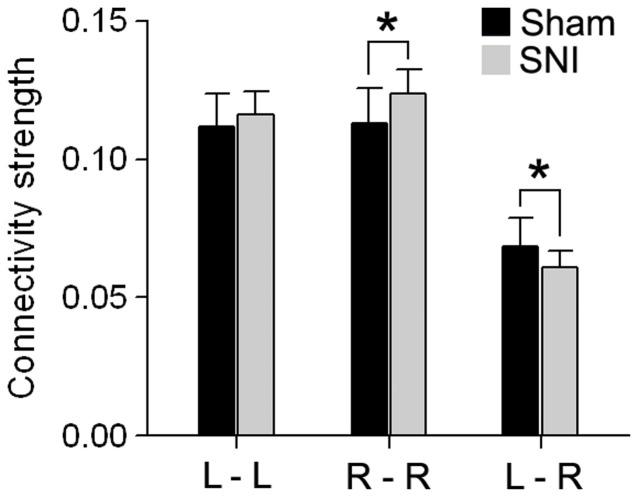
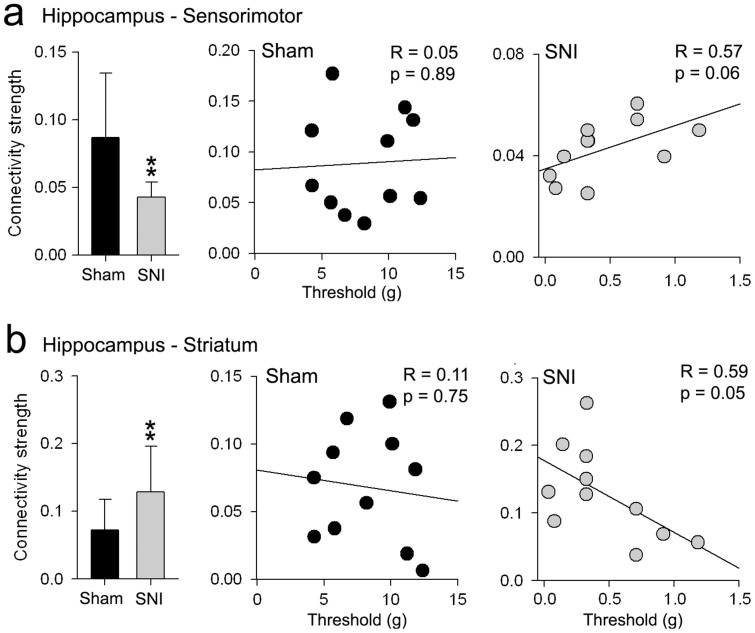
Human brain imaging studies from various clinical cohorts show that chronic pain is associated with large-scale brain functional and morphological reorganization. However, how the rat whole-brain network is topologically reorganized to support persistent pain-like behavior following neuropathic injury remains unknown. Here we compare resting state fMRI functional connectivity-based whole-brain network properties between rats receiving spared nerve injury (SNI) vs. sham injury, at 5 days (n = 11 SNI; n = 12 sham) and 28 days (n = 11 SNI; n = 12 sham) post-injury. Similar to the human, the rat brain topological properties exhibited small world features and did not differ between SNI and sham. Local neural networks in SNI animals showed minimal disruption at day 5, and more extensive reorganization at day 28 post-injury. Twenty-eight days after SNI, functional connection changes were localized mainly to within the limbic system, as well as between the limbic and nociceptive systems. No connectivity changes were observed within the nociceptive network. Furthermore, these changes were lateralized and in proportion to the tactile allodynia exhibited by SNI animals. The findings establish that SNI is primarily associated with altered information transfer of limbic regions and provides a novel translational framework for understanding brain functional reorganization in response to a persistent neuropathic injury.


Figures

Figure 1
Figure 1. Global topological features are similar between sham and SNI at 5 and 28 days after injury.
(a) Tactile sensitivity threshold of the injured paw in two groups of SNI and sham animals, day 5 (sham: n = 12, SNI: n = 11) and day 28 (sham: n = 12, SNI: n = 11) post-injury. Both SNI groups exhibited decreased mechanical threshold compared to sham animals. (b) Colored regions represent anatomically parcellated ROIs (n = 96; Table 1). Distance to bregma (in mm) is labeled at the bottom of each slice.(c–g) Topological features including, clustering coefficient, global efficiency, modularity, betweenness centrality, and small-worldness, were similar between SNI and sham animals at both time points post injury. Groups and time differences were evaluated using a two-way ANOVA. (h) Degree distribution, the probability distribution of the degree of a node in the network of sham (black) and SNI (gray) animals 5 and 28 days following injury. Error bars represent S.D. (*p<0.05, ** p<0.01, Tukey post-hoc test).
Figure 2
Figure 2. SNI is associated with late brain functional connectivity reorganization.
Matrices show the connections with significantly (p<0.05, FDR corrected) stronger (red) and weaker (blue) functional connectivity strength in SNI compared to sham at day 5 (a) and day 28 (c). Connectivity differences between SNI and sham are displayed in the dorsal (top) and lateral views (Left and Right hemispheres separately), at day 5 (b) and day 28 (d). Each node represents the anatomical regions listed in Table 1. Overall, SNI showed robust connectivity changes compared to sham at day 28, but few changes at day 5. (A = anterior; P = posterior; L = left; R = right; V = ventral; D = dorsal).
Figure 3
Figure 3. Functional connectivity changes 28 days after SNI are mainly within limbic, and between limbic and nociceptive regions.
(a) Bar graph show the number of significantly decreased (blue) and increased (red) connections for all ROIs in SNI compare to sham 28 days following injury. Black and gray circles denote limbic and nociceptive ROIs respectively. Significantly (b) increased and (c) decreased functional connectivity are shown relative to sham. Limbic (gray labels) and nociceptive (black labels) ROIs were grouped into two separate functional–anatomical modules, labeled at the approximate brain location. Normalized weighted edges and nodes indicate extent of reorganization between and within the seven regions. Pie charts show the percentages of significantly changed limbic and nociceptive connections relative to the total number of changed connections. There were no connectivity differences between nociceptive regions (i.e. nociceptive-nociceptive = 0). See Table 3 for the list of regions and the corresponding ROIs. (A = Anterior; P = posterior; V = ventral; D = dorsal).
Figure 4
Figure 4. Functional Connectivity exhibits laterality differences 28 days after SNI.
Connectivity strength changes in intra- and inter- hemispheric connectivity in comparison to sham. Connectivity strength was computed as the ratio of the total number of significant connections (at link density = 0.1) relative to the total number of all possible connections. SNI showed increased functional connectivity within the right (contralateral to injury) hemisphere and decreased inter-hemispheric functional connectivity. Error bars represent S.D. (L = left; R = right; *p<0.05, two-sided unpaired t-test).
Figure 5
Figure 5. Changes in hippocampus connectivity to sensorimotor and striatal regions reflect tactile allodynia behavior in SNI.
Connectivity strength changes in (a) hippocampus-sensorimotor and (b) hippocampus–striatum connectivity between SNI and sham at day 28. Bar graphs represent the average ratio of the total number of significant connections (at link density = 0.1) relative to the total number of all possible connections between the regions. Scatter plots show the relationship between connectivity strength and tactile sensitivity thresholds of the injured paw in sham (black circles) and SNI (gray circles) animals. Error bars represent S.D. (*p<0.05, **p<0.01, two-sided unpaired t-test).

References

    1. Apkarian A. V., Baliki M. N. & Geha P. Y. Towards a theory of chronic pain. Prog.Neurobiol. 87, 81–97 (2009). - PMC - PubMed
    1. Thompson S. J. & Bushnell M. C. Rodent functional and anatomical imaging of pain. Neurosci Lett 520, 131–139 (2012). - PubMed
    1. Bullmore E. & Sporns O. Complex brain networks: graph theoretical analysis of structural and functional systems. Nature reviews. Neuroscience 10, 186–198 (2009). - PubMed
    1. Fornito A., Zalesky A. & Bullmore E. T. Network scaling effects in graph analytic studies of human resting-state FMRI data. Frontiers in systems neuroscience 4, 22 (2010). - PMC - PubMed
    1. Liang Z., King J. & Zhang N. Intrinsic organization of the anesthetized brain. J Neurosci 32, 10183–10191 (2012). - PMC - PubMed