. 2014 Sep 2:2:131.
doi: 10.1186/s40478-014-0131-9.

Hirano body expression impairs spatial working memory in a novel mouse model

Hirano body expression impairs spatial working memory in a novel mouse model

Matthew Furgerson et al. Acta Neuropathol Commun. .

Abstract

Introduction: Hirano bodies are actin-rich intracellular inclusions found in the brains of patients with neurodegenerative conditions such as Alzheimer's disease or frontotemporal lobar degeneration-tau. While Hirano body ultrastructure and protein composition have been well studied, little is known about the physiological function of Hirano bodies in an animal model system.

Results: Utilizing a Cre/Lox system, we have generated a new mouse model which develops an age-dependent increase in the number of model Hirano bodies present in both the CA1 region of the hippocampus and frontal cortex. These mice develop normally and experience no overt neuron loss. Mice presenting model Hirano bodies have no abnormal anxiety or locomotor activity as measured by the open field test. However, mice with model Hirano bodies develop age-dependent impairments in spatial working memory performance assessed using a delayed win-shift task in an 8-arm radial maze. Synaptic transmission, short-term plasticity, and long-term plasticity was measured in the CA1 region from slices obtained from both the ventral and dorsal hippocampus in the same mice whose spatial working memory was assessed. Baseline synaptic responses, paired pulse stimulation and long-term potentiation measurements in the ventral hippocampus were indistinguishable from control mice. In contrast, in the dorsal hippocampus, synaptic transmission at higher stimulus intensities were suppressed in 3 month old mice with Hirano bodies as compared with control mice. In addition, long-term potentiation was enhanced in the dorsal hippocampus of 8 month old mice with Hirano bodies, concurrent with observed impairment of spatial working memory. Finally, an inflammatory response was observed at 8 months of age in mice with Hirano bodies as assessed by the presence of reactive astrocytes.

Conclusion: This study shows that the presence of model Hirano bodies initiates an inflammatory response, alters hippocampal synaptic responses, and impairs spatial working memory in an age-dependent manner. This suggests that Hirano bodies may promote disease progression. This new model mouse provides a tool to investigate how Hirano bodies interact with other pathologies associated with Alzheimer's disease. Hirano bodies likely play a complex and region specific role in the brain during neurodegenerative disease progression.


Figures

Figure 1
Figure 1
Model Hirano bodies detected as eosinophilic inclusions in 3 month old R26CT-CRE mice. Paraffin embedded brain sections from 3 month old R26CT and R26CT-CRE mice were dewaxed and stained with Gill's hematoxylin and counterstained with eosin. 3 month old R26CT mice show no rod-shaped eosinophilic inclusions in the pyramidal cells of the hippocampus or cerebral cortex. 3 month old R26CT-CRE mice show no inclusions in the cerebral cortex, but contain rare eosinophilic inclusions in CA1 pyramidal cells of the hippocampus indicated by the arrow. Scale bars represent 20, 50, or 500 μm.
Figure 2
Figure 2
Model Hirano bodies detected as eosinophilic inclusions in 8 month old R26CT-CRE mice. Paraffin embedded brain sections from 8 month old R26CT and R26CT-CRE mice were dewaxed and stained with Gill's hematoxylin and counterstained with eosin. 8 month old R26CT mice show no rod-shaped eosinophilic inclusions in the pyramidal cells of the hippocampus or cerebral cortex. R26CT-CRE mice have eosinophilic inclusions predominantly in the CA1 pyramidal cell layer of the hippocampus and rarely in the cerebral cortex. Arrows indicate inclusions. Scale bars represent 20 or 500 μm.
Figure 3
Figure 3
Lack of inflammation in microglia and astrocytes of 3 month old R26CT and R26CT-CRE mice. Paraffin embedded brain sections from 3 month old R26CT and R26CT-CRE mice were dewaxed and stained with DAB using antibodies against ED1 or GFAP to label activated microglia and reactive astrocytes, respectively. 3 month old R26CT and R26CT-CRE mice show no GFAP or ED1 staining in either the hippocampus or cortex. Scale bars represent 50 or 500 μm.
Figure 4
Figure 4
Inflammatory response in astrocytes, but not microglia of 8 month old R26CT-CRE mice. Paraffin embedded brain sections from 8 month old R26CT and R26CT-CRE mice were dewaxed and stained with DAB using antibodies against ED1 or GFAP to label activated microglia and reactive astrocytes, respectively. 8 month old R26CT and R26CT-CRE show no ED1 staining in the hippocampus or cerebral cortex. R26CT mice also show no GFAP staining in either hippocampus or cerebral cortex. R26CT-CRE mice have GFAP staining in the hippocampus but not cerebral cortex. Scale bars represent 50 or 500 μm.
Figure 5
Figure 5
Western blot analysis of inflammatory response in 3 and 8 month old mice. Brain homogenate from 3 and 8 month old R26CT and R26CT-CRE mice was separated by SDS-PAGE and transferred to nitrocellulose. Blots were probed for tubulin (as a loading control), GFP, ED1, and GFAP. A) At 3 months of age, there is no difference in levels of synaptophysin or ED1 between R26CT and R26CT-CRE mice. B) At 8 months of age, there is no difference in levels of ED1 or synaptophysin between R26CT and R26CT-CRE mice. C) Quantification of data in A. D) Quantification of data in B. E) Levels of GFAP increased in R26CT-CRE mice at eight months of age, indicating the presence of an inflammatory response.
Figure 6
Figure 6
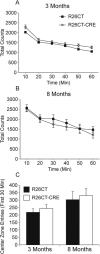
Analysis of the open field test for 3 and 8 month old R26CT and R26CT-CRE mice. Locomotor activity and center zone entrances of R26CT (3 month old, n = 11; 8 month old, n = 11) and R26CT-CRE (3 month old, n = 12; 8 month old, n = 12) mice were measured utilizing an open field test. A, B) There was no difference in locomotor activity between R26CT (black squares) and R26CT-CRE mice (open circles) at 3 or 8 months of age. C) R26CT (black bars) and R26CT-CRE (white bars) mice made similar entrances to the center zone. At both ages, R26CT and R26CT-CRE mice are not significantly different from each other. Error bars represent SEM.
Figure 7
Figure 7
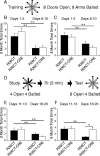
Spatial working memory performance in the 8-arm radial maze for R26CT and R26CT-CRE mice. A) Schematic diagram of the training phase procedure (8 arms open, 8 arms baited). B) At 3 months of age: R26CT (black bars, n = 11), R26CT-CRE (white bars, n = 12). C) At 8 months of age: R26CT (black bars, n = 11), R26CT-CRE (white bars, n = 12). No significant differences were found between R26CT and R26CT-CRE mice at either 3 or 8 months of age in the training phase (B, C). Performance of both mice improved with experience. D) Schematic diagram of the delayed spatial win-shift assay (RI = retention interval). E) At 3 months of age: R26CT (black bars, n = 11), R26CT-CRE (white bars, n = 12). Both R26CT and R26CT-CRE mice improved with experience and there was no significant difference between genotypes at either days 11–13 or 18–20. F) At 8 months of age: R26CT (black bars, n = 11), R26CT-CRE (white bars, n = 12). R26CT mice improve with experience while R26CT-CRE mice do not. Furthermore, there is a significant difference between R26CT and R26CT-CRE mice during the late time block (days 18–20) indicating that the spatial working memory of R26CT-CRE mice is impaired. Bars represent the mean total error ± SEM of the first 3 days and the last 3 days of either the training or test phase performance. Significance between performance blocks and between genotypes was determined using a mixed ANOVA analysis (*p < 0.05, ** p < 0.01).
Figure 8
Figure 8
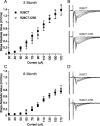
Field excitatory post-synaptic potentials (fEPSP) recorded from the ventral hippocampus in R26CT and R26CT-CRE mice. A) Stimulus response curves for R26CT (black squares n = 10(19)) and R26CT-CRE (open circles, n = 12(18)) mice at 3 months of age. Input intensities are 30, 40, 50, 60, 75, 90, 110, 130, 150, and 170 μA. B) Averaged fEPSP sweeps for each group shown in A. The vertical bar represents 2 mV and the sweeps are 50 ms in duration. C, D) Same as A and B above except at 8 months of age for R26CT (n = 10(20)) and R26CT-CRE (n = 12(19)). The values represent the mean ± SEM from n slices. There are no significant differences between genotypes at either 3 or 8 months of age. Significance between genotypes was determined using an unpaired t-test.
Figure 9
Figure 9
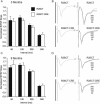
Paired-pulse field excitatory post-synaptic potentials (fEPSP) recorded from the ventral hippocampus in R26CT and R26CT-CRE mice. A) Paired-pulse ratios at 50, 100, 200, or 500 ms in R26CT (black bars, n = 10(19)) and R26CT-CRE (white bars, n = 12(18)) mice at 3 months of age. B) Averaged fEPSP sweeps for each group shown in A. The second sweeps for each interval are overlaid. Vertical bars represent 2 mV and sweeps are 90 ms in duration. C, D) Same as A and B above except at 8 months of age for R26CT (n = 10(20)) and R26CT-CRE (n = 12(21)) mice. The values represent the mean ± SEM from n slices. There is no significant difference between genotypes at either age. Significance between genotypes was determined using an unpaired t-test.
Figure 10
Figure 10
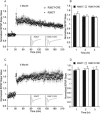
Long-term potentiation of field excitatory post-synaptic potentials (fEPSP) recorded from the ventral hippocampus in R26CT and R26CT-CRE mice. A) Summary time course of normalized fEPSP slope values in 3 month old R26CT mice in LTP (black square, (n = 10(17)) and R26CT-CRE (open circle, n = 11(16)), before and after high frequency stimulation (HFS) (3 x 100 Hz/1 s at 20 s intervals) indicated by the arrow at 30 minutes. Insets represent averaged fEPSP sweeps before and after HFS. The vertical bar is 2 mV. B) Summary quantification of LTP for R26CT and R26CT-CRE mice at 1, 2, and 3 hrs post-HFS. C, D) Same as panel A and B above except for 8 month old R26CT (black square, (n = 9(18)) and R26CT-CRE (open circle, (n = 11(18)). The values represent the mean ± SEM from n slices. There is no significant difference between genotypes at either age. Significance was determined using an unpaired t-test between genotypes.
Figure 11
Figure 11
Field excitatory post-synaptic potentials (fEPSP) recorded from the dorsal hippocampus in R26CT and R26CT-CRE mice. A) Stimulus response curves for R26CT (black squares n = 10(10)) and R26CT-CRE (open circles, n = 12(13)) mice at 3 months of age. Input intensities are 30, 40, 50, 60, 75, 90, 110, 130, 150, and 170 μA. B) Averaged fEPSP sweeps for each group shown in A. The vertical bar represents 2 mV and the sweeps are 50 ms in duration. There is a significant difference between genotypes at the two highest input intensities (*p < 0.05). C, D) Same as A and B above except at 8 months of age for R26CT (n = 10(10)) and R26CT-CRE (n = 12(12)) control mice. There are no significant differences between genotypes at 8 months of age. Significance between genotypes was determined using an unpaired t-test. The values represent the mean ± SEM from n slices.
Figure 12
Figure 12
Paired-pulse field excitatory post-synaptic potentials (fEPSP) recorded from the dorsal hippocampus in R26CT and R26CT-CRE mice. A) Paired-pulse ratios at 50, 100, 200, or 500 ms in R26CT (black bars, n = 10(10)) and R26CT-CRE (white bars, n = 12(13)) mice at 3 months of age. B) Averaged fEPSP sweeps for each group shown in A. The second sweeps for each interval are overlaid. Vertical bars represent 3 mV and sweeps are 90 ms in duration. C, D) Same as A and B above except at 8 months of age for R26CT (n = 10(10)) and R26CT-CRE (n = 12(12)) mice. The values represent the mean ± SEM from n slices. There is no significant difference between genotypes at either age. Significance between genotypes was determined using an unpaired t-test.
Figure 13
Figure 13
Long-term potentiation of field excitatory post-synaptic potentials (fEPSP) recorded from the dorsal hippocampus in R26CT and R26CT-CRE mice. A) Summary time course of normalized fEPSP slope values in 3 month old R26CT mice in LTP (black square, (n = 10(10)) and R26CT-CRE (open circle, n = 12(13)), before and after high frequency stimulation (HFS) (3 x 100 Hz/1 s at 20 s intervals) indicated by the arrow at 30 minutes. Insets represent averaged fEPSP sweeps before and after HFS. The vertical bar is 2 mV B) Summary quantification of LTP for R26CT and R26CT-CRE mice at 1, 2, and 3 hrs post-HFS. C, D) Same as panel A and B above except for 8 month old R26CT (black square, (n = 10(10)) and R26CT-CRE (open circle, (n = 12(12)). The values represent the mean ± SEM from n slices. LTP was significantly enhanced in R26CT-CRE mice at 8 months of age (*p < 0.05, **p < 0.01). Significance was determined using an unpaired t-test between genotypes.

Similar articles

Cited by

References

    1. Ross CA, Poirier MA. Protein aggregation and neurodegenerative disease. Nat Med. 2004;10(Suppl):S10–S17. doi: 10.1038/nm1066. - DOI - PubMed
    1. Ratnavalli E, Brayne C, Dawson K, Hodges JR. The prevalence of frontotemporal dementia. Neurology. 2002;58:1615–1621. doi: 10.1212/WNL.58.11.1615. - DOI - PubMed
    1. As A, Thies W, Bleiler L. Alzheimer's disease facts and figures. Alzheimers Dement. 2011;7:208–244. doi: 10.1016/j.jalz.2011.02.004. - DOI - PubMed
    1. Terry RD. The fine structure of neurofibrillary tangles in Alzheimer's disease. J Neuropathol Exp Neurol. 1963;22:629–642. doi: 10.1097/00005072-196310000-00005. - DOI - PubMed
    1. Lynch T, Sano M, Marder KS, Bell KL, Foster NL, Defendini RF, Sima AA, Keohane C, Nygaard TG, Fahn S, Mayeux R, Rowland LP, Wilhelmensen KC. Clinical characteristics of a family with chromosome 17-linked disinhibition-demenstia-parkinsonism-amyotrophy complex. Neurol. 1994;44:1878–1884. doi: 10.1212/WNL.44.10.1878. - DOI - PubMed

Publication types

MeSH terms

Substances

LinkOut - more resources