

Covert hepatic encephalopathy is independently associated with poor survival and increased risk of hospitalization
- PMID: 25178701
- PMCID: PMC4321782
- DOI: 10.1038/ajg.2014.264
Covert hepatic encephalopathy is independently associated with poor survival and increased risk of hospitalization
Abstract
Objectives: Despite the high prevalence of covert hepatic encephalopathy (CHE) in cirrhotics without previous overt HE (OHE), its independent impact on predicting clinically relevant outcomes is unclear. The aim of this study was to define the impact of CHE on time to OHE, hospitalization, and death/transplant in prospectively followed up patients without previous OHE.
Methods: Outpatient cirrhotics without OHE were enrolled and were administered a standard paper-pencil cognitive battery for CHE diagnosis. They were systematically followed up and time to first OHE development, hospitalization (liver-related/unrelated), and transplant/death were compared between CHE and no-CHE patients at baseline using Cox regression.
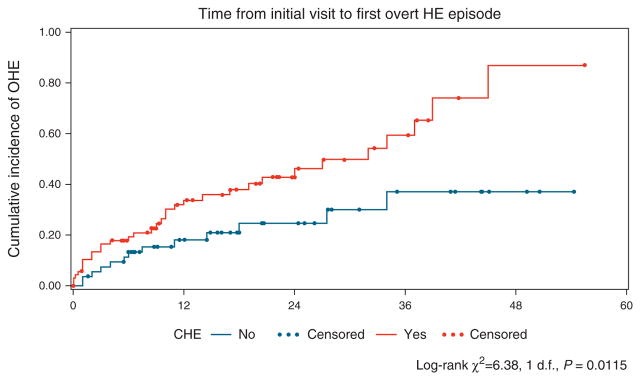
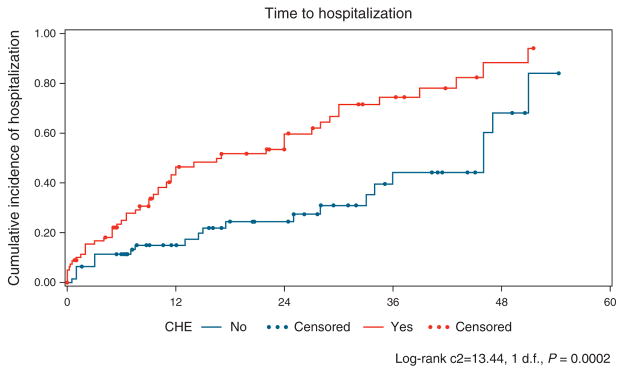
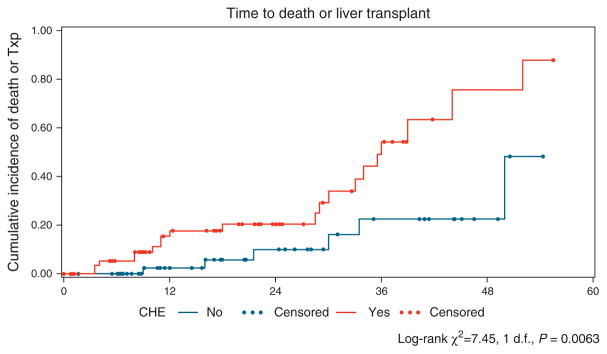
Results: A total of 170 cirrhotic patients (55 years, 58% men, 14 years of education, Model for End-Stage Liver Disease (MELD 9), 53% hepatitis C virus (HCV), 20% nonalcoholic etiology) were included, of whom 56% had CHE. The entire population was followed up for 13.0 ± 14.6 months, during which time 30% developed their first OHE episode, 42% were hospitalized, and 19% had a composite death/transplant outcome. Age, gender, etiology, the MELD score, and CHE status were included in Cox regression models for time to first OHE episode, hospitalization, death, and composite death/transplant outcomes. On Cox regression, despite controlling for MELD, those with CHE had a higher risk of developing OHE (hazard ratio: 2.1, 95% confidence interval 1.01-4.5), hospitalization (hazard ratio: 2.5, 95% confidence interval 1.4-4.5), and death/transplant (hazard ratio: 3.4, 95% confidence interval 1.2-9.7) in the follow-up period.
Conclusions: Covert HE is associated with worsened survival and increased risk of hospitalization and OHE development, despite controlling for the MELD score. Strategies to detect and treat CHE may improve these risks.
Conflict of interest statement
Figures
References
-
- Bajaj JS, Wade JB, Sanyal AJ. Spectrum of neurocognitive impairment in cirrhosis: implications for the assessment of hepatic encephalopathy. Hepatology. 2009;50:2014–21. - PubMed
-
- Das A, Dhiman RK, Saraswat VA, et al. Prevalence and natural history of subclinical hepatic encephalopathy in cirrhosis. J Gastroenterol Hepatol. 2001;16:531–5. - PubMed
-
- Ortiz M, Jacas C, Cordoba J. Minimal hepatic encephalopathy: diagnosis, clinical significance and recommendations. J Hepatol. 2005;42(Suppl 1):S45–S53. - PubMed
-
- Kappus MR, Bajaj JS. Covert hepatic encephalopathy: not as minimal as you might think. Clin Gastroenterol Hepatol. 2012;10:1208–19. - PubMed
Publication types
MeSH terms
Grants and funding
LinkOut - more resources
Full Text Sources
Other Literature Sources
Medical
