. 2014 Nov;1841(11):1596-607.
doi: 10.1016/j.bbalip.2014.08.015. Epub 2014 Aug 29.

Role of white adipose lipolysis in the development of NASH induced by methionine- and choline-deficient diet

Affiliations

Role of white adipose lipolysis in the development of NASH induced by methionine- and choline-deficient diet

Naoki Tanaka et al. Biochim Biophys Acta. 2014 Nov.

Abstract

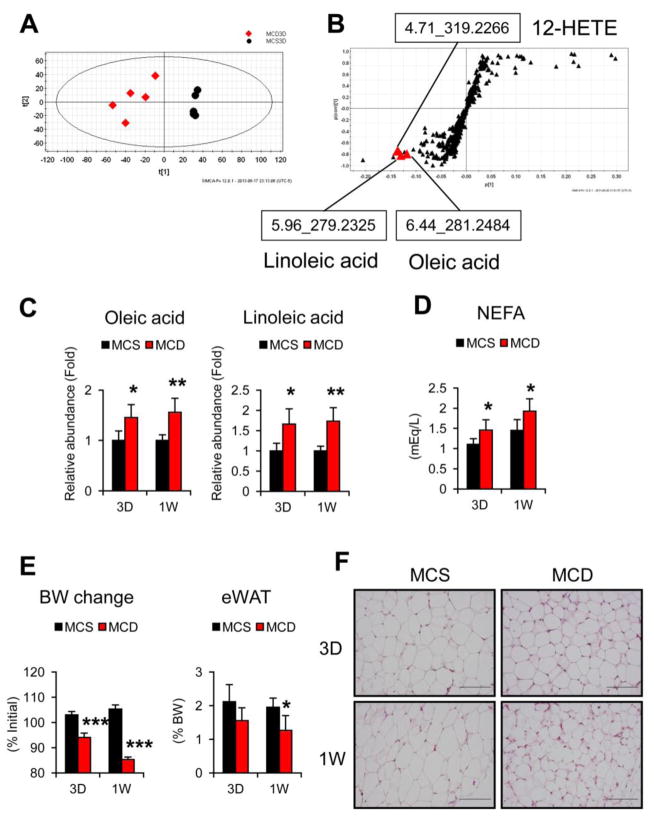
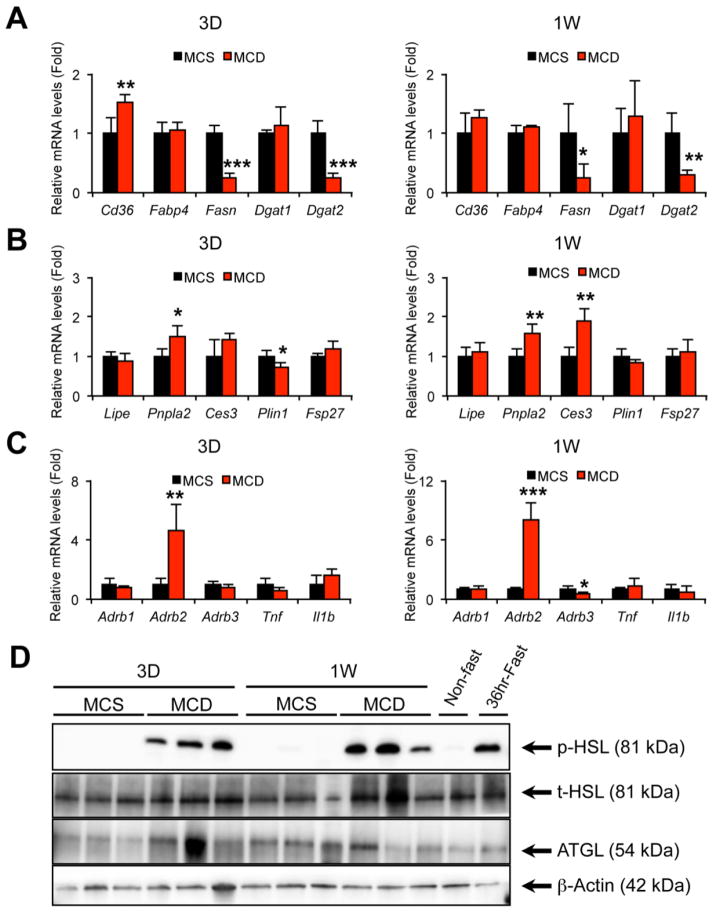
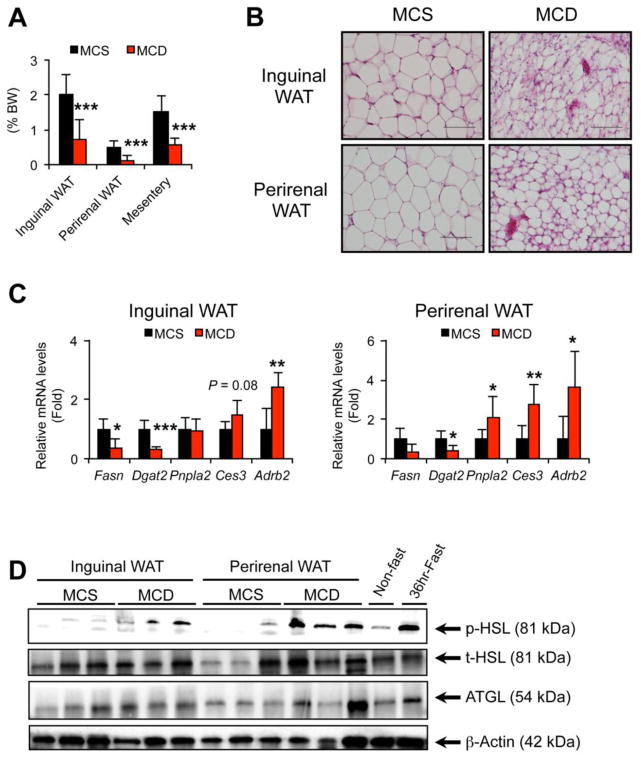
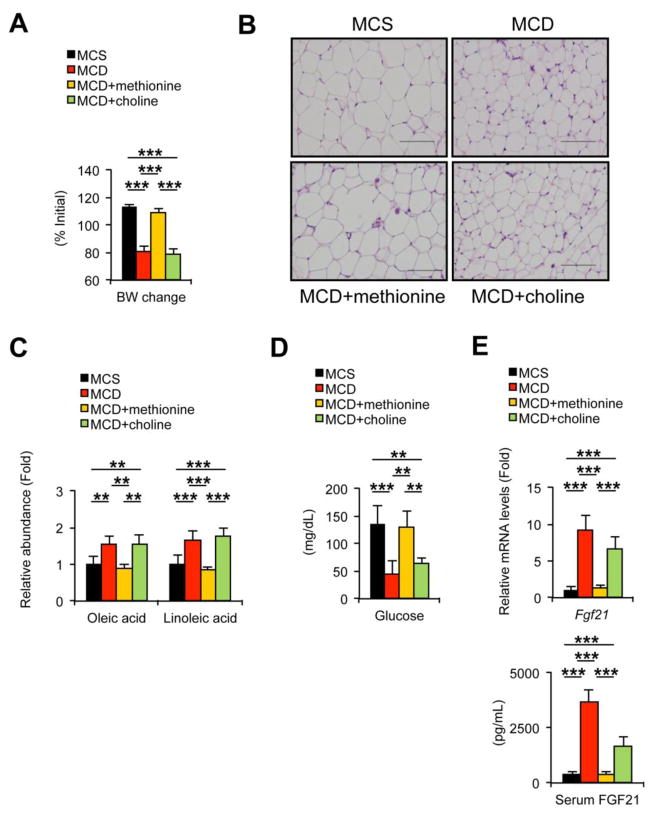
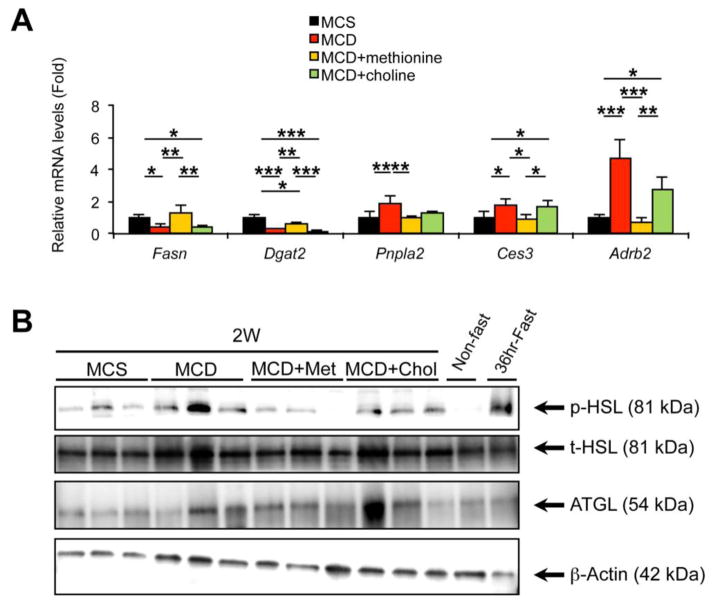
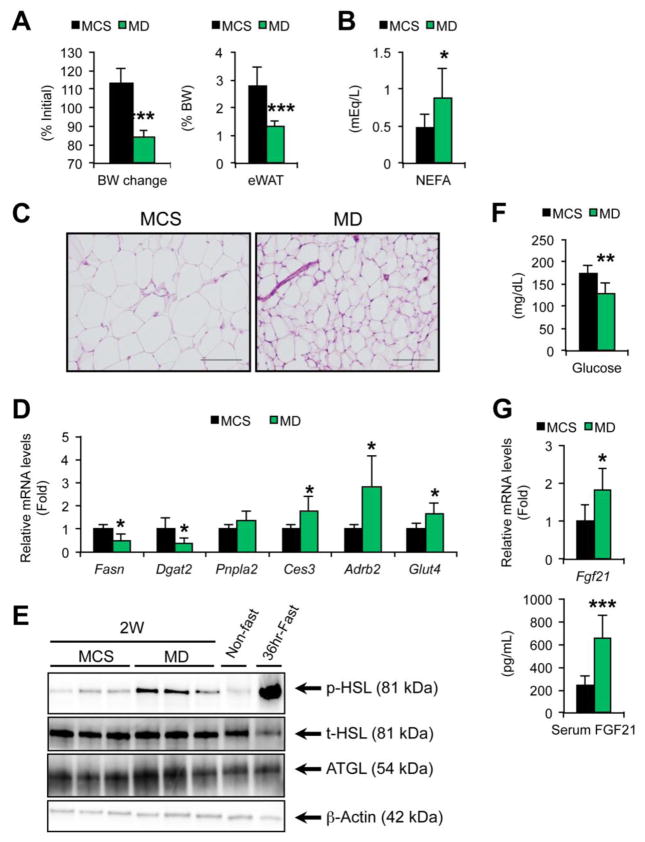
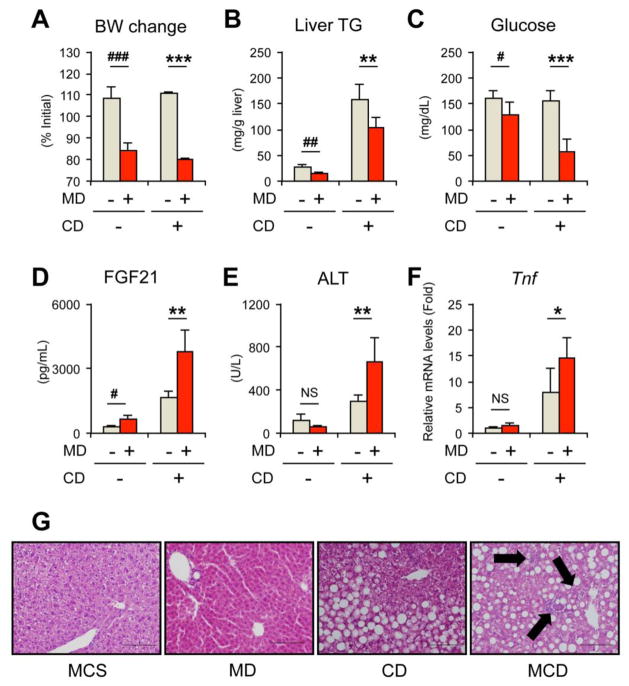
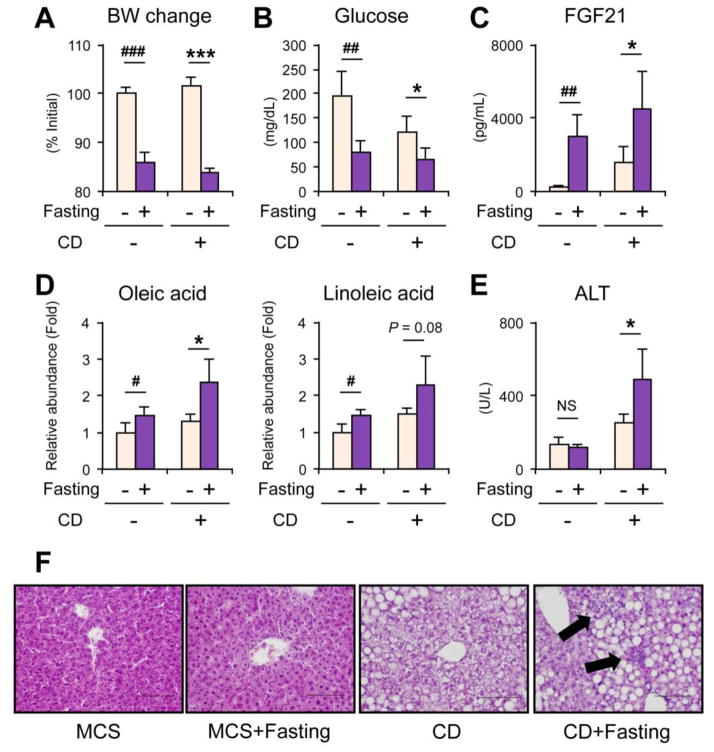
Methionine- and choline-deficient diet (MCD) is a model for nonalcoholic steatohepatitis (NASH) in rodents. However, the mechanism of NASH development by dietary methionine/choline deficiency remains undetermined. To elucidate the early metabolic changes associated with MCD-NASH, serum metabolomic analysis was performed using mice treated with MCD and control diet for 3 days and 1 week, revealing significant increases in oleic and linoleic acids after MCD treatment. These increases were correlated with reduced body weight and white adipose tissue (WAT) mass, increased phosphorylation of hormone-sensitive lipase, and up-regulation of genes encoding carboxylesterase 3 and β2-adrenergic receptor in WAT, indicating accelerated lipolysis in adipocytes. The changes in serum fatty acids and WAT by MCD treatment were reversed by methionine supplementation, and similar alterations were detected in mice fed a methionine-deficient diet (MD), thus demonstrating that dietary methionine deficiency enhances lipolysis in WAT. MD treatment decreased glucose and increased fibroblast growth factor 21 in serum, thus exhibiting a similar metabolic phenotype as the fasting response. Comparison between MCD and choline-deficient diet (CD) treatments suggested that the addition of MD-induced metabolic alterations, such as WAT lipolysis, to CD-induced hepatic steatosis promotes liver injury. Collectively, these results demonstrate an important role for dietary methionine deficiency and WAT lipolysis in the development of MCD-NASH.

Keywords: Choline deficiency; Fasting response; Linoleic acid; Lipolysis; Metabolomics; Oleic acid.


Conflict of interest statement

Potential conflict of interest: The authors have declared that no conflict of interest exists.

Figures

Fig. 1
Fig. 1. Serum metabolomic analysis reveals significant increases in oleic and linoleic acids in early stage of MCD-NASH
Male C57BL/6NCr wild-type mice at 8–12 weeks of age were fed a methionine- and choline-deficient diet (MCD) or control methionine- and choline-supplemented MCD diet (MCS) for three days or one week (n = 5/group). (A) PCA of serum metabolites between mice treated with 3-day MCD (red diamond) and MCS (black circle). (B) S-plot of OPLA analysis using the same data as (A). Retention time and molecular mass were indicated. (C) Serum levels of oleic and linoleic acids. Values were normalized to those of MCS-treated mice in each time point and were expressed as relative abundance. (D) Serum levels of NEFA. (E) Body weight (BW) change and epididymal WAT (eWAT) weight. BW was measured just prior to killing and BW changes were expressed as the percentage relative to BW just before commencing the MCD or MCS treatment. (F) Histology of epididymal WAT. Hematoxylin and eosin staining, Bar = 100 μm. Statistical analysis was performed using the Student’s t-test. *P<0.05, **P<0.01, ***P<0.001 vs. MCS-treated mice in the same time point.
Fig. 2
Fig. 2. Quantitative PCR analysis of the genes associated with lipid metabolism and immunoblot analysis of lipolytic enzymes in the epididymal WAT of mice treated with MCD for 3 days or 1 week
Male C57BL/6NCr wild-type mice at 8–12 weeks of age were treated with MCS or MCD for three days or one week (n = 5/group) and epididymal WAT was subjected to qPCR and immunoblot analyses. (A–C) qPCR analysis. The mRNA levels were normalized to those of 18S ribosomal mRNA and subsequently normalized to those of MCS-treated mice. Statistical analysis was performed using the Student’s t-test. *P<0.05, **P<0.01, ***P<0.001 vs. MCS-treated mice in the same time point. Full terms of the gene names were listed in Supplementary Table 2. (D) Immunoblot analysis of phosphorylated and total hormone-sensitive lipase (p-HSL and t-HSL, respectively) and adipose triglyceride lipase (ATGL). Cytosolic extracts of WAT (30 μg of protein) were loaded in each well. The band of β-actin was used as a loading control. Epididymal WAT isolated from a 36 hour-fasted mouse was used for detecting the true position of HSL and ATGL bands.
Fig. 3
Fig. 3. The effect of MCD treatment on other WAT depots
Male C57BL/6NCr wild-type mice at 8–12 weeks of age were treated with MCS or MCD for one week (n = 7–8/group) and inguinal WAT, perirenal WAT, and mesentery were harvested. (A) The weights of inguinal and perirenal WAT and mesentery. (B) Histology of inguinal and perirenal WAT. Hematoxylin and eosin staining, Bar = 100 μm. (C) qPCR analysis. The mRNA levels were normalized to those of 18S ribosomal mRNA and subsequently normalized to those of MCS-treated mice. Statistical analysis was performed using the Student’s t-test. *P<0.05, **P<0.01, ***P<0.001 vs. MCS-treated mice. (D) Immunoblot analysis of p-HSL, t-HSL, and ATGL. Cytosolic extracts of WAT (30 μg of protein) were loaded in each well. The band of β-actin was used as a loading control.
Fig. 4
Fig. 4. Increases in serum oleic and linoleic acids and changes in WAT by MCD treatment are reversed by methionine supplementation
Male C57BL/6NCr wild-type mice at 8–12 weeks of age were treated with MCS with drinking deionized water, MCD with drinking deionized water, MCD with drinking deionized water containing L-methionine (4 mg/mL, MCD+methionine), or MCD with drinking deionized water containing choline bitartrate (30 mg/mL, MCD+choline) for two weeks (n = 5/group) and serum, liver, and epididymal WAT were collected. (A) Body weight (BW) change. Values were expressed as the percentage relative to BW just before commencing the MCD or MCS treatment. (B) Histology of epididymal WAT. Hematoxylin and eosin staining, Bar = 100 μm. (C) Serum levels of oleic and linoleic acids. Values were normalized to those of MCS-treated mice and were expressed as relative abundance. (D) Serum glucose concentrations. (E) Hepatic Fgf21 mRNA levels and serum FGF21 concentrations. The mRNA levels were normalized to those of 18S ribosomal mRNA and subsequently normalized to those of MCS-treated mice. Statistical analysis was performed using the one-way ANOVA test with Bonferroni’s correction. *, P<0.05; **, P<0.01; ***, P<0.001.
Fig. 5
Fig. 5. The effect of supplementation of methionine or choline on gene/protein expression in the WAT of MCD-treated mice
Epididymal WAT isolated from mice shown in Fig. 4 was subjected to qPCR and immunoblot analyses. (A) qPCR analysis of the indicated genes. The mRNA levels were normalized to those of 18S ribosomal mRNA and subsequently normalized to those of MCS-treated mice. Statistical analysis was performed using the one-way ANOVA test with Bonferroni’s correction. *, P<0.05; **, P<0.01; ***, P<0.001. (B) Immunoblot analysis of p-HSL, t-HSL, and ATGL. Cytosolic extracts of WAT (30 μg of protein) were loaded in each well. The band of β-actin was used as a loading control. Met, methionine; Chol, choline.
Fig. 6
Fig. 6. MD treatment causes similar metabolic alterations to MCD treatment
Male C57BL/6NCr wild-type mice at 8–12 weeks of age were treated with methionine-deficient diet (MD) or control MCS diet for two weeks (n = 7/group) and serum, liver, and epididymal WAT (eWAT) were harvested. (A) Body weight (BW) change and eWAT weight. BW change values were expressed as the percentage relative to BW just before commencing the MD or MCS treatment. (B) Serum NEFA levels. (C) Histology of eWAT. Hematoxylin and eosin staining, Bar = 100 μm. (D) The mRNA levels of indicated genes in eWAT. The mRNA levels were normalized to those of 18S ribosomal mRNA and subsequently normalized to those of MCS-treated mice. (E) Immunoblot analysis of p-HSL, t-HSL, and ATGL. Cytosolic extracts of WAT (30 μg of protein) were loaded in each well. The band of β-actin was used as a loading control. (F) Serum glucose concentrations. (G) Hepatic Fgf21 mRNA levels and serum FGF21 concentrations. The mRNA levels were normalized to those of 18S ribosomal mRNA and subsequently normalized to those of MCS-treated mice. Statistical analysis was performed using the Student’s t-test. *P<0.05, **P<0.01, ***P<0.001 vs. MCS-treated mice.
Fig. 7
Fig. 7. The effect of dietary methionine deficiency on liver pathology
Male C57BL/6NCr wild-type mice at 8–12 weeks of age were treated with MCD (designated as MD+ CD+), choline-deficient diet (CD, designated as MD− CD+), methonine-deficient diet (MD, designated as MD+ CD−), or control MCS diet (designated as MD− CD−) for two weeks (n = 4–7/group) and serum and liver were collected. (A) Body weight (BW) change. Values were expressed as the percentage relative to BW just before commencing the MCD, CD, MD, or MCS treatment. (B) Liver TG contents. (C–E) Serum levels of glucose (C), FGF21 (D), and ALT (E). (F) Hepatic Tnf mRNA levels. The mRNA levels were normalized to those of 18S ribosomal mRNA and subsequently normalized to those of MCS-treated mice. (G) Representative liver histology. Hematoxylin and eosin staining, Bar = 100 μm. Arrows in MCD photograph indicate inflammatory foci. Statistical analysis was performed using the Student’s t-test. #P<0.05, ##P<0.01, ###P<0.001 vs. MCS-treated mice (MD− CD−); *P<0.05, **P<0.01, ***P<0.001 vs. CD-treated mice (MD− CD+); NS, not significant.
Fig. 8
Fig. 8. Enhanced WAT lipolysis by 36-hour fasting exacerbates liver injury in the presence of dietary choline deficiency
Male C57BL/6NCr wild-type mice at 8–12 weeks of age were treated with choline-deficient diet (CD, designated as CD+) or control diet (MCS, designated as CD−) for two weeks and randomly divided into fasting or non-fasting group (n = 5/group). Mice in one group were fasted for 36 hours before killing (fasting+) and mice in the other group were continuously fed CD or MCS (fasting−). Serum and liver were harvested. (A) Body weight (BW) change. Values were expressed as the percentage relative to BW at 36 hours before killing. (B–E) Serum levels of glucose (B), FGF21 (C), oleic and linoleic acids (D), and ALT (E). Serum oleic and linoleic acid levels were normalized to those of non-fasted MCS-treated mice and were expressed as relative abundance. (F) Representative liver histology. Hematoxylin and eosin staining, Bar = 100 μm. Arrows indicate focal inflammation. Statistical analysis was performed using the Student’s t-test. #P<0.05, ##P<0.01, ###P<0.001 vs. non-fasted MCS-treated mice; *P<0.05, **P<0.01, ***P<0.001 vs. non-fasted CD-treated mice; NS, not significant.

References

    1. Vernon G, Baranova A, Younossi ZM. Systematic review: the epidemiology and natural history of non-alcoholic fatty liver disease and non-alcoholic steatohepatitis in adults. Aliment Pharmacol Ther. 2011;34:274–285. - PubMed
    1. Cohen JC, Horton JD, Hobbs HH. Human fatty liver disease: old questions and new insight. Science. 2011;332:1519–1523. - PMC - PubMed
    1. Söderberg C, Stål P, Askling J, Glaumann H, Lindberg G, Marmur J, Hultcrantz R. Decreased survival of subjects with elevated liver function tests during a 28-year follow-up. Hepatology. 2010;51:595–602. - PubMed
    1. Tilg H, Moschen AR. Evolution of inflammation in nonalcoholic fatty liver disease: the multiple parallel hits hypothesis. Hepatology. 2010;52:1836–1846. - PubMed
    1. Neuschwander-Tetri BA. Hepatic lipotoxicity and the pathogenesis of nonalcoholic steatohepatitis: the central role of nontriglyceride fatty acid metabolites. Hepatology. 2010;52:774–788. - PubMed

LinkOut - more resources