

CD160 isoforms and regulation of CD4 and CD8 T-cell responses
- PMID: 25179432
- PMCID: PMC4163173
- DOI: 10.1186/s12967-014-0217-y
CD160 isoforms and regulation of CD4 and CD8 T-cell responses
Abstract
Background: Coexpression of CD160 and PD-1 on HIV-specific CD8+ T-cells defines a highly exhausted T-cell subset. CD160 binds to Herpes Virus Entry Mediator (HVEM) and blocking this interaction with HVEM antibodies reverses T-cell exhaustion. As HVEM binds both inhibitory and activatory receptors, our aim in the current study was to assess the impact of CD160-specific antibodies on the enhancement of T-cell activation.
Methods: Expression of the two CD160 isoforms; glycosylphosphatidylinositol-anchored (CD160-GPI) and the transmembrane isoforms (CD160-TM) was assessed in CD4 and CD8 primary T-cells by quantitative RT-PCR and Flow-cytometry. Binding of these isoforms to HVEM ligand and the differential capacities of CD160 and HVEM specific antibodies to inhibit this binding were further evaluated using a Time-Resolved Fluorescence assay (TRF). The impact of both CD160 and HVEM specific antibodies on enhancing T-cell functionality upon antigenic stimulation was performed in comparative ex vivo studies using primary cells from HIV-infected subjects stimulated with HIV antigens in the presence or absence of blocking antibodies to the key inhibitory receptor PD-1.
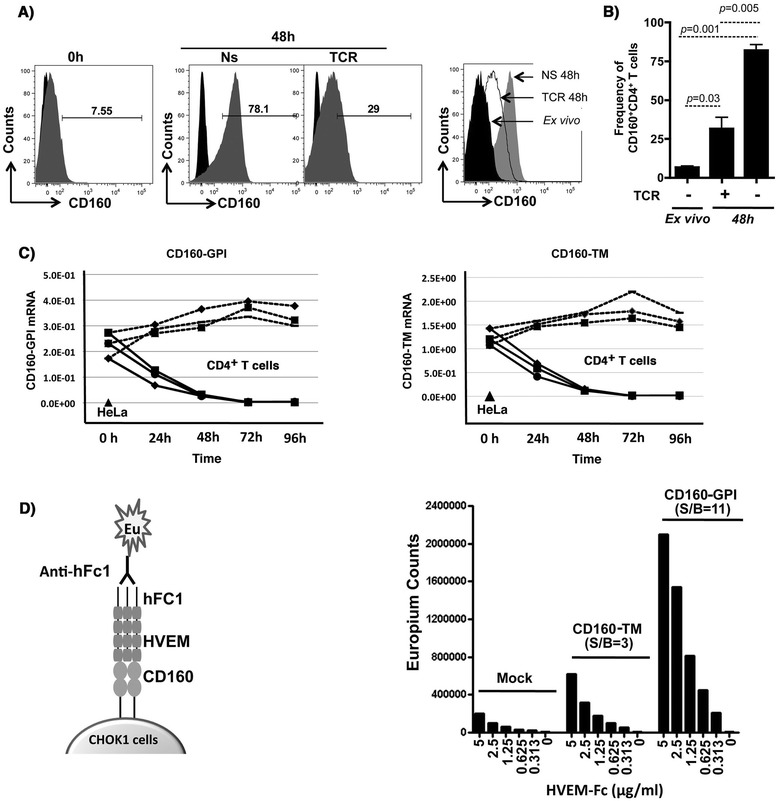
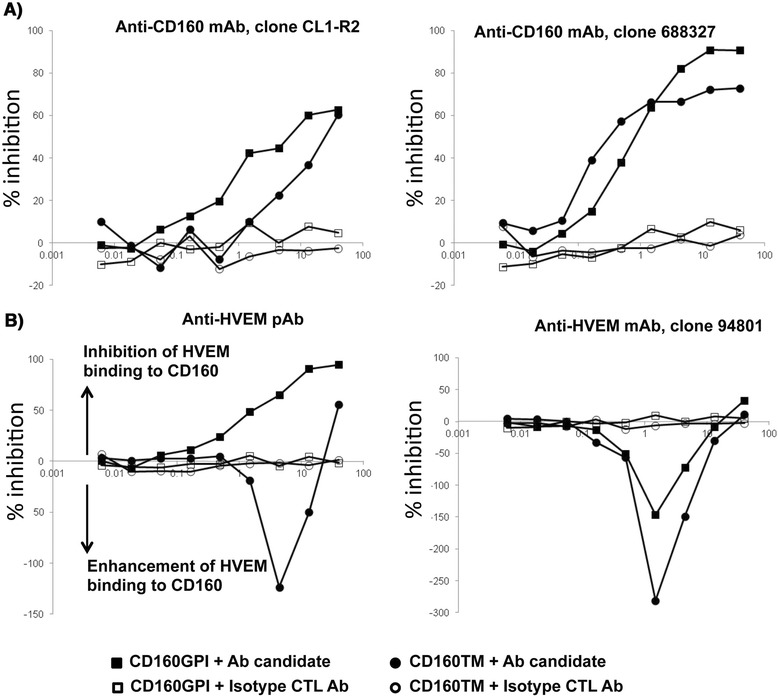
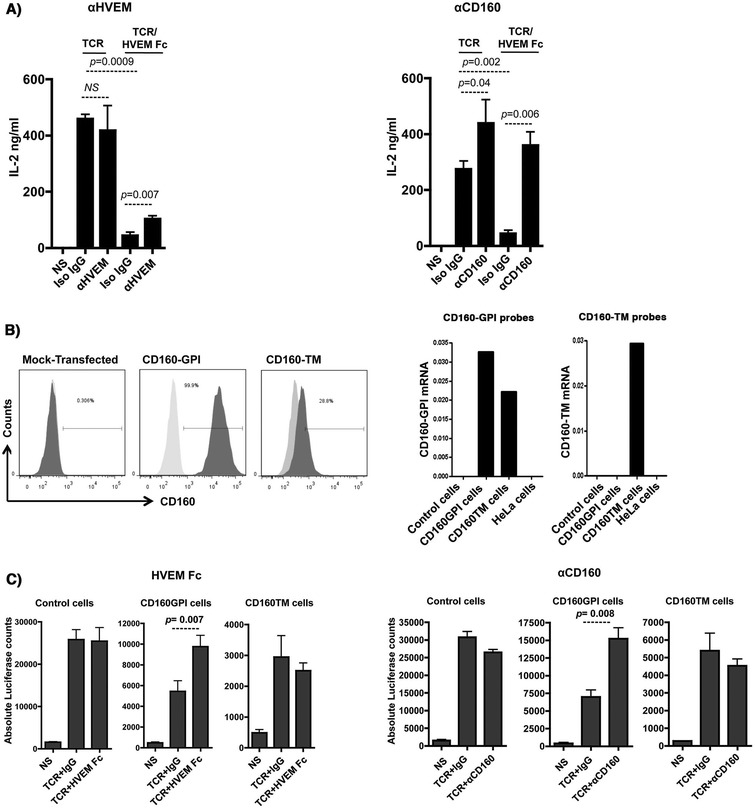
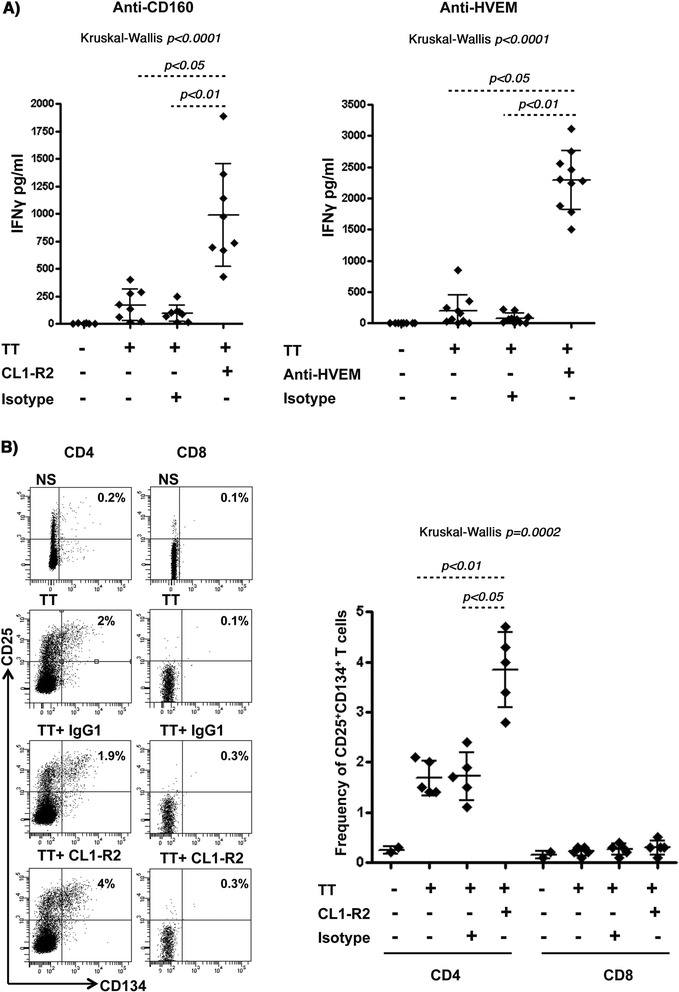
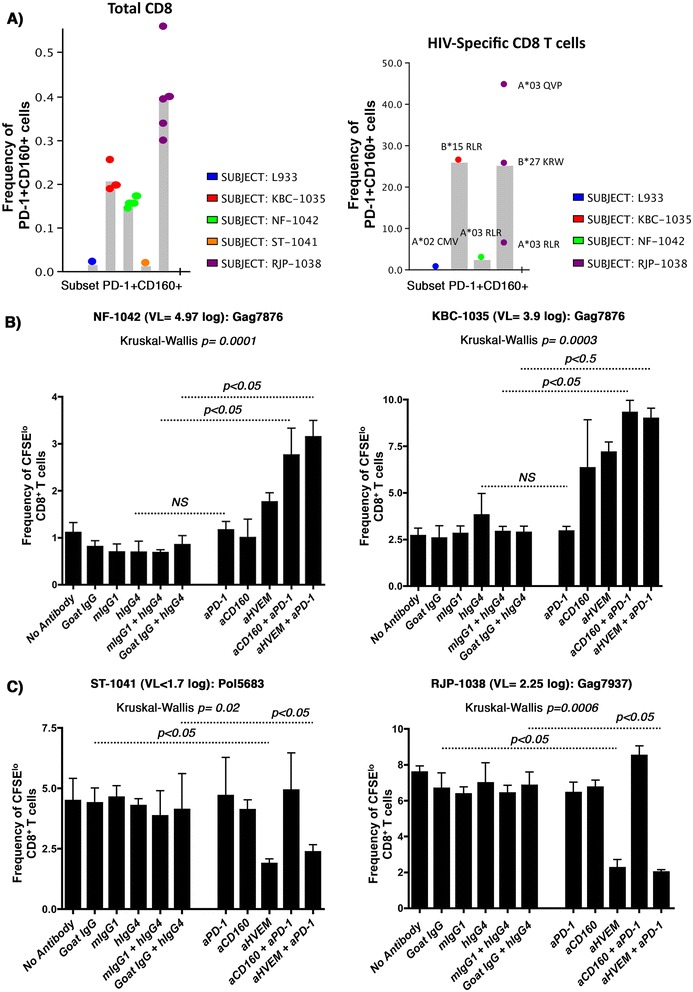
Results: We first show that both CD160 isoforms, CD160-GPI and CD160-TM, were expressed in human primary CD4+ and CD8+ T-cells. The two isoforms were also recognized by the HVEM ligand, although this binding was less pronounced with the CD160-TM isoform. Mechanistic studies revealed that although HVEM specific antibodies blocked its binding to CD160-GPI, surprisingly, these antibodies enhanced HVEM binding to CD160-TM, suggesting that potential antibody-mediated HVEM multimerization and/or induced conformational changes may be required for optimal CD160-TM binding. Triggering of CD160-GPI over-expressed on Jurkat cells with either bead-bound HVEM-Fc or anti-CD160 monoclonal antibodies enhanced cell activation, consistent with a positive co-stimulatory role for CD160-GPI. However, CD160-TM did not respond to this stimulation, likely due to the lack of optimal HVEM binding. Finally, ex vivo assays using PBMCs from HIV viremic subjects showed that the use of CD160-GPI-specific antibodies combined with blockade of PD-1 synergistically enhanced the proliferation of HIV-1 specific CD8+ T-cells upon antigenic stimulation.
Conclusions: Antibodies targeting CD160-GPI complement the blockade of PD-1 to enhance HIV-specific T-cell responses and warrant further investigation in the development of novel immunotherapeutic approaches.
Figures
Similar articles
-
CD160 and PD-1 co-expression on HIV-specific CD8 T cells defines a subset with advanced dysfunction.PLoS Pathog. 2012;8(8):e1002840. doi: 10.1371/journal.ppat.1002840. Epub 2012 Aug 16. PLoS Pathog. 2012. PMID: 22916009 Free PMC article. Clinical Trial.
-
CD160 inhibits activation of human CD4+ T cells through interaction with herpesvirus entry mediator.Nat Immunol. 2008 Feb;9(2):176-85. doi: 10.1038/ni1554. Epub 2008 Jan 13. Nat Immunol. 2008. PMID: 18193050
-
The impact of CD160 deficiency on alloreactive CD8 T cell responses and allograft rejection.Transl Res. 2022 Jan;239:103-123. doi: 10.1016/j.trsl.2021.08.006. Epub 2021 Aug 27. Transl Res. 2022. PMID: 34461306
-
The CD160, BTLA, LIGHT/HVEM pathway: a bidirectional switch regulating T-cell activation.Immunol Rev. 2009 May;229(1):244-58. doi: 10.1111/j.1600-065X.2009.00783.x. Immunol Rev. 2009. PMID: 19426226 Review.
-
The signaling networks of the herpesvirus entry mediator (TNFRSF14) in immune regulation.Immunol Rev. 2011 Nov;244(1):169-87. doi: 10.1111/j.1600-065X.2011.01064.x. Immunol Rev. 2011. PMID: 22017438 Free PMC article. Review.
Cited by
-
Soluble Fc-Disabled Herpes Virus Entry Mediator Augments Activation and Cytotoxicity of NK Cells by Promoting Cross-Talk between NK Cells and Monocytes.J Immunol. 2019 Apr 1;202(7):2057-2068. doi: 10.4049/jimmunol.1801449. Epub 2019 Feb 15. J Immunol. 2019. PMID: 30770415 Free PMC article.
-
Proinflammatory isoforms of IL-32 as novel and robust biomarkers for control failure in HIV-infected slow progressors.Sci Rep. 2016 Mar 15;6:22902. doi: 10.1038/srep22902. Sci Rep. 2016. PMID: 26978598 Free PMC article.
-
The TNF Receptor Superfamily in Co-stimulating and Co-inhibitory Responses.Immunity. 2016 May 17;44(5):1005-19. doi: 10.1016/j.immuni.2016.04.019. Immunity. 2016. PMID: 27192566 Free PMC article. Review.
-
Plasma extracellular vesicle transcriptomics identifies CD160 for predicting immunochemotherapy efficacy in lung cancer.Cancer Sci. 2023 Jul;114(7):2774-2786. doi: 10.1111/cas.15804. Epub 2023 Apr 20. Cancer Sci. 2023. PMID: 37014183 Free PMC article.
-
Functional Analysis of Immune Signature Genes in Th1* Memory Cells Links ISOC1 and Pyrimidine Metabolism to IFN-γ and IL-17 Production.J Immunol. 2021 Mar 15;206(6):1181-1193. doi: 10.4049/jimmunol.2000672. Epub 2021 Feb 5. J Immunol. 2021. PMID: 33547171 Free PMC article.
References
-
- Ueda H, Howson JM, Esposito L, Heward J, Snook H, Chamberlain G, Rainbow DB, Hunter KM, Smith AN, Di Genova G, Herr MH, Dahlman I, Payne F, Smyth D, Lowe C, Twells RC, Howlett S, Healy B, Nutland S, Rance HE, Everett V, Smink LJ, Lam AC, Cordell HJ, Walker NM, Bordin C, Hulme J, Motzo C, Cucca F, Hess JF, et al. Association of the T-cell regulatory gene CTLA4 with susceptibility to autoimmune disease. Nature. 2003;423:506–511. doi: 10.1038/nature01621. - DOI - PubMed
Publication types
MeSH terms
Substances
LinkOut - more resources
Full Text Sources
Other Literature Sources
Medical
Research Materials
