

Trends in dietary quality among adults in the United States, 1999 through 2010
- PMID: 25179639
- PMCID: PMC5924699
- DOI: 10.1001/jamainternmed.2014.3422
Trends in dietary quality among adults in the United States, 1999 through 2010
Abstract
Importance: Many changes in the economy, policies related to nutrition, and food processing have occurred within the United States since 2000, and the net effect on dietary quality is not clear. These changes may have affected various socioeconomic groups differentially.
Objective: To investigate trends in dietary quality from 1999 to 2010 in the US adult population and within socioeconomic subgroups.
Design, setting, and participants: Nationally representative sample of 29 124 adults aged 20 to 85 years from the US 1999 to 2010 National Health and Nutrition Examination Survey.
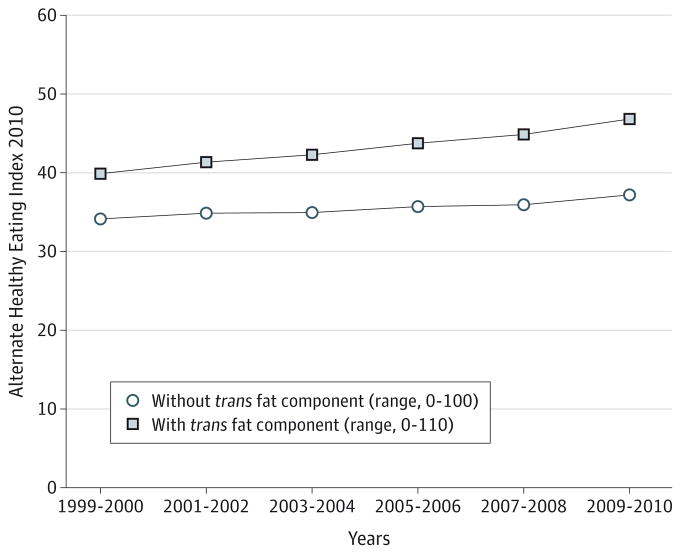
Main outcomes and measures: The Alternate Healthy Eating Index 2010 (AHEI-2010), an 11-dimension score (range, 0-10 for each component score and 0-110 for the total score), was used to measure dietary quality. A higher AHEI-2010 score indicated a more healthful diet.
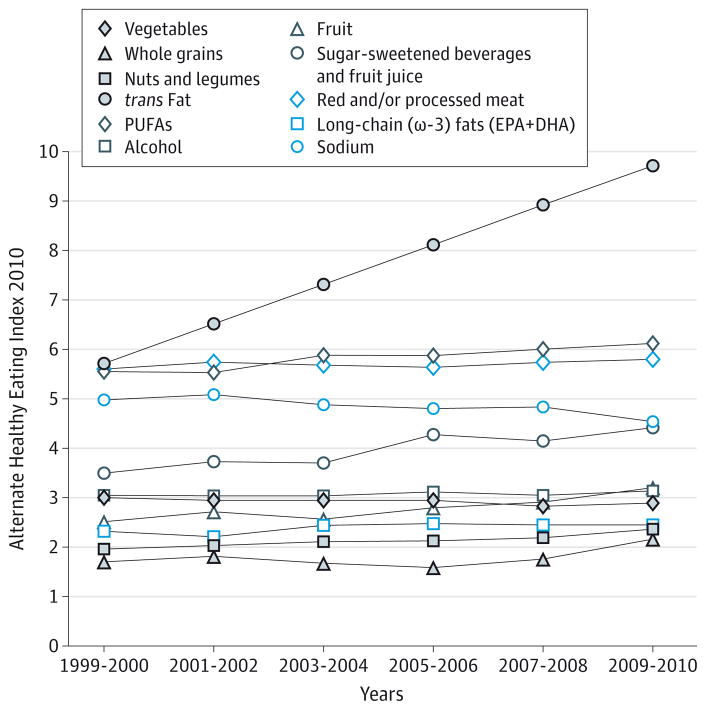
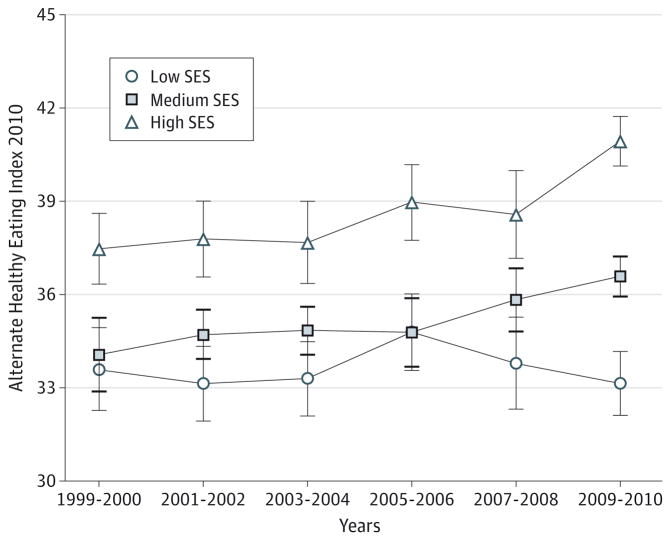
Results: The energy-adjusted mean of the AHEI-2010 increased from 39.9 in 1999 to 2000 to 46.8 in 2009 to 2010 (linear trend P < .001). Reduction in trans fat intake accounted for more than half of this improvement. The AHEI-2010 component score increased by 0.9 points for sugar-sweetened beverages and fruit juice (reflecting decreased consumption), 0.7 points for whole fruit, 0.5 points for whole grains, 0.5 points for polyunsaturated fatty acids, and 0.4 points for nuts and legumes over the 12-year period (all linear trend P < .001). Family income and education level were positively associated with total AHEI-2010, and the gap between low and high socioeconomic status widened over time, from 3.9 points in 1999 to 2000 to 7.8 points in 2009 to 2010 (interaction P = .01).
Conclusions and relevance: Although a steady improvement in AHEI-2010 was observed across the 12-year period, the overall dietary quality remains poor. Better dietary quality was associated with higher socioeconomic status, and the gap widened with time. Future efforts to improve nutrition should address these disparities.
Conflict of interest statement
Figures
Comment in
-
The growing socioeconomic disparity in dietary quality: mind the gap.JAMA Intern Med. 2014 Oct;174(10):1595-6. doi: 10.1001/jamainternmed.2014.3048. JAMA Intern Med. 2014. PMID: 25178585 No abstract available.
References
-
- Willett WC, Stampfer MJ. Current evidence on healthy eating. Annu Rev Public Health. 2013;34:77–95. - PubMed
-
- Kant AK. Indexes of overall diet quality: a review. J Am Diet Assoc. 1996;96(8):785–791. - PubMed
-
- Popkin BM, Siega-Riz AM, Haines PS. A comparison of dietary trends among racial and socioeconomic groups in the United States. N Engl J Med. 1996;335(10):716–720. - PubMed
MeSH terms
Grants and funding
LinkOut - more resources
Full Text Sources
Other Literature Sources
Miscellaneous
