. 2014 Jul 23:5:385-95.
doi: 10.1016/j.nicl.2014.07.006. eCollection 2014.

Regional functional connectivity predicts distinct cognitive impairments in Alzheimer's disease spectrum

Affiliations

Regional functional connectivity predicts distinct cognitive impairments in Alzheimer's disease spectrum

Kamalini G Ranasinghe et al. Neuroimage Clin. .

Abstract

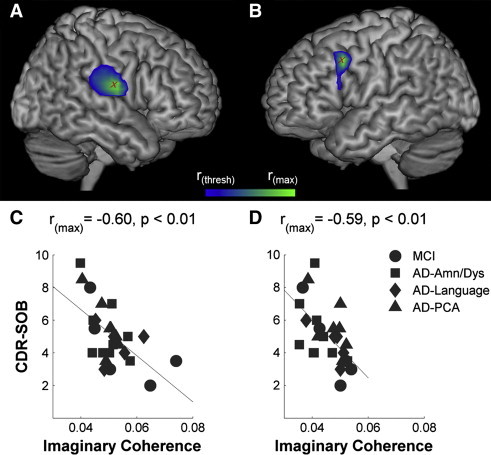
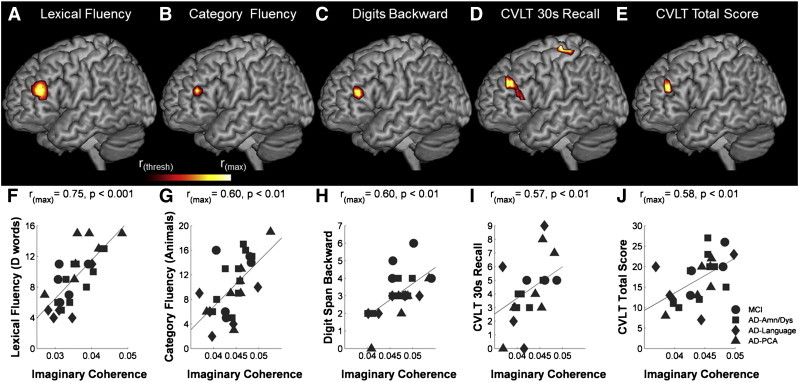
Understanding neural network dysfunction in neurodegenerative disease is imperative to effectively develop network-modulating therapies. In Alzheimer's disease (AD), cognitive decline associates with deficits in resting-state functional connectivity of diffuse brain networks. The goal of the current study was to test whether specific cognitive impairments in AD spectrum correlate with reduced functional connectivity of distinct brain regions. We recorded resting-state functional connectivity of alpha-band activity in 27 patients with AD spectrum--22 patients with probable AD (5 logopenic variant primary progressive aphasia, 7 posterior cortical atrophy, and 10 early-onset amnestic/dysexecutive AD) and 5 patients with mild cognitive impairment due to AD. We used magnetoencephalographic imaging (MEGI) to perform an unbiased search for regions where patterns of functional connectivity correlated with disease severity and cognitive performance. Functional connectivity measured the strength of coherence between a given region and the rest of the brain. Decreased neural connectivity of multiple brain regions including the right posterior perisylvian region and left middle frontal cortex correlated with a higher degree of disease severity. Deficits in executive control and episodic memory correlated with reduced functional connectivity of the left frontal cortex, whereas visuospatial impairments correlated with reduced functional connectivity of the left inferior parietal cortex. Our findings indicate that reductions in region-specific alpha-band resting-state functional connectivity are strongly correlated with, and might contribute to, specific cognitive deficits in AD spectrum. In the future, MEGI functional connectivity could be an important biomarker to map and follow defective networks in the early stages of AD.

Keywords: Alzheimer’s disease spectrum; CDR-SOB, Clinical Dementia Rating Sum of Boxes; CVLT, California Verbal Learning Test; Logopenic variant PPA; MCI, mild cognitive impairment; MEGI, magnetoencephalographic imaging; MMSE, Mini-Mental State Exam; Magnetoencephalography (MEG); Network dysfunction; PCA, posterior cortical atrophy; Posterior cortical atrophy; Resting-state functional connectivity; VOSP, Visual Object and Space Perception; fMRI, functional magnetic resonance imaging; lvPPA, logopenic variant primary progressive aphasia.


Figures

Fig. 1
Fig. 1
Averaged power spectral density estimates for different frequency bands. AD-spectrum patients showed decreased power of higher frequency activity over the alpha (p < 0.01), beta (p < 0.01) and gamma range (p = 0.08), and an apparent increase of power in lower frequency activity over the delta and theta range (nonsignificant), compared to age-matched healthy controls. Alpha range is highlighted in yellow. Shaded zone around each line depicts standard error. Spectral data were derived from MEG sensors. n = 27 patients, n = 15 controls.
Fig. 2
Fig. 2
Reduced resting-state functional connectivity is correlated with disease severity in multiple brain regions in AD spectrum. Imaginary coherence, reflecting the resting-state alpha-band global functional connectivity, predicts the degree of disease severity, as measured by the clinical dementia rating sum of boxes (CDR-SOB). The voxel containing the peak correlation between CDR-SOB and imaginary coherence identified over the right posterior perisylvian region (indicated by the “X” in panel (A)and plotted in panel (C)), and over the left frontal cortex (indicated by the “X” in panel (B)and plotted in panel (D)) are shown. Voxel-wise multiple comparisons are thresholded with 5% FDR correction. Statistical maps are superimposed on a rendering of the Montreal Neurological Institute template brain. The color scheme is normalized to the peak voxel correlation. p values on scatter plots indicate corrected p value for the peak voxel correlation. n = 27 patients. MCI = mild cognitive impairment, AD = Alzheimer’s disease, PCA = posterior cortical atrophy, Amn/Dys = amnestic/dysexecutive, AD-Language = logopenic variant primary progressive aphasia, CDR-SOB = Clinical Dementia Rating Sum of Boxes, r(thresh) = correlation coefficient at the 5% FDR threshold, r(max) = correlation coefficient of the peak voxel.
Fig. 3
Fig. 3
Resting-state functional connectivity deficits in the left dorsolateral prefrontal cortex correlate with impairments in cognitive performance in AD spectrum. Resting-state functional connectivity as measured by imaginary coherence of the left dorsolateral prefrontal cortex correlated with performance of (A, F) lexical fluency (D words), (B, G) category fluency (animals), (C, H) digit span backward, (D, I) CVLT 30-second recall, and (E, J) CVLT total score. Performance on CVLT 30-second recall also correlated with functional connectivity of the left postcentral gyrus. Statistical maps were corrected at cluster level (20 voxels) across the whole brain. The scatter plots show the peak voxel correlations. Voxel-wise multiple comparisons are thresholded with 5% FDR correction. Statistical maps are superimposed on a rendering of the Montreal Neurological Institute template brain. The color scheme of each image is normalized to the peak voxel correlation with the respective neuropsychological score. p values on scatter plots indicate corrected p value for the peak voxel correlation. The corresponding r values and corrected p values at the 5% FDR threshold (r(thresh)) include: lexical fluency, r = 0.4825, p = 0.0093; category fluency, r = 0.4785, p = 0.01; digit span backward, r = 0.4795, p = 0.0098; CVLT 30 s recall, r = 0.499, p = 0.0095; CVLT total score, r = 0.497, p = 0.0098. MCI = mild cognitive impairment, AD = Alzheimer’s disease, PCA = posterior cortical atrophy, Amn/Dys = amnestic/dysexecutive, AD-Language = logopenic variant primary progressive aphasia, CVLT = California verbal learning test, r(thresh) = correlation coefficient at the 5% FDR threshold, r(max) = correlation coefficient of the peak voxel.
Fig. 4
Fig. 4
Resting-state functional connectivity deficits in the left inferior parietal cortex correlate with impairments in visuospatial ability in AD spectrum. Resting-state functional connectivity of the left inferior parietal cortex correlated with performance on the spatial tasks of (A, C) visual construction (Benson copy), and (B, D) location discrimination (visual object and space perception (VOSP) number location). The scatter plots show the peak voxel correlations. Voxel-wise multiple comparisons are thresholded with 10% FDR correction. Statistical maps are superimposed on a rendering of the Montreal Neurological Institute template brain. The color scheme of each image is normalized to the peak voxel correlation with the respective neuropsychological score. p values on scatter plots indicate corrected p value for the peak voxel correlation. The corresponding r values and corrected p values at the 10% FDR threshold (r(thresh)): visual construction, r = 0.48, p = 0.0097; location discrimination, r = 0.5155, p = 0.0099. MCI = mild cognitive impairment, AD = Alzheimer’s disease, PCA = posterior cortical atrophy, Amn/Dys = amnestic/dysexecutive, AD-Language = logopenic variant primary progressive aphasia, VOSP number location = number location task of Visual Object and Space Perception battery, r(thresh) = correlation coefficient at the 10% FDR threshold, r(max) = correlation coefficient of the peak voxel.
Fig. 5
Fig. 5
Resting-state functional connectivity deficits in frontal association regions correlate with impairments in episodic memory performance in AD spectrum. Resting-state functional connectivity of two distinct frontal association regions correlated with performance on the episodic memory tasks (A, B) CVLT delayed recall (verbal memory) and (C, D) Benson recall (visual memory). CVLT delayed recall was related to a relatively medial region of the left frontal cortex (A), whereas Benson recall was related to a relatively more posterior and lateral region in the left frontal cortex (C). The scatter plots show the peak voxel correlations. Voxel-wise multiple comparisons are thresholded with 5% FDR correction. Statistical maps are superimposed on a rendering of the Montreal Neurological Institute template brain. The color scheme of each image is normalized to the peak voxel correlation with the respective neuropsychological score. p values on scatter plots indicate corrected p value for the peak voxel correlation. The corresponding r values and corrected p values at the 5% FDR threshold (r(thresh)): CVLT delayed recall, r = 0.498, p = 0.0096; Benson recall, r = 0.4795, p = 0.0098. MCI = mild cognitive impairment, AD = Alzheimer’s disease, PCA = posterior cortical atrophy, Amn/Dys = amnestic/dysexecutive, AD-Language = logopenic variant primary progressive aphasia, CVLT = California verbal learning test, r(thresh) = correlation coefficient at the 5% FDR threshold, r(max) = correlation coefficient of the peak voxel.
Fig. 6
Fig. 6
Bayesian hierarchical validation analysis. The thin horizontal lines show 95% confidence intervals for the estimated associations (βs), which quantify the effect of functional connectivity (imaginary coherence) of the voxels in each cluster on each of the test scores. The four medium-width lines show βs for clinical dementia rating sum of boxes (CDR-SOB) and each of the main cognitive domains (from top to bottom: executive function, visuospatial ability, and memory). The thick line at the bottom of the figure shows the global-level β. For comparability across measures, each score was standardized by subtracting off the mean score and dividing by the standard deviation. CVLT = California verbal learning test, VOSP number location = number location task of the Visual Object and Space Perception battery.
Fig. 7
Fig. 7
Voxel based morphometry (VBM)-derived atrophy patterns for different clinical variants of AD. VBM atrophy maps based on comparisons with age-matched healthy controls are shown for the three clinical variants of Alzheimer’s disease: (A)posterior cortical atrophy (PCA), (B)amnestic/dysexecutive subgroup (Amn/Dys), and (C)logopenic variant primary progressive aphasia (AD-Language). Regions of gray matter atrophy are shown on the 3-dimensional rendering of the Montreal Neurological Institute (MNI) standard template brain. Results for PCA and AD-Language were corrected for family-wise error (p < 0.05) and the results for the amnestic/dysexecutive subgroup were thesholded for uncorrected p < 0.001. MNI coordinates and corresponding t values are provided in Supplementary Table 3. n = 7 PCA, n = 7 amnestic/dysexecutive, and n = 4 AD-Language.

References

    1. Albert M.S., DeKosky S.T., Dickson D., Dubois B., Feldman H.H., Fox N.C., Gamst A., Holtzman D.M., Jagust W.J., Petersen R.C. The diagnosis of mild cognitive impairment due to Alzheimer’s disease: Recommendations from the National Institute on Aging-Alzheimer’s Association workgroups on diagnostic guidelines for Alzheimer’s disease. Alzheimer’s & Dementia: the Journal of the Alzheimer’s Association. 2011;7:270–279. 21514249 - PMC - PubMed
    1. Ashburner J., Friston K.J. Nonlinear spatial normalization using basis functions. Human Brain Mapping. 1999;7:254–266. 10408769 - PMC - PubMed
    1. Baldo J.V., Schwartz S., Wilkins D., Dronkers N.F. Role of frontal versus temporal cortex in verbal fluency as revealed by voxel-based lesion symptom mapping. Journal of the International Neuropsychological Society: JINS. 2006;12:896–900. 17064451 - PubMed
    1. Baldo J.V., Shimamura A.P. Letter and category fluency in patients with frontal lobe lesions. Neuropsychology. 1998;12:259–267. 9556772 - PubMed
    1. Benjamini Y., Hochberg Y. Controlling the false discovery rate: A practical and powerful approach to multiple testing. Journal of Royal Statistical Society. 1995;57:289–300.

Publication types