. 2014 Oct 5;369(1653):20130526.
doi: 10.1098/rstb.2013.0526.

Reconfigurable task-dependent functional coupling modes cluster around a core functional architecture

Affiliations

Reconfigurable task-dependent functional coupling modes cluster around a core functional architecture

Fenna M Krienen et al. Philos Trans R Soc Lond B Biol Sci. .

Abstract

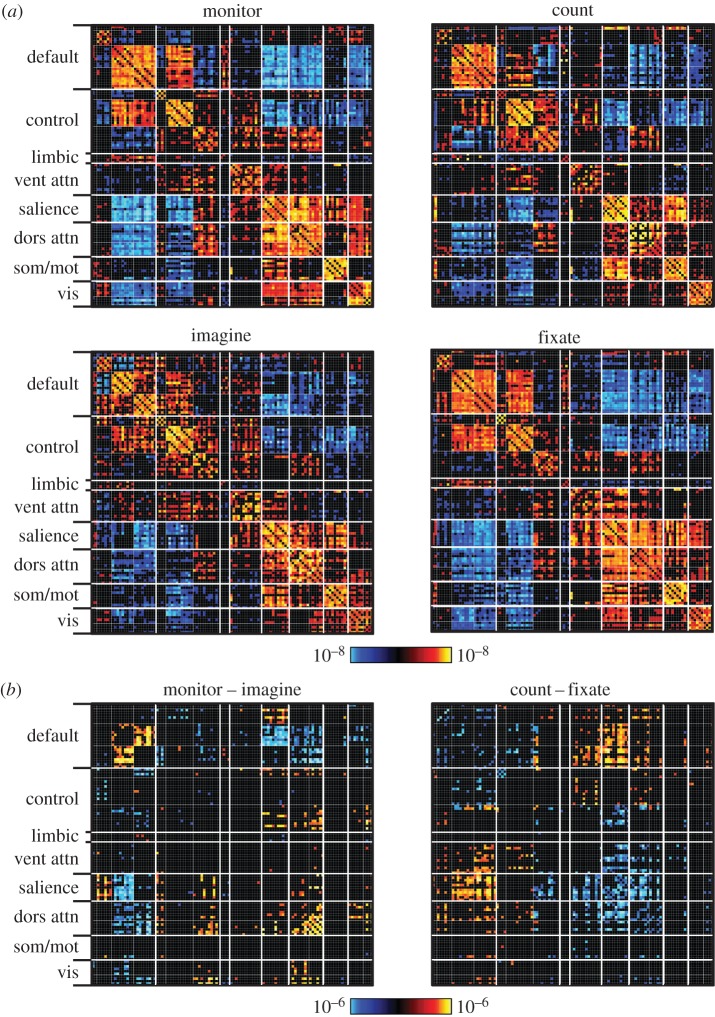
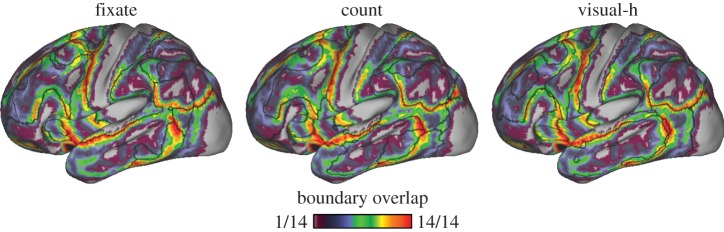
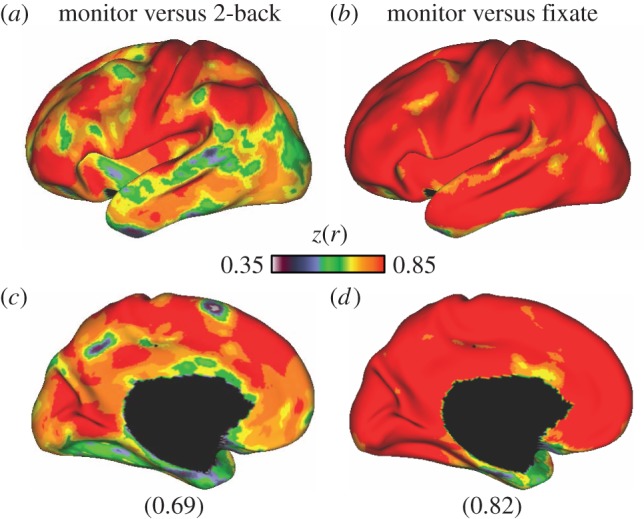
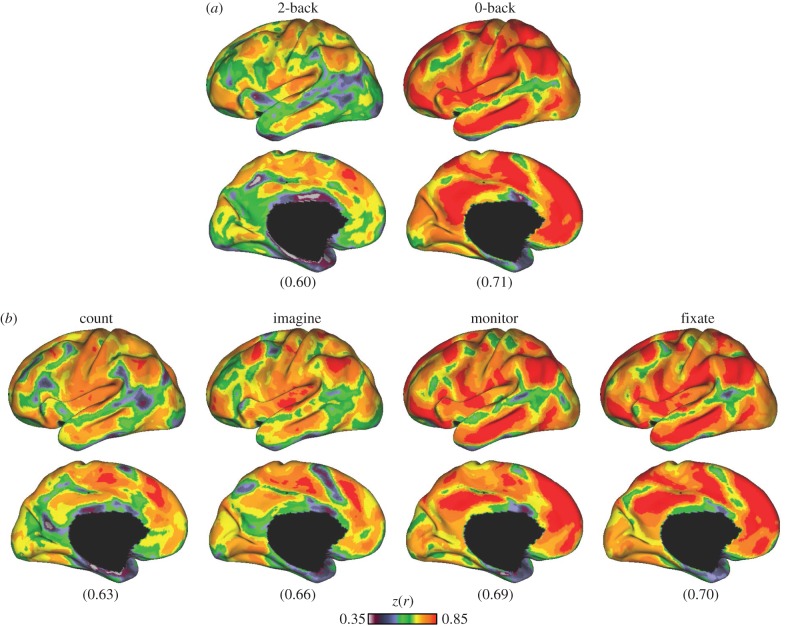
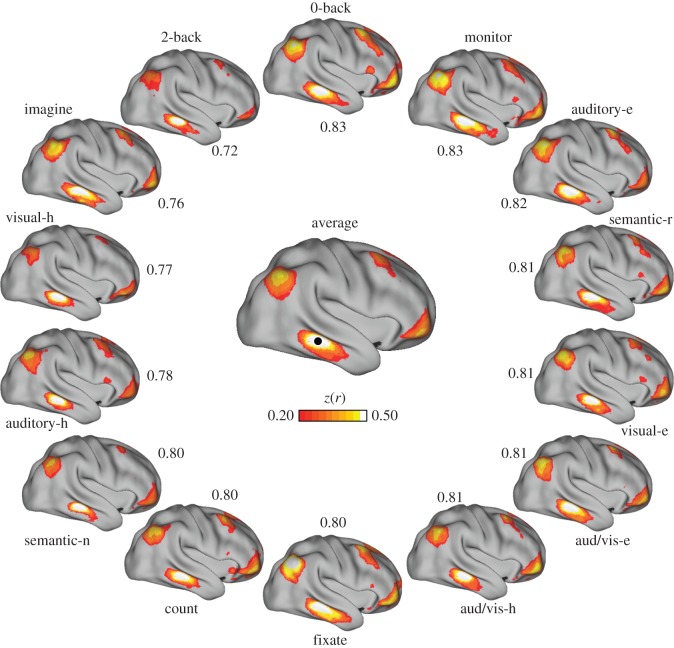
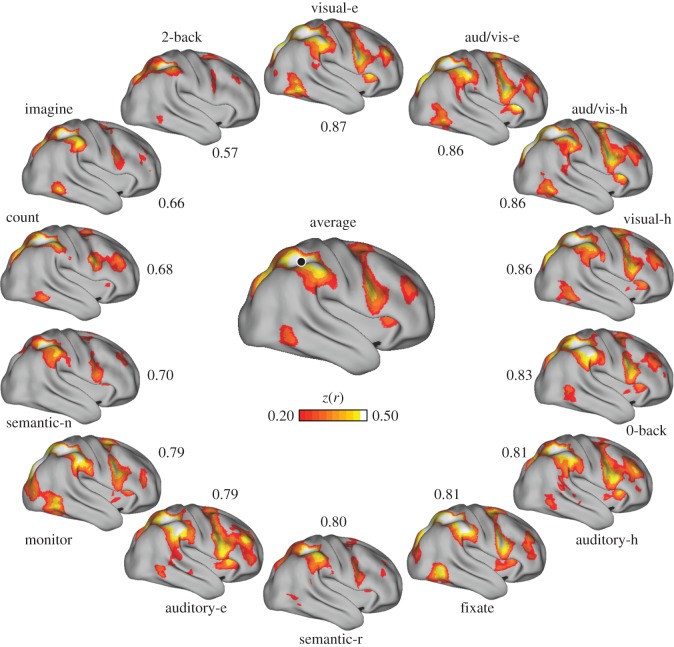
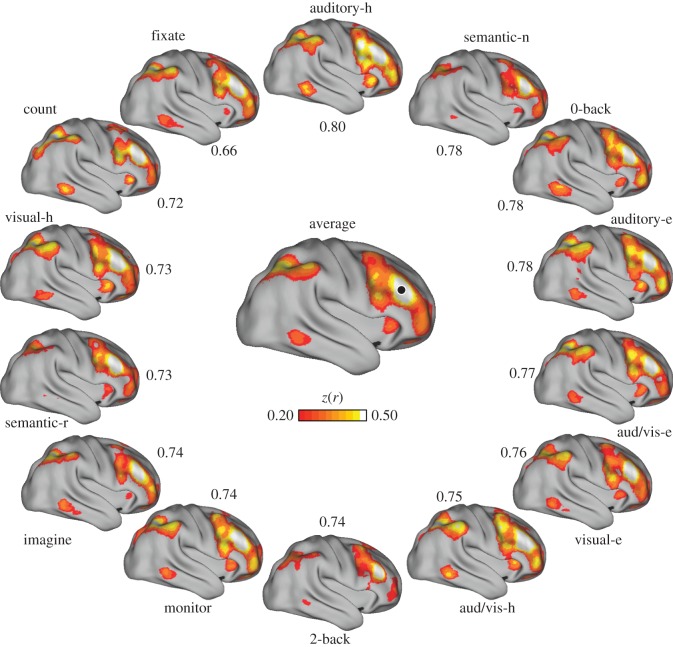
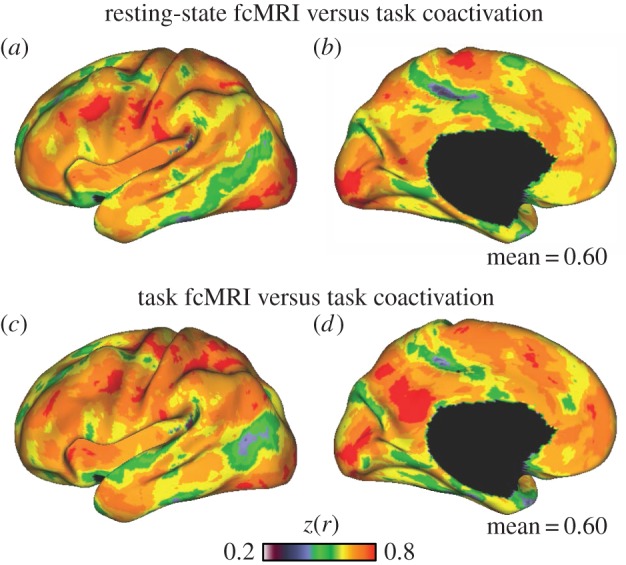
Functional coupling across distributed brain regions varies across task contexts, yet there are stable features. To better understand the range and central tendencies of network configurations, coupling patterns were explored using functional MRI (fMRI) across 14 distinct continuously performed task states ranging from passive fixation to increasingly demanding classification tasks. Mean global correlation profiles across the cortex ranged from 0.69 to 0.82 between task states. Network configurations from both passive fixation and classification tasks similarly predicted task coactivation patterns estimated from meta-analysis of the literature. Thus, even across markedly different task states, central tendencies dominate the coupling configurations. Beyond these shared components, distinct task states displayed significant differences in coupling patterns in response to their varied demands. One possibility is that anatomical connectivity provides constraints that act as attractors pulling network configurations towards a limited number of robust states. Reconfigurable coupling modes emerge as significant modifications to a core functional architecture.

Keywords: MRI; cortical networks; functional connectivity; intrinsic connectivity; resting-state.


Figures

Figure 1.
Figure 1.
Functional coupling within and between functional networks reveals similarities and differences across task states. Regions of interest obtained from the 17-network parcellation in Yeo et al. [12] were arranged by network membership. Correlation matrices were computed for four passive, continuous tasks collected in 48 subjects. Tasks were perceptually matched across conditions and required no overt responses. Tasks consisted of an external attention task (monitor), a backwards counting task (count), an episodic imagining task (imagine) and a passive fixation task (fixate). (a) Across all tasks, positive correlations predominantly fall along the diagonal, indicating that the arrangement according to network captures much of the structure of the coupling patterns in each task. (b) Examples of direct comparisons between task variants reveal differences in coupling within (along diagonal) and between (off-diagonal) functional networks.
Figure 2.
Figure 2.
Network transitions vary across functional states. 7-Network clustering parcellations were computed separately for all 14 tasks (N = 48). Heatmap indicates number of tasks (out of 14) for which a transition between networks falls at a given location on the lateral left hemisphere. Black lines indicate the location of network boundaries for the three particular tasks shown. Some border locations are highly consistent across tasks—e.g. transitions occurring near pre-central cortex and between inferior parietal and occipital regions. Other locations consistently do not contain network transitions, for instance in parts of medial prefrontal, somatomotor and occipital cortex. Certain regions in prefrontal, temporal and parietal cortex exhibit considerable variability of network topography across tasks. The agreement between any given task and the other 13 tasks' network boundary locations was similar across all tasks (mean overlap was 64–67%). The passive fixation task (fixate) agreement to the other tasks was not exceptional in this respect (mean overlap = 66%). h, hard.
Figure 3.
Figure 3.
Global coupling profiles are substantially similar across tasks. Across all possible pairs of tasks (91 pairs), the lowest and highest mean correlation of whole-cortex global connectivity profiles ranged between 0.69 and 0.82. (a,c) The global connectivity correspondence between the monitor and 2-back (hard) tasks, the task pair with the lowest global coupling correspondence (0.69). (b,d) The agreement between the monitor and fixate tasks, the pair with the highest (0.82) agreement. Lateral surface views of the left hemisphere are shown on (a,b) and medial views are at (c,d). A large proportion of the correlation structure is shared, even across these distinct task states.
Figure 4.
Figure 4.
Global fcMRI coupling structure is shared across task variants. A substantial portion of the coupling structure in each task is common across all tasks. (a) Correlation of whole-cortex correlation profiles computed between each task and the average of the remaining 13 tasks. The lowest and highest mean correspondence belonged to the 2-back (mean = 0.60) and 0-back (mean = 0.71) tasks, respectively. (b) Correlation between the global connectivity profiles of the four passive tasks to the remainder of the 13 tasks. Within the four passive tasks, average correlations ranged between 0.63 and 0.70.
Figure 5.
Figure 5.
Variation in coupling to lateral temporal cortex. (Centre) Connectivity for a seed region (black circle) in right lateral temporal cortex, computed from a correlation matrix obtained from averaging the matrices of all 14 tasks. (Perimeter) Correlation maps for the same seed region in each of the 14 tasks are arranged clockwise from top in order of best to worst agreement to the centre map. Only positive correlations are shown. Numbers indicate z(r) between correlation maps. aud/vis, audio/visual; e, easy; h, hard; n, new; r, repeat.
Figure 6.
Figure 6.
Variation in coupling to intraparietal sulcus. Formatting as in figure 5. Note the change in the ranking of best-to-worst agreement with the average correlation map relative to figure 5. In this case, the visual discrimination tasks show the best agreement to the task-averaged solution.
Figure 7.
Figure 7.
Variation in coupling to dorsolateral prefrontal cortex. Formatting as in figure 5. A seed region in dorsolateral prefrontal cortex is correlated with a large swath of lateral prefrontal cortex as well as portions of the inferior parietal lobule and intraparietal sulcus, consistent with the fronto-parietal control network [12]. In this case, the auditory–hard task has highest agreement to the average, whereas the fixate task has the lowest.
Figure 8.
Figure 8.
Functional coupling in active and passive states similarly predicts task coactivation. (a,b) Replicating previous work [71], passive state correlation patterns across the cerebral cortex predict co-activation patterns from large-scale meta-analytic databases such as Neurosynth (mean r = 0.60). The passive (resting-state) task was passive visual fixation. (c,d) fcMRI correlation matrices obtained from active semantic classification task data predict meta-analytic co-activation patterns to a similar degree (mean r = 0.60). Only left hemisphere is shown.
Figure 9.
Figure 9.
Cerebro-cerebellar network organization is conserved across task states. A roughly homotopic relationship exists between the proportion of the cerebral cortex and the cerebellum assigned to each network. The top row re-plots data from [70], demonstrating this relationship for eyes open rest data acquired from N = 1000 participants. A similar correlation persists in all 14 tasks measured in this study, though the details of the network configurations change in each case. (Bottom rows) Representative examples of homotopic scaling across Passive, Word and Sensory task variants. Left column shows the lateral views of the 7-network cerebral cortical parcellation for each task. Middle column shows a representative coronal slice of the corresponding cerebellar parcellation. Right column plots percentage of cerebellum (volume) against percentage of cerebrum (surface area). Points in scatter plot represent each of the 17 networks, following [70]. Black asterisks indicate networks that formed splits between homotopic regions in both the cerebral and cerebellar cortices for particular tasks.

References

    1. Beckmann CF, DeLuca M, Devlin JT, Smith SM. 2005. Investigations into resting-state connectivity using independent component analysis. Phil. Trans. R. Soc. Lond. B 360, 1001–1013. ( 10.1098/rstb.2005.1634) - DOI - PMC - PubMed
    1. Damoiseaux JS, Rombouts SARB, Barkhof F, Scheltens P, Stam CJ, Smith SM, Beckmann CF. 2006. Consistent resting-state networks across healthy subjects. Proc. Natl Acad. Sci. USA 103, 13 848–13 853. ( 10.1073/pnas.0601.4171.03) - DOI - PMC - PubMed
    1. De Luca M, Beckmann CF, De Stefano N, Matthews PM, Smith SM. 2006. fMRI resting state networks define distinct modes of long-distance interactions in the human brain. NeuroImage 29, 1359–1367. ( 10.1016/j.neuroimage.2005.08.035) - DOI - PubMed
    1. Fox M, Corbetta M, Snyder A, Vincent JL, Raichle ME. 2006. Spontaneous neuronal activity distinguishes human dorsal and ventral attention systems. Proc. Natl Acad. Sci. USA 103, 10 046–10 051. ( 10.1073/pnas.0604187103) - DOI - PMC - PubMed
    1. Seeley WW, Menon V, Schatzberg AF, Keller J, Glover GH, Kenna H, Reiss AL, Greicius MD. 2007. Dissociable intrinsic connectivity networks for salience processing and executive control. J. Neurosci. 27, 2349–2356. ( 10.1523/JNEUROSCI.5587-06.2007) - DOI - PMC - PubMed

Publication types

LinkOut - more resources