. 2014 Oct 5;369(1653):20130530.
doi: 10.1098/rstb.2013.0530.

Using Pareto optimality to explore the topology and dynamics of the human connectome

Affiliations

Using Pareto optimality to explore the topology and dynamics of the human connectome

Andrea Avena-Koenigsberger et al. Philos Trans R Soc Lond B Biol Sci. .

Abstract

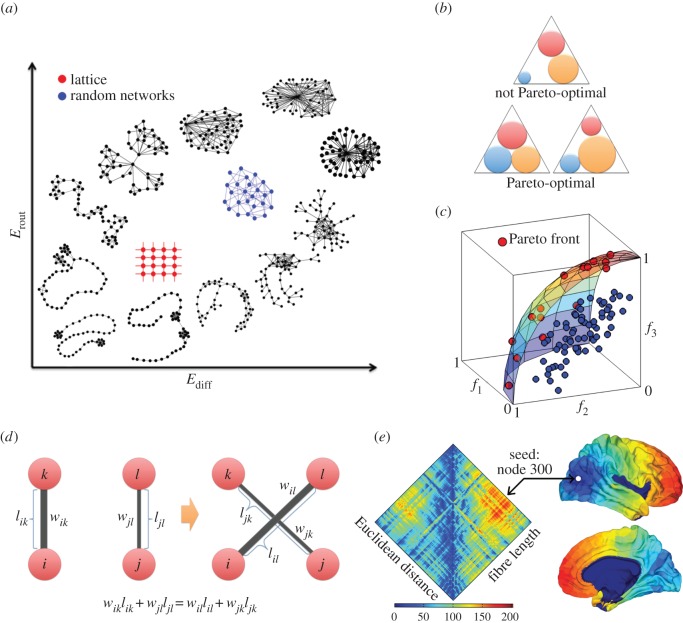
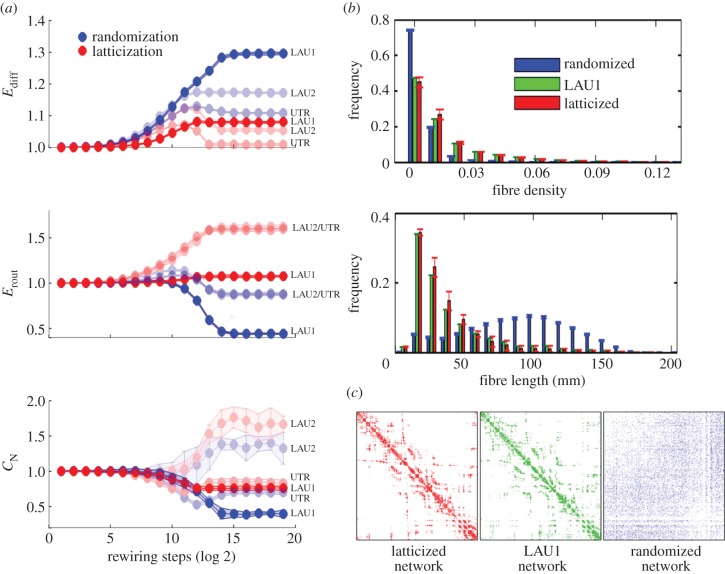
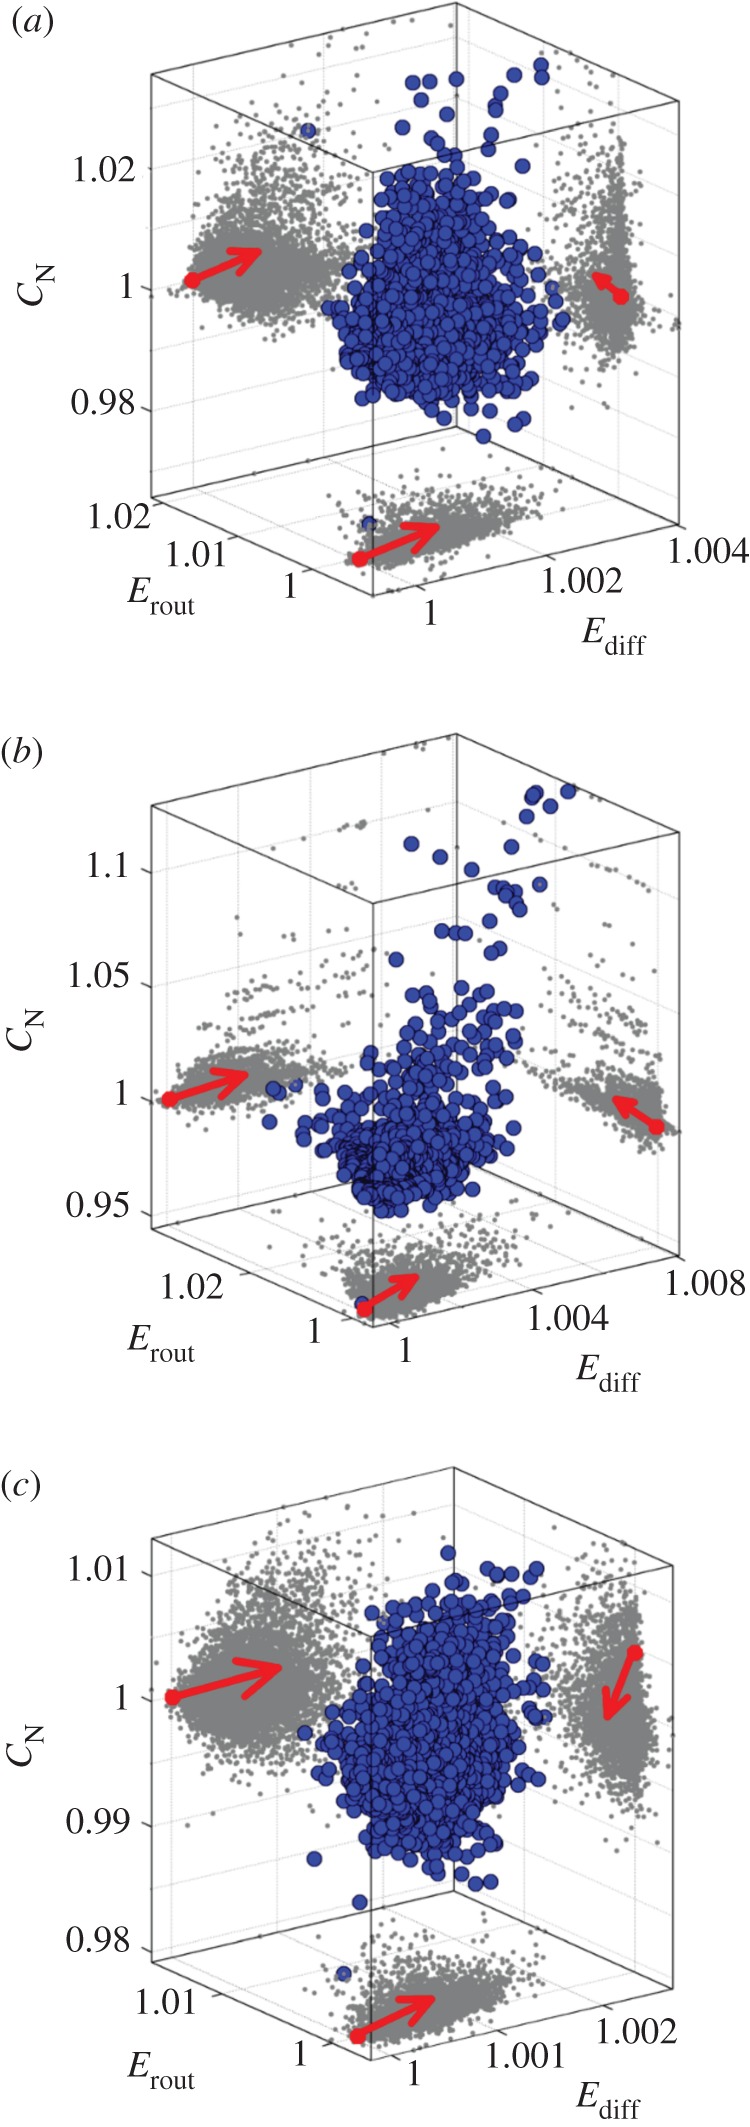
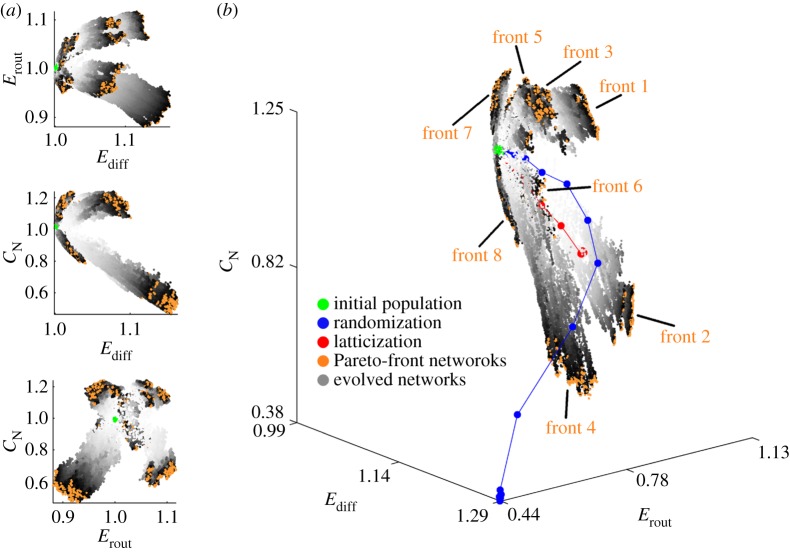
Graph theory has provided a key mathematical framework to analyse the architecture of human brain networks. This architecture embodies an inherently complex relationship between connection topology, the spatial arrangement of network elements, and the resulting network cost and functional performance. An exploration of these interacting factors and driving forces may reveal salient network features that are critically important for shaping and constraining the brain's topological organization and its evolvability. Several studies have pointed to an economic balance between network cost and network efficiency with networks organized in an 'economical' small-world favouring high communication efficiency at a low wiring cost. In this study, we define and explore a network morphospace in order to characterize different aspects of communication efficiency in human brain networks. Using a multi-objective evolutionary approach that approximates a Pareto-optimal set within the morphospace, we investigate the capacity of anatomical brain networks to evolve towards topologies that exhibit optimal information processing features while preserving network cost. This approach allows us to investigate network topologies that emerge under specific selection pressures, thus providing some insight into the selectional forces that may have shaped the network architecture of existing human brains.

Keywords: brain connectivity; diffusion imaging; graph theory; network science.


Figures

Figure 1.
Figure 1.
(a) Diagram of a communication-efficiency morphospace for toy-networks; the location of a toy-network within this morphospace of abstract networks can be associated with specific aspects of network structure that favour two distinct communication schemes: diffusion-based communication (Ediff) and routing-based communication (Erout). (b) Geometric example of Pareto optimality: the area of three circles represents three objectives to be maximized; circles are constrained to be contained within an equilateral triangle and cannot overlap with each other. There are several solutions to the problem; the top triangle shows a solution that could be improved by increasing the area of the blue circle; thus, it is not Pareto-optimal. The two bottom triangles show solutions in which the area of none of the circles can be increased without having to decrease the area of another circle; therefore, the solutions are Pareto-optimal [45]. (c) Example of a Pareto front, where three objective functions are to be maximized. All the points in the plot represent feasible solutions; however, only the red points belong to the Pareto front. (d) Rewiring rule: the weights of the edges {i, l} and {j, k} are randomly selected, provided that the total wiring cost is preserved. (e) Matrix of Euclidean distances (left side) and interpolated fibre lengths (right side) between all pairs of nodes of the LAU1 dataset. The colour map on the human cortex images represents the fibre lengths after interpolation between node 300 (whose location is indicated with a white circle) and all other nodes of the LAU1 network.
Figure 2.
Figure 2.
(a) Latticization and randomization of empirical brain networks. (b) Fibre length and fibre density distributions of randomized networks (blue), LAU1 network (green) and latticized networks (red). Randomized and latticized network distributions are averages over 40 repetitions of the randomization and latticization process applied to the LAU1 empirical network. (c) Adjacency matrices of latticized LAU1 network (red), LAU1 network (green) and randomized LAU1 network (blue).
Figure 3.
Figure 3.
Population of proximal network elements of (a) LAU1, (b) LAU2 and (c) UTR networks, respectively. Every blue dot shows the location of a network that was created by applying three rewiring steps to the respective empirical network. Grey dots show the two-dimensional projections onto the distinct planes of the morphospace. Red dots at the origin of the arrows indicate the projections in each two-dimensional plane of the three-dimensional coordinates (1, 1, 1), which correspond to the location of the empirical networks within the respective morphospace. Arrows point towards the preferred direction in which proximal networks are located in each plane.
Figure 4.
Figure 4.
Evolved brain networks located within the LAU1 efficiency-complexity morphospace. (a) Two-dimensional projections of the three-dimensional morphospace. The coordinates (Ediff, Erout, CN) = (1, 1, 1) are the coordinates corresponding to the LAU1 network, and therefore the initial population is located very close to those coordinates (cf. figure 3). All points indicate the regions of morphospace explored by eight independent runs of the optimization algorithm, all starting with the same initial population but driven by eight distinct objective functions (see §2e(ii)). The grey-scale assigned to each network indicates the epoch in which it was created, with light grey corresponding to early epochs and darker grey to later epochs. Orange points correspond to the Pareto-front networks of the last epoch of each front. (b) Three-dimensional efficiency-communication morphospace. Blue and red points show the average trajectory of a randomized and latticized brain network, respectively, which are not subjected to the selective pressures imposed when exploring the different fronts. The grey-scale assigned to each network indicates the epoch in which it was created, with light grey corresponding to early epochs and darker grey to later epochs. Orange points correspond to the Pareto-front networks of the last epoch of each front.
Figure 5.
Figure 5.
Examples of low-resolution brain networks. (a) Low-resolution partition of the right hemisphere of the human cortex, composed of 33 anatomical areas. (b) Down-sampled connection weights (fibre densities) of LAU1 network. (c) Difference between the average networks of fronts 1 through 4, and the LAU1 network. Blue elements indicate negative sign; red elements indicate positive sign. (d) Consistent changes of connection strengths in evolved network populations: colours indicate whether fibre densities increased (red), decreased (blue) or changed in an unspecific direction (green) across 90% or more of the evolved networks belonging to one front.
Figure 6.
Figure 6.
Consistent changes in connection patterns observed in fronts 1 through 4 across all three datasets. (a) Density of empirical and evolved networks. (b) New connections (red points) in evolved networks tend to extend over long spatial distances; fibre densities that are weakened during evolution (blue points) tend to involve pairs of nodes that are spatially close or belong to the same anatomical region. (c) High-cost connections are principal targets for rewiring during the evolutionary process.

References

    1. Sporns O. 2011. Networks of the brain. Cambridge, MA: MIT Press.
    1. Park HJ, Friston K. 2013. Structural and functional brain networks: from connections to cognition. Science 342, 1238411 (10.1126/science.1238411) - DOI - PubMed
    1. Hagmann P, Cammoun L, Gigandet X, Meuli R, Honey C, Wedeen V, Sporns O. 2008. Mapping the structural core of human cerebral cortex. PLoS Biol. 6, e159 (10.1371/journal.pbio.0060159) - DOI - PMC - PubMed
    1. Gong G, He Y, Concha L, Lebel C, Gross D, Evans AC, Beaulieu C. 2009. Mapping anatomical connectivity patterns of human cerebral cortex using in vivo diffusion tensor imaging tractography. Cereb. Cortex 19, 524–536. (10.1093/cercor/bhn102) - DOI - PMC - PubMed
    1. van den Heuvel MP, Sporns O. 2011. Rich club organization of the human connectome. J. Neurosci. 31, 15775–15786. (10.1523/JNEUROSCI.3539-11.2011) - DOI - PMC - PubMed

Publication types

LinkOut - more resources