. 2014 Oct;124(10):4577-89.
doi: 10.1172/JCI75212. Epub 2014 Sep 2.

Mast cells aggravate sepsis by inhibiting peritoneal macrophage phagocytosis

Mast cells aggravate sepsis by inhibiting peritoneal macrophage phagocytosis

Albert Dahdah et al. J Clin Invest. 2014 Oct.

Abstract

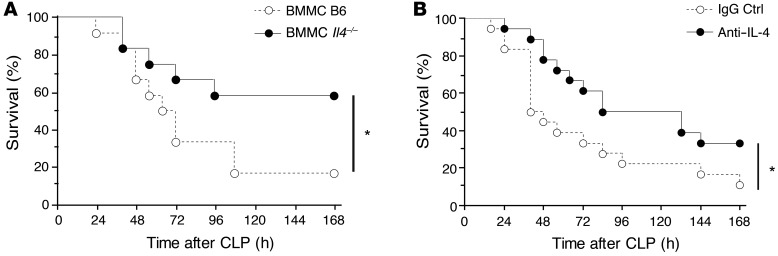
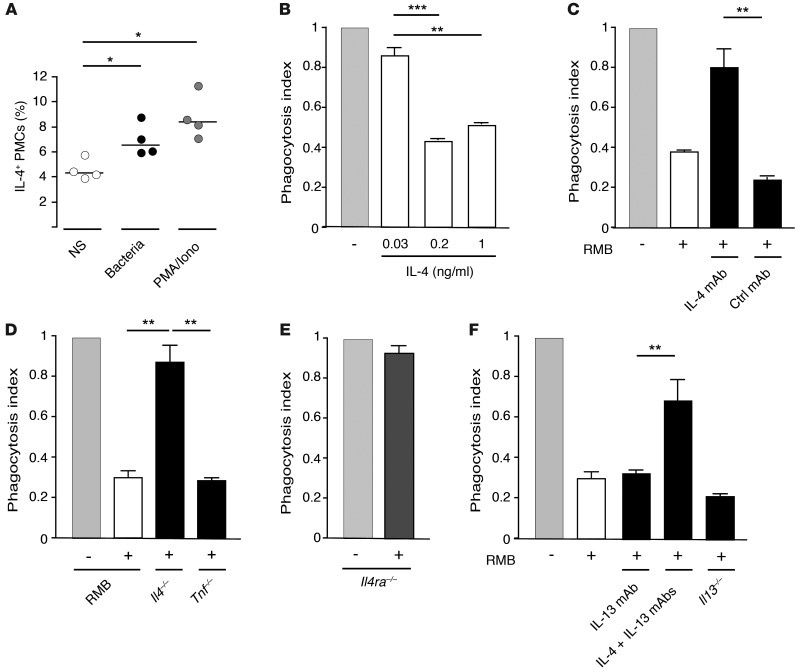
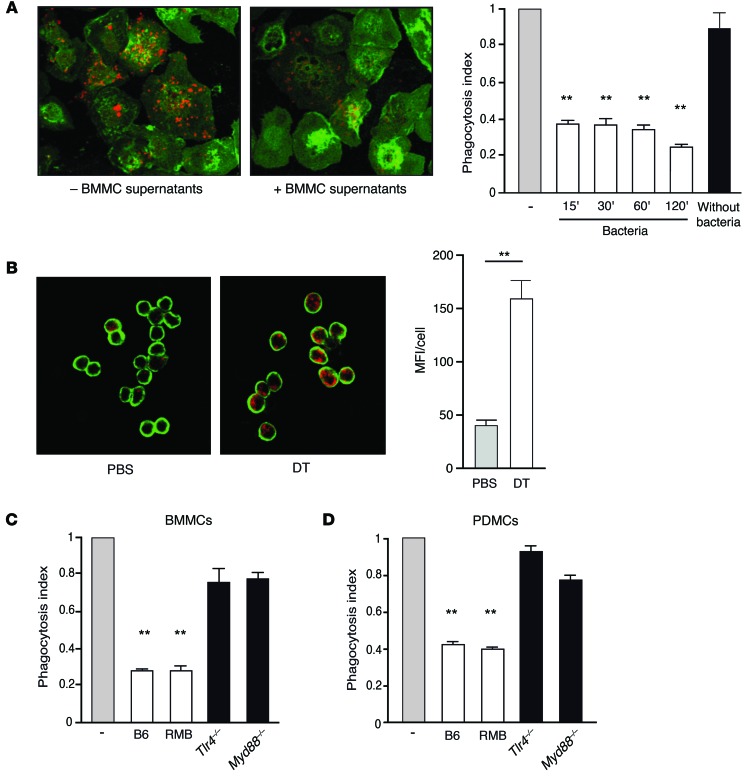
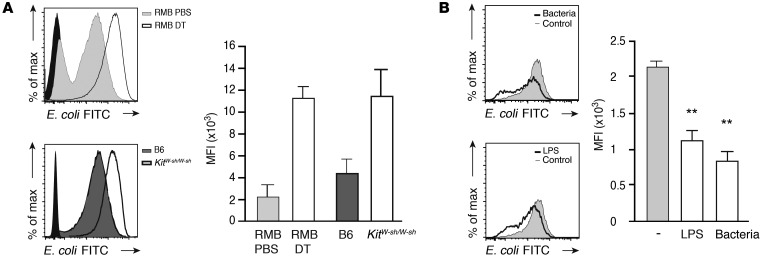
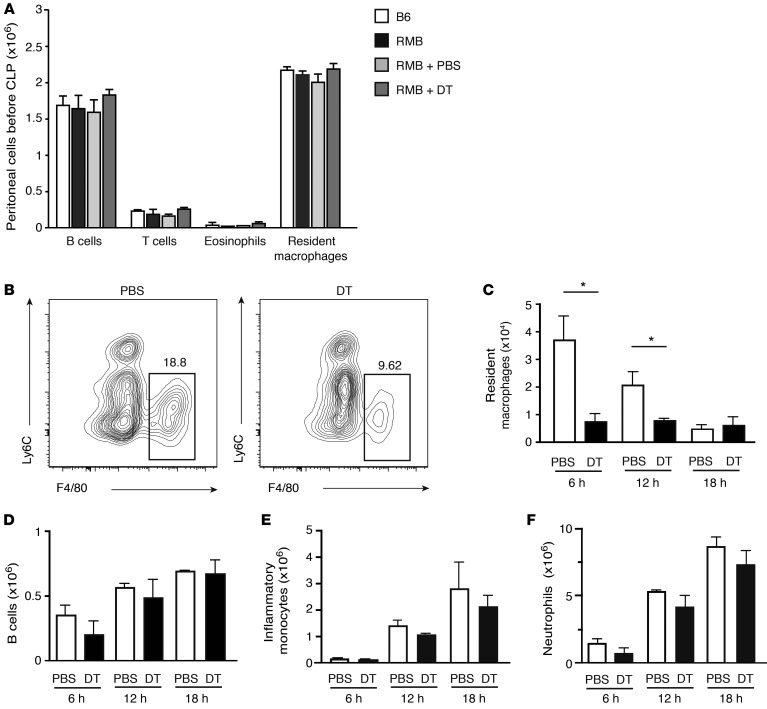
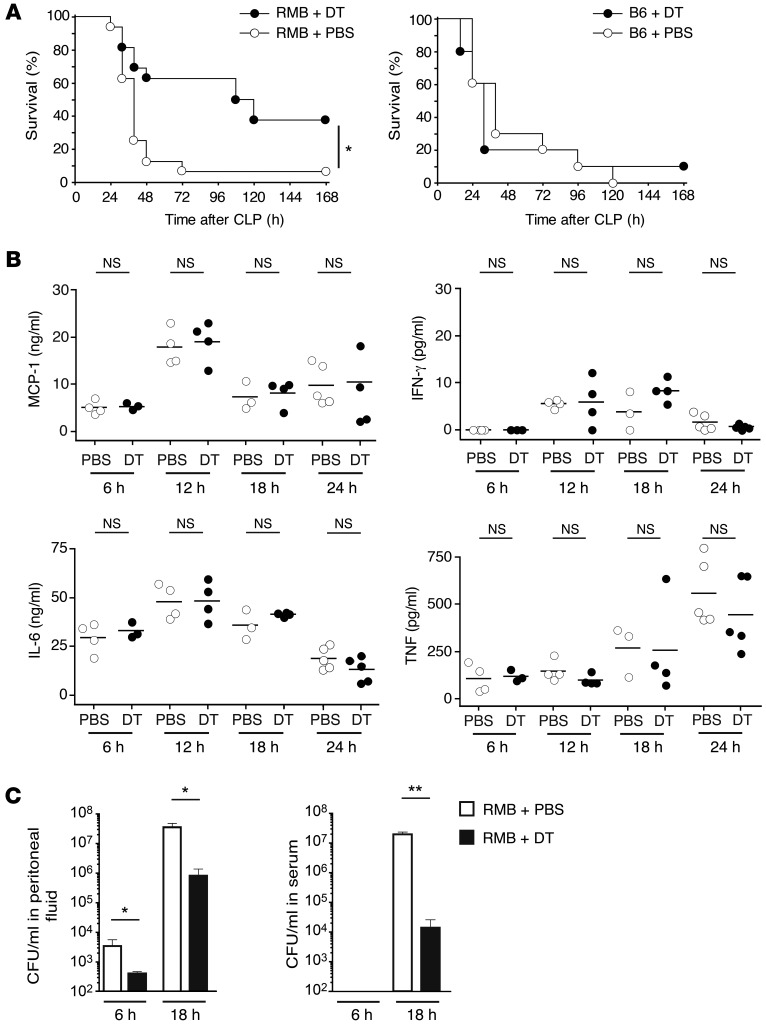
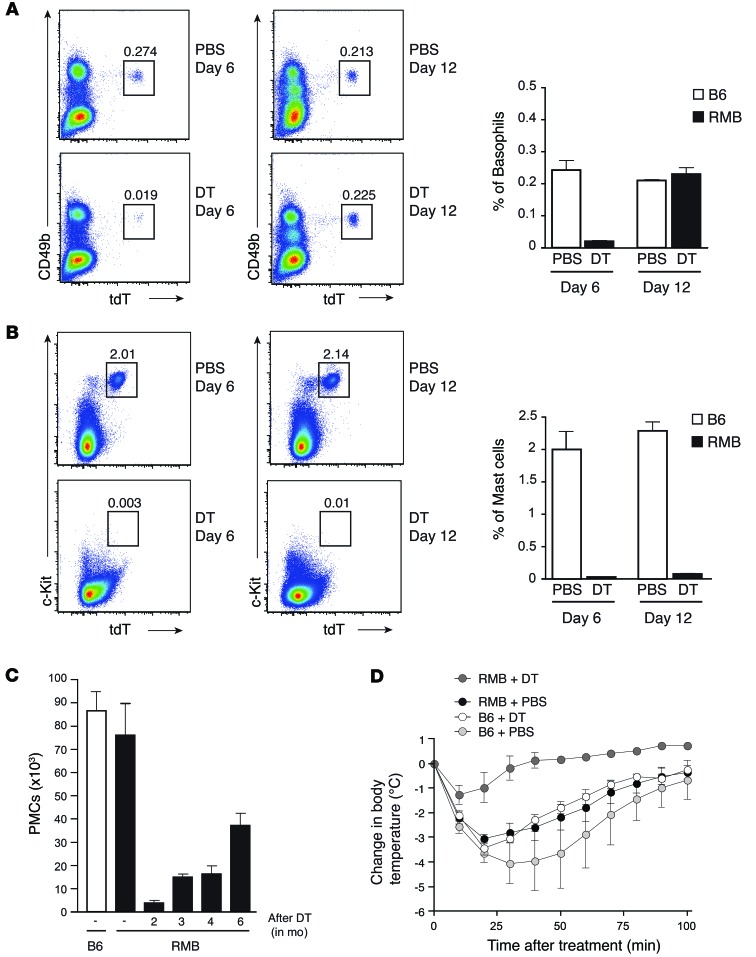
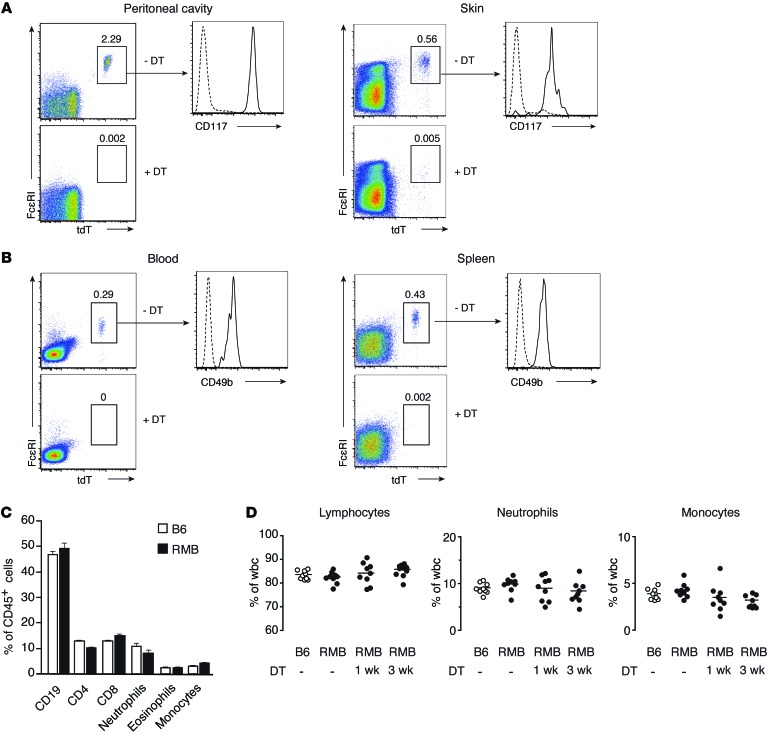
Controlling the overwhelming inflammatory reaction associated with polymicrobial sepsis remains a prevalent clinical challenge with few treatment options. In septic peritonitis, blood neutrophils and monocytes are rapidly recruited into the peritoneal cavity to control infection, but the role of resident sentinel cells during the early phase of infection is less clear. In particular, the influence of mast cells on other tissue-resident cells remains poorly understood. Here, we developed a mouse model that allows both visualization and conditional ablation of mast cells and basophils to investigate the role of mast cells in severe septic peritonitis. Specific depletion of mast cells led to increased survival rates in mice with acute sepsis. Furthermore, we determined that mast cells impair the phagocytic action of resident macrophages, thereby allowing local and systemic bacterial proliferation. Mast cells did not influence local recruitment of neutrophils and monocytes or the release of inflammatory cytokines. Phagocytosis inhibition by mast cells involved their ability to release prestored IL-4 within 15 minutes after bacterial encounter, and treatment with an IL-4-neutralizing antibody prevented this inhibitory effect and improved survival of septic mice. Our study uncovers a local crosstalk between mast cells and macrophages during the early phase of sepsis development that aggravates the outcome of severe bacterial infection.


Figures

Figure 8
Figure 8. Mast cells mediate IL-4–impeded survival in severe sepsis.
(A) Survival of DT-treated RMB mice reconstituted with BMMCs from B6 mice (white circles; n = 12) or with BMMCs from IL-4–deficient mice (black circles; n = 12) after acute CLP. *P < 0.05. (B) Survival of RMB mice injected with anti–IL-4 antibody (black circles; n = 18) and isotype control IgG (white circles; n = 18) after acute CLP. *P < 0.05.
Figure 7
Figure 7. IL-4 released from mast cells decreases macrophage phagocytosis.
(A) IL-4 from PMCs before (white circles) and after a 15-minute stimulation with bacteria (black circles) or PMA/ionomycin (gray circles). NS, not stimulated. Each circle represents an individual experiment; small horizontal lines indicate the mean of 4 independent experiments. *P < 0.05. (B) Peritoneal macrophage phagocytosis of pHrodo E. coli in the presence of different doses of recombinant IL-4. **P < 0.01; ***P < 0.001. (C) Peritoneal macrophage phagocytosis of pHrodo E. coli in the presence of cell-free supernatants from BMMCs activated by fixed bacteria and preincubated with anti–IL-4–blocking antibody or isotype control IgG antibody. **P < 0.01. (D) Peritoneal macrophage phagocytosis of pHrodo E. coli in the presence of supernatants from RMB-derived BMMCs derived from RMB, Il4–/–, or Tnf–/– mice activated with fixed bacteria. **P < 0.01. (E) Phagocytosis of pHrodo E. coli by Il4ra–deficient peritoneal macrophage in the presence of cell-free supernatants from RMB BMMCs activated by fixed bacteria. (F) Peritoneal macrophage phagocytosis of pHrodo E. coli in the presence of cell-free supernatants from RMB BMMCs activated by fixed bacteria and preincubated with anti–IL-13 or anti–IL-13 plus anti–IL-4–blocking antibodies and bacteria-activated supernatants from Il13–/– BMMCs. Data are representative of 4 (A) and 3 (BF) independent experiments and represent the mean ± SEM. **P < 0.01; ***P < 0.001.
Figure 6
Figure 6. Macrophage phagocytosis inhibition by mast cells is dependent on TLR4.
(A) Representative confocal microscopic analysis of in vitro peritoneal macrophage phagocytosis of pHrodo E. coli (in red) after the addition (+ BMMC supernatants) or not (– BMMC supernatants) of cell-free supernatants from BMMCs activated for 15 minutes with fixed bacteria. Right: Histograms show inhibition of macrophage phagocytosis by supernatants of unstimulated (Without bacteria) BMMCs or BMMCs activated for 15, 30, 60, or 120 minutes with fixed bacteria. (B) Representative confocal analysis of in vivo peritoneal macrophage phagocytosis of pHrodo E. coli (in red) injected for 15 minutes into the peritoneal cavity of PBS- or DT-treated RMB mice. Cells from the peritoneal cavity were collected and subjected to a cytospin protocol before labeling. (C and D) In vitro peritoneal macrophage phagocytosis of pHrodo E. coli in the presence of supernatants from BMMCs (C) or PDMCs (D) derived from B6, RMB, Tlr4–/–, and Myd88–/– mice activated with fixed bacteria and assessed by confocal microscopy. Data are representative of 4 independent experiments and represent the mean ± SEM. **P < 0.01.
Figure 5
Figure 5. Rapid regulation of macrophage phagocytosis by mast cells.
(A) Flow cytometric analysis of in vivo peritoneal macrophage phagocytosis of FITC-labeled E. coli injected into RMB mice previously treated with PBS or DT (upper panel) and into B6 or KitW-sh/W-sh mice (lower panel). Black histogram represents resident macrophages without E. coli-FITC injection. (B) Flow cytometric analysis of ex vivo peritoneal macrophage phagocytosis of E. coli-FITC in the presence of cell-free supernatants from BMMCs activated either by LPS or E. coli-FITC (Bacteria). **P < 0.01. Data are representative of 3 independent experiments and represent the mean ± SEM.
Figure 4
Figure 4. Decrease in resident macrophage numbers in mast cell–deficient mice after sepsis.
(A) Identical levels of resident macrophages, T and B lymphocytes, as well as eosinophils in B6, RMB, and PBS- or DT-treated RMB mice before CLP determined by flow cytometric analysis. (B and C) Labeling profiles of resident macrophages in DT- and PBS-treated mice 6 hours after CLP (B) and absolute numbers at 6, 12, and 18 hours after CLP (C). Numbers above gated areas in B indicate the percentage of macrophages among CD45+ cells. (DF) Flow cytometric analysis of B cells (D), inflammatory monocytes (E), and neutrophils (F) in the peritoneum at 6, 12, and 18 hours after CLP in PBS-injected (white bars) and DT-treated RMB mice (black bars). Data are representative of 5 independent experiments and represent the mean ± SEM. *P < 0.05.
Figure 3
Figure 3. Mast cells aggravate severe sepsis.
(A) Left panel: Survival after acute CLP in PBS-injected (white circles; n = 16) and DT-treated RMB mice (black circles; n = 16). Kaplan-Meier curves and the log-rank test were used to analyze mortality rates. *P = 0.0282. Right panel: Survival after acute CLP in PBS-injected (white circles; n = 10) and DT-injected B6 mice (black circles; n = 10). (B) Concentration of the proinflammatory cytokines MCP-1, IFN-γ, IL-6, and TNF in the peritoneal cavity at 6, 12, 18, and 24 hours after CLP in RMB mice injected with either PBS (white circles) or DT (black circles). Each circle represents a single mouse; small horizontal lines indicate the mean of all mice per condition. (C) Bacterial numbers (CFU) in the peritoneal fluid (left panel) and serum (right panel) of PBS-injected (white bars) or DT-treated RMB mice (black bars) 6 and 18 hours after CLP. Data are representative of 6 independent experiments. Values obtained from 6 mice per group. NS, not statistically different. *P < 0.05; **P < 0.01. Data represent the mean ± SEM.
Figure 2
Figure 2. Differential repopulation kinetics of mast cells and basophils after DT depletion.
(A and B) Flow cytometric analysis of blood basophils (CD49+tdT+) (A) and PMCs (CD117+tdT+) (B) at 6 and 12 days after DT injection. Numbers in each panel correspond to the percentage of basophils or mast cells among CD45+ cells. (C) Analysis of PMCs (FcεRI+tdT+CD117+) in RMB mice 2, 3, 4, and 6 months after DT injection as compared with those from untreated RMB and B6 mice (n = 4 mice/group). (D) Temperature was monitored every 10 minutes after the induction of passive systemic anaphylaxis in RMB mice injected with PBS (black circles) or DT (dark gray circles) as well as in B6 mice injected with PBS (light gray circles) or DT (white circles). n = 5 mice/group. Data are representative of 5 independent experiments and represent the mean ± SEM.
Figure 1
Figure 1. Visualization and efficient depletion of mast cells and basophils in RMB mice.
(A) Detection of mast cells (FcεRI+tdT+CD117+) by flow cytometry in the peritoneal cavity (left panel) and dermis (right panel) of RMB mice before and after 2 i.p. DT injections. (B) Detection of basophils (FcεRI+tdT+CD49b+) in the blood (left panel) and in the spleen (right panel) of RMB mice before and after DT treatment. Dotted lines represent isotype control antibodies. Numbers in each panel represent the percentage of mast cells and basophils among CD45+ gated cells. (C) Flow cytometric analysis of blood leukocytes in B6 and untreated RMB mice. Data represent the mean ± SEM. (D) Percentage of blood lymphocytes, neutrophils, and monocytes in B6 and untreated RMB mice and in RMB mice 1 week or 3 weeks after DT treatment, as determined by a hematological analyzer (n = 9 mice/group). Data are representative of 5 independent experiments (AC).

References

    1. Soehnlein O, Lindbom L. Phagocyte partnership during the onset and resolution of inflammation. Nat Rev Immunol. 2010;10(6):427–439. doi: 10.1038/nri2779. - DOI - PubMed
    1. Hotchkiss RS, Karl IE. The pathophysiology and treatment of sepsis. N Engl J Med. 2003;348(2):138–150. doi: 10.1056/NEJMra021333. - DOI - PubMed
    1. Tsai M, Grimbaldeston M, Galli SJ. Mast cells and immunoregulation/immunomodulation. Adv Exp Med Biol. 2011;716:186–211. doi: 10.1007/978-1-4419-9533-9_11. - DOI - PubMed
    1. Beghdadi W, et al. Mast cells as cellular sensors in inflammation and immunity. Front Immunol. 2011;2:37. - PMC - PubMed
    1. Chan CY, St John AL, Abraham SN. Mast cell interleukin-10 drives localized tolerance in chronic bladder infection. Immunity. 2013;38(2):349–359. doi: 10.1016/j.immuni.2012.10.019. - DOI - PMC - PubMed

Publication types