. 2014 Oct;124(10):4305-19.
doi: 10.1172/JCI77116. Epub 2014 Sep 2.

MicroRNA-182 drives metastasis of primary sarcomas by targeting multiple genes

MicroRNA-182 drives metastasis of primary sarcomas by targeting multiple genes

Mohit Sachdeva et al. J Clin Invest. 2014 Oct.

Erratum in

Abstract

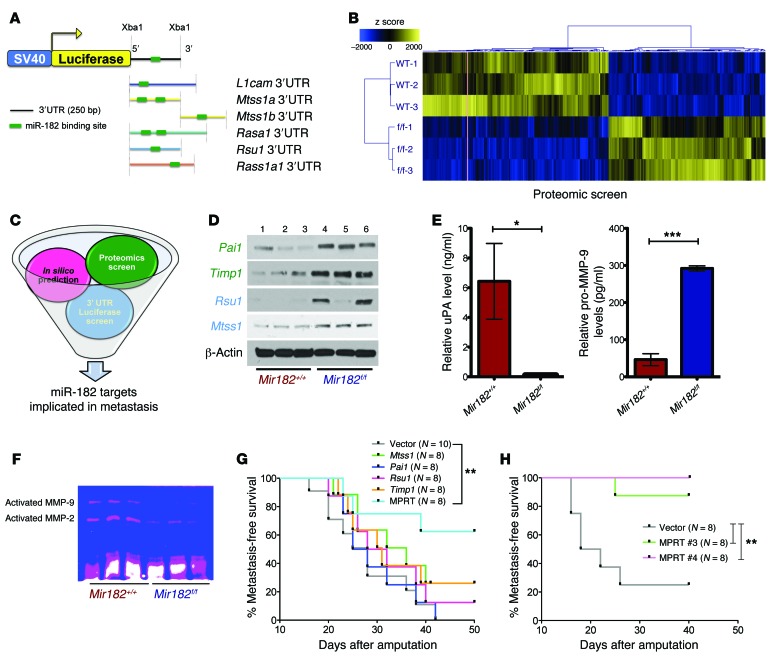
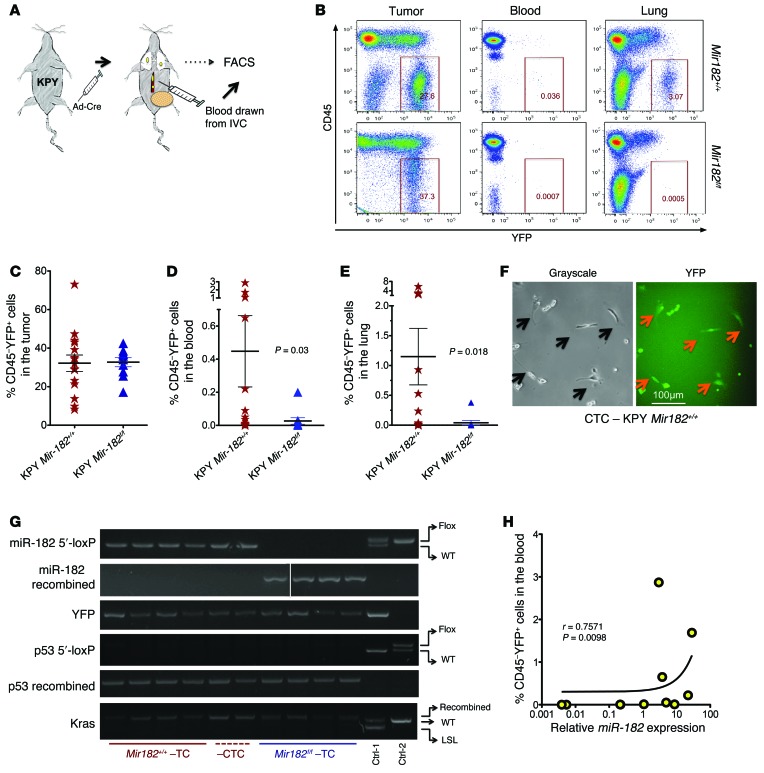
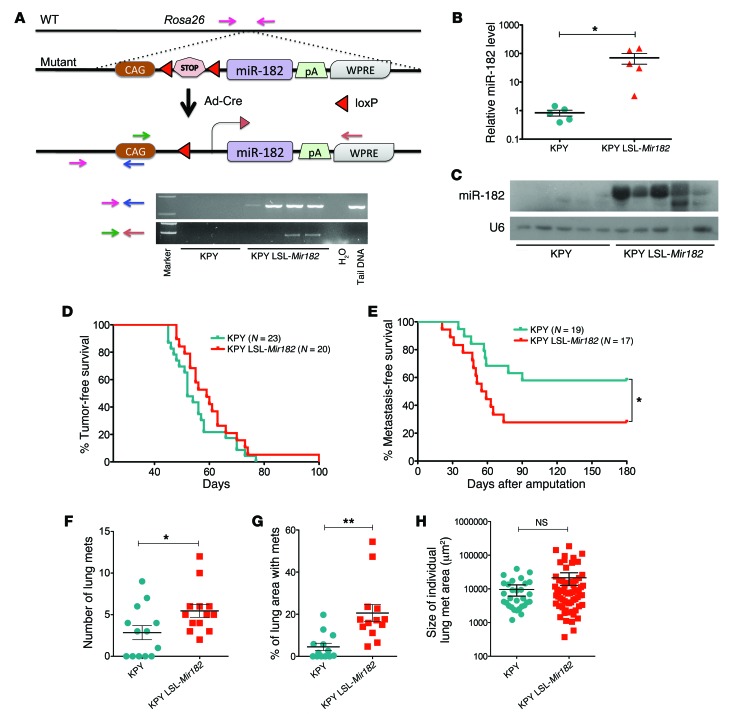
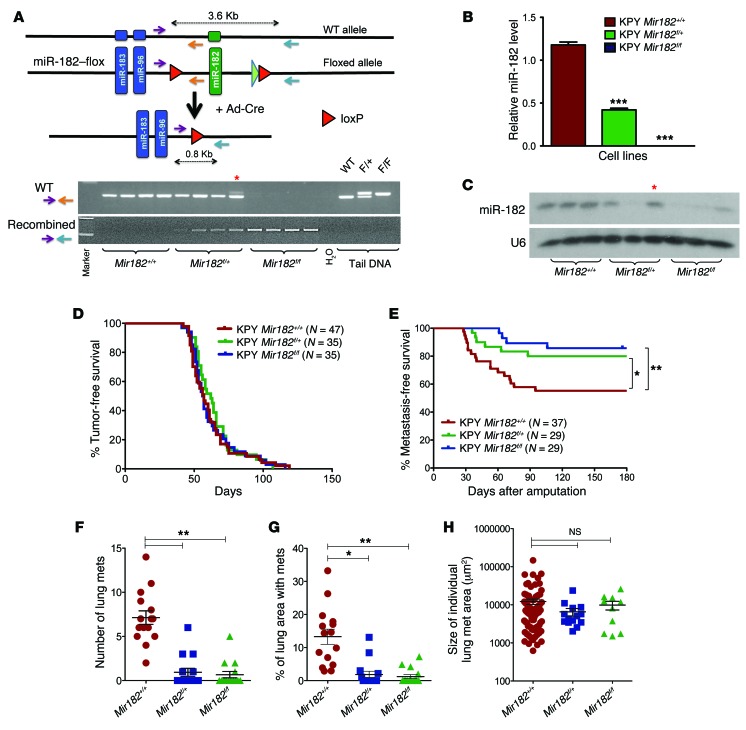
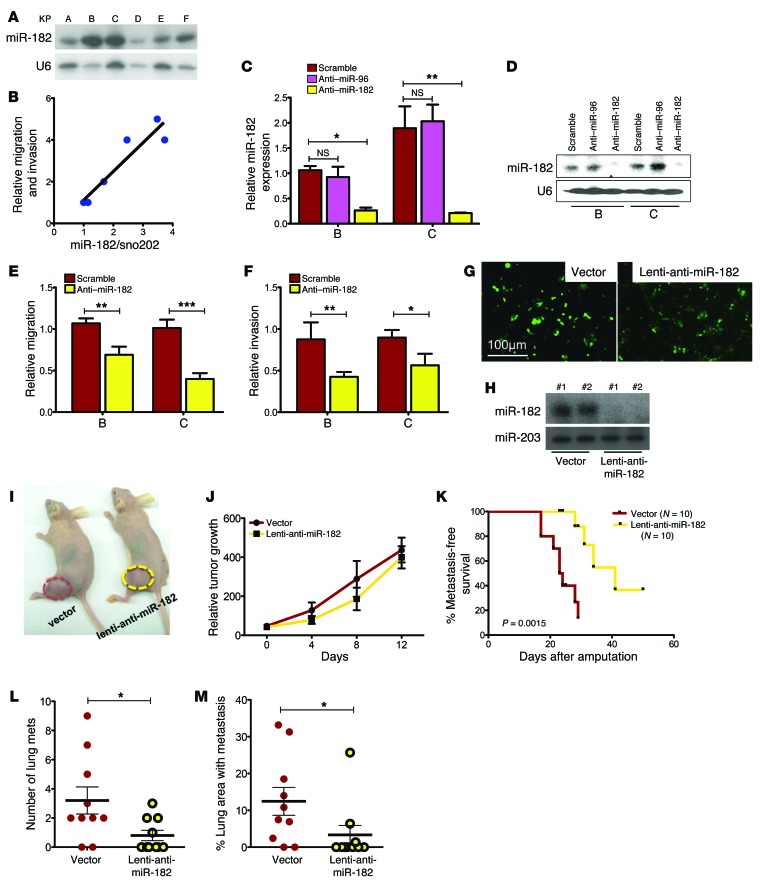
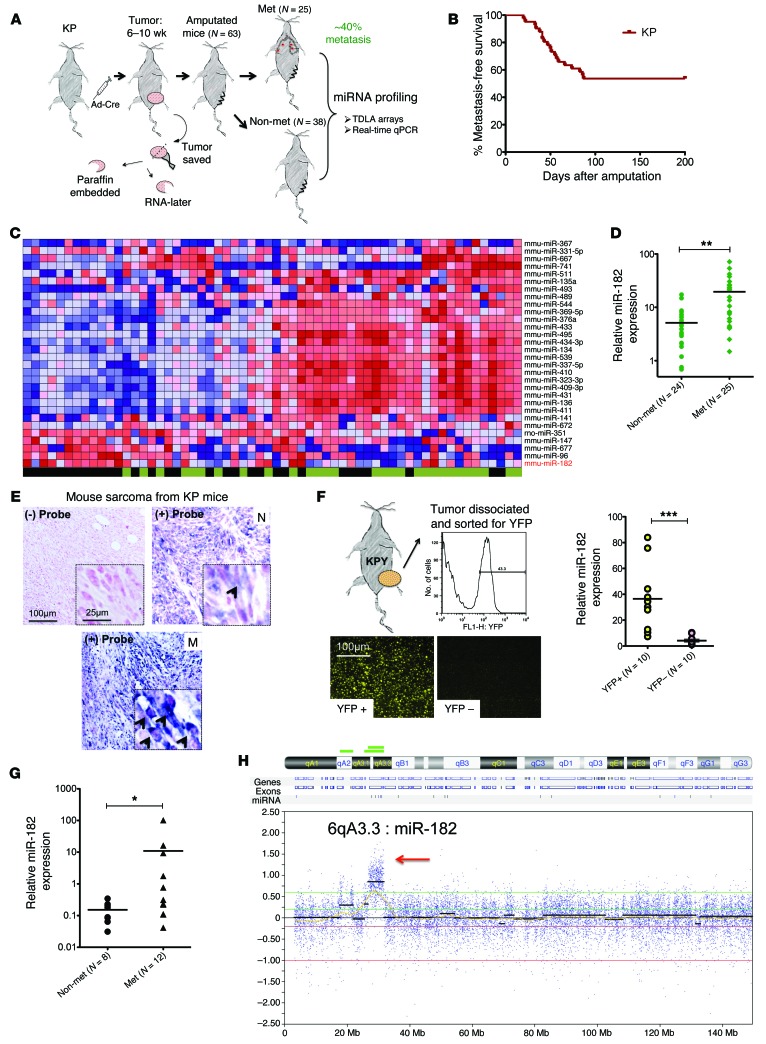
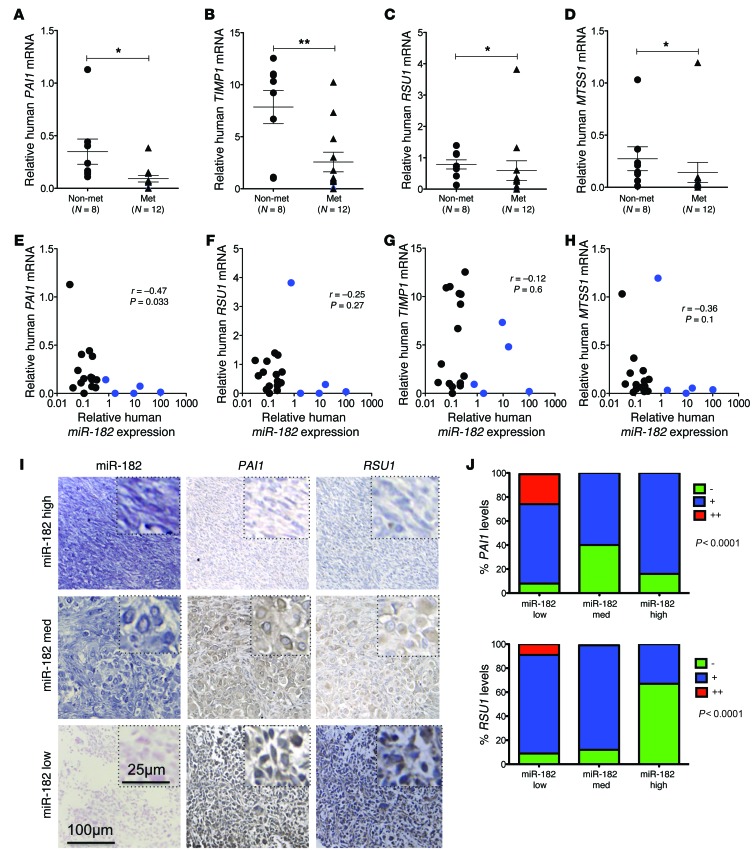
Metastasis causes most cancer deaths, but is incompletely understood. MicroRNAs can regulate metastasis, but it is not known whether a single miRNA can regulate metastasis in primary cancer models in vivo. We compared the expression of miRNAs in metastatic and nonmetastatic primary mouse sarcomas and found that microRNA-182 (miR-182) was markedly overexpressed in some tumors that metastasized to the lungs. By utilizing genetically engineered mice with either deletion of or overexpression of miR-182 in primary sarcomas, we discovered that deletion of miR-182 substantially decreased, while overexpression of miR-182 considerably increased, the rate of lung metastasis after amputation of the tumor-bearing limb. Additionally, deletion of miR-182 decreased circulating tumor cells (CTCs), while overexpression of miR-182 increased CTCs, suggesting that miR-182 regulates intravasation of cancer cells into the circulation. We identified 4 miR-182 targets that inhibit either the migration of tumor cells or the degradation of the extracellular matrix. Notably, restoration of any of these targets in isolation did not alter the metastatic potential of sarcoma cells injected orthotopically, but the simultaneous restoration of all 4 targets together substantially decreased the number of metastases. These results demonstrate that a single miRNA can regulate metastasis of primary tumors in vivo by coordinated regulation of multiple genes.


Figures

Figure 6
Figure 6. miR-182 target genes cooperate to regulate metastasis.
(A) In silico/3′ UTR luciferase screen used to predict miR-182 targets (top panel) and number of putative miR-182–binding sites on respective 3′ UTRs of the different genes. (B) Heat map shows differential expression of approximately 400 proteins between miR-182 WT and miR-182 deleted primary sarcoma cells from a proteomic screen. (C) Schematic shows the different approaches used to identify miR-182 target genes implicated in metastasis. (D) Western blot validates upregulation of Pai1, Timp1, Rsu1, and Mtss1 in miR-182–deleted KP cells (1–3, different KPY Mir182 WT; 4–6, different KPY Mir182f/f cell lines). (E) ELISA validates decreased uPA and increased unprocessed pro–MMP-9 in the cell-culture media from miR-182–deleted primary sarcoma cells. (F) Zymography confirms decreased activation of MMP-2 and MMP-9 in the cell-culture media from miR-182–deleted KP cells. (G and H) Kaplan-Meier curves show that ectopic expression of all 4 miR-182 targets together (H), but not individual targets alone (G) are required to rescue miR-182–mediated metastasis in an orthotopic metastasis assay. Mice were euthanized 40 days following amputation. Five mice had microscopic lung nodules despite having no clinical evidence of metastasis (Supplemental Figure 13G). MPRT, cell line expressing all 4 miR-182 targets, i.e., Mtss1, Pai1, Rsu1, and Timp1. Two-tailed Student’s t test and 1-way ANOVA were used for statistical analysis. All data are mean ± SEM. *P < 0.05; **P < 0.01; ***P < 0.005.
Figure 5
Figure 5. Deletion of miR-182 decreases intravasation of sarcoma cells into the circulation.
(A) Schematic showing the study design for isolation and analysis of YFP+ CTCs in the blood. (B) Flow cytometry reveals significantly lower number of YFP+ cells in both the blood and lung after miR-182 deletion. (C) No change in YFP+ cells in primary tumors between the 2 genotypes. (D and E) Quantification of CD45YFP+ cells within the blood and the lungs between the 2 genotypes. (F) Images show the morphology of isolated YFP+ sarcoma cells from the blood. (G) PCR demonstrates that isolated CD45YFP+ cells have successfully recombined LSL-Kras, deleted p53, and recombined LSL-YFP. TC, tumor cells. (H) Number of YFP+ cells in the blood correlates with the level of miR-182 in the primary sarcoma in KPY mice. Two-tailed Student’s t test and Fisher’s exact test were used for statistical analysis. All data are mean ± SEM. Scale bars: 100 μm.
Figure 4
Figure 4. miR-182 overexpression increases the rate of sarcoma metastasis to the lungs.
(A) Schematic showing transgenic mice with conditional overexpression of miR-182 (top panel) and PCR to show Cre-mediated excision of the STOP cassette by Cre in primary KP sarcomas (bottom panel). (B) RT-PCR and (C) Northern blot validates significant overexpression of miR-182 in primary sarcoma cells from miR-182–overexpressor KP mice. (D) No change in tumor onset in primary sarcomas from KPY LSL-Mir182 mice. (E) Overexpression of miR-182 in primary sarcomas increases the rate of lung metastasis (Mantel-Cox log-rank test), *P < 0.05. (F) Quantification of the number of lung metastases, (G) percentage of lung area with metastasis, and (H) size of individual metastatic nodules between the 2 genotypes. Two-tailed Student’s t test is used for the statistical analysis. All data are mean ± SEM. *P < 0.05; **P < 0.01.
Figure 3
Figure 3. miR-182 deletion decreases the rate of sarcoma metastasis to the lungs.
(A) Schematic showing deletion of miR-182 by Ad-Cre (top panel) and PCR to show Cre-mediated excision of recombined allele from primary KP sarcomas (bottom panel). Asterisk denotes the only sample (1/25) with partial recombination of the miR-182–flox allele. (B) RT-PCR and (C) Northern blot validates deletion of miR-182 in primary sarcoma cells from KPY Mir182 mice. Asterisk denotes the only sample (1/25) with partial recombination of the miR-182–flox allele. (D) No significant change in tumor onset was observed. (E) Deleting miR-182 in primary sarcomas in mice decreases the rate of lung metastasis (Mantel-Cox log-rank test). (F) Quantification of the number of lung metastases, (G) percentage of lung area with metastasis, and (H) size of individual metastatic nodules among different genotypes. One-way Anova was used for statistical analysis. All data are mean ± SEM. *P < 0.05; **P < 0.01; ***P < 0.005.
Figure 2
Figure 2. Change in miR-182 levels modulates cell migration and invasion in primary mouse sarcoma cell lines.
(A) Northern blot detects miR-182 in multiple primary sarcoma cell lines from KP mice. (B) Levels of miR-182 in cells correlates with the relative migration and invasion ability of these KP cells. Average of migration and invasion index was plotted on the y axis. (C) Real-time RT-PCR and (D) Northern blot validates knockdown of miR-182 in KP cell lines B and C by an anti–miR-182 oligo. (E) Knockdown of miR-182 in B and C decreases migration and (F) invasion (n = 6 independent experiments). (G) Stably transduced cell line A with anti–miR-182 lentiviral construct. (H) Northern blot validates stable knockdown of miR-182 in 2 different clones. (I and J) Stable knockdown of miR-182 does not affect orthotopic tumor growth in nude mice, but prevents lung metastasis after surgical resection of the orthotopic tumor, as shown in a Kaplan-Meier plot (K) (Mantel-Cox log-rank test). (L) Quantification of the number of lung metastases and (M) percentage of lung area with metastasis shows significant difference between the 2 genotypes. One-way ANOVA (C, E, and F) and 2-tailed Student’s t test (L and M) were used for statistical analysis. All data are mean ± SEM. Scale bars: 100 μm. *P < 0.05; **P < 0.01; ***P < 0.005.
Figure 1
Figure 1. miR-182 is elevated in a subset of metastatic sarcomas.
(A) Schematic showing amputation strategy used to study metastasis in KP mice. (B) Kaplan-Meier curve showing metastasis-free survival in KP mice. (C) Heat map showing differential expression of miRNAs between nonmetastatic and metastatic primary mouse sarcomas using miRNA TLDA array (blue color, low expression; red color, high expression; green color, nonmetastatic [nonmet]; black color, metastatic [met]). (D) Validation of elevated miR-182 expression in primary mouse STS measured by real-time RT-PCR. (E) ISH detects miR-182 expression in primary metastatic (M), but not in nonmetastatic (N) sarcomas from KP mice (blue, miR-182–digoxigenin probe (arrows); pink, Nuclear Fast Red). (F) Primary tumors from KPY mice were dissociated and then sorted for YFP-positive and -negative cells. RNA was then extracted from those cells, and miR-182 expression was analyzed using qRT-PCR. miR-182 expression was specific to YFP-expressing sarcoma cells, but not to YFP-negative cells. (G) Elevated miR-182 expression in primary human STS measured by real time RT-PCR. (H) Comparative genomic hybridization shows amplification of miR-182 locus, 6qA3.3, in primary mouse sarcomas with known metastatic outcome. Two-tailed Student’s t test was used for statistical analysis in DG. All data are mean ± SEM. Scale bars: 100 μm (E and F); 25 μm (E, insets). *P < 0.05; **P < 0.01; ***P < 0.005.
Figure 7
Figure 7. Decreased expression of miR-182 target genes in primary human metastatic sarcomas.
(AD) Decreased PAI1, TIMP1, RSU1, and MTSS1 mRNA expression in primary human STS measured by real-time RT-PCR. (EH) miR-182 levels negatively correlate with mRNA levels of PAI1, TIMP1, RSU1, and MTSS1 in primary human sarcomas. The metastatic human sarcomas with high miR-182 expression are denoted in blue circles, and these colored samples are followed through parts AD to correlate miR-182 expression with the level of its targets. (I) Expression of miR-182, PAI1 and RSU1 in matched human sarcoma specimens. (No immunostaining was observed for MTSS1 and TIMP1 on human TMAs). (J) Quantification of immunostaining. Mann-Whitney test was used for statistical analysis (AD). Spearman R correlation test was used for statistical analysis (E and F). Fisher’s exact test was used for statistical analysis (J). All data are mean ± SEM. Scale bars: 100 μm (I); 25 μm (I, insets). *P < 0.05; **P < 0.01.

References

    1. Lyman GH, Djulbegovic B. The challenge of systematic reviews of diagnostic and staging studies in cancer. Cancer Treat Rev. 2005;31(8):628–639. doi: 10.1016/j.ctrv.2005.07.001. - DOI - PubMed
    1. Nguyen DX, Bos PD, Massague J. Metastasis: from dissemination to organ-specific colonization. Nat Rev Cancer. 2009;9(4):274–284. doi: 10.1038/nrc2622. - DOI - PubMed
    1. Ambros V. microRNAs: tiny regulators with great potential. Cell. 2001;107(7):823–826. doi: 10.1016/S0092-8674(01)00616-X. - DOI - PubMed
    1. Bartel DP. MicroRNAs: genomics, biogenesis, mechanism, and function. Cell. 2004;116(2):281–297. doi: 10.1016/S0092-8674(04)00045-5. - DOI - PubMed
    1. White NM, Fatoohi E, Metias M, Jung K, Stephan C, Yousef GM. Metastamirs: a stepping stone towards improved cancer management. Nat Rev Clin Oncol. 2011;8(2):75–84. doi: 10.1038/nrclinonc.2010.173. - DOI - PubMed

Publication types