. 2014 Sep 2;9(9):e106133.
doi: 10.1371/journal.pone.0106133. eCollection 2014.

Functional reorganization of the default mode network across chronic pain conditions

Affiliations

Functional reorganization of the default mode network across chronic pain conditions

Marwan N Baliki et al. PLoS One. .

Abstract

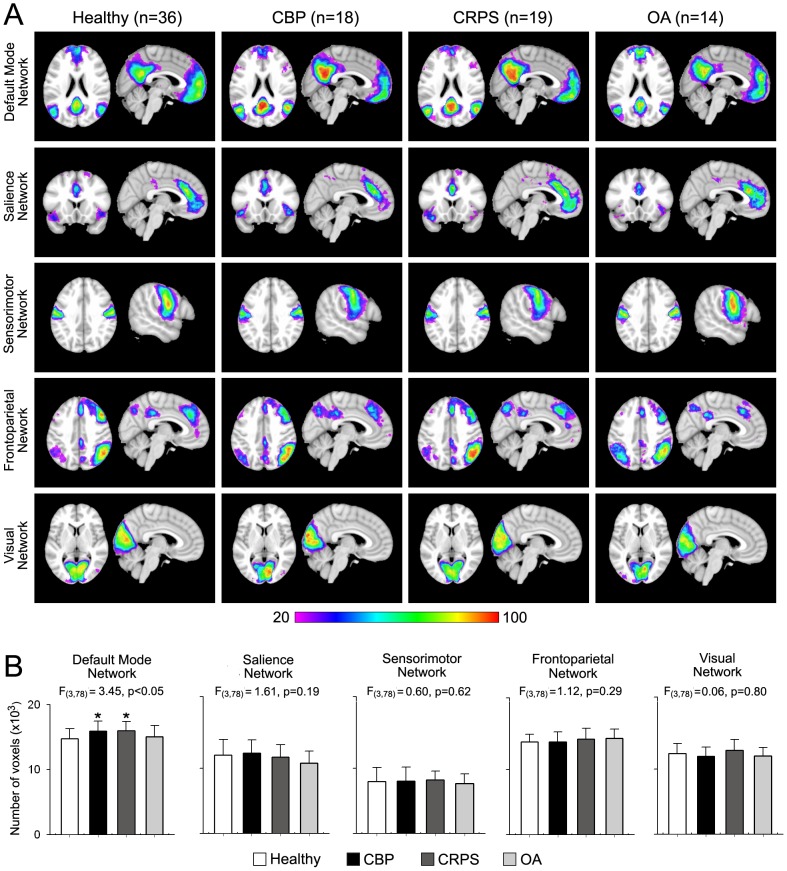
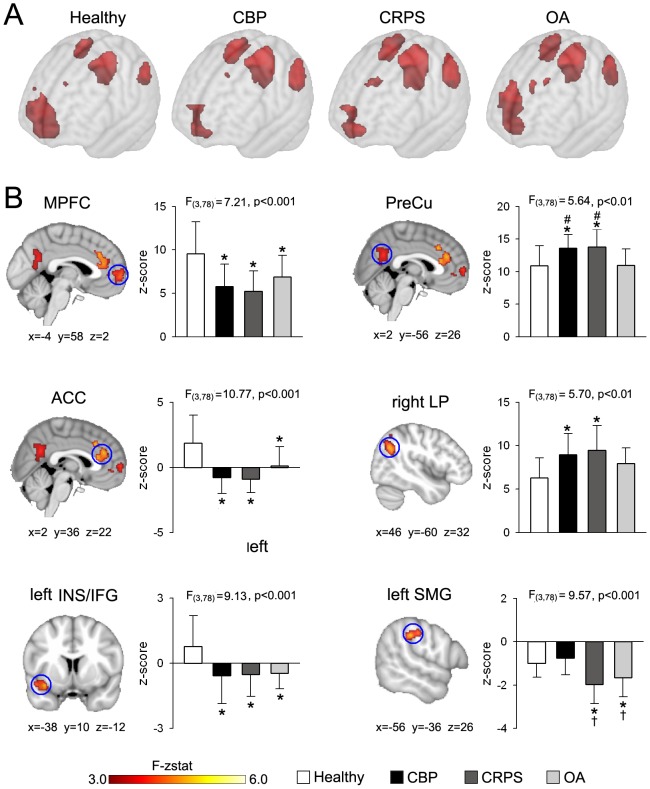
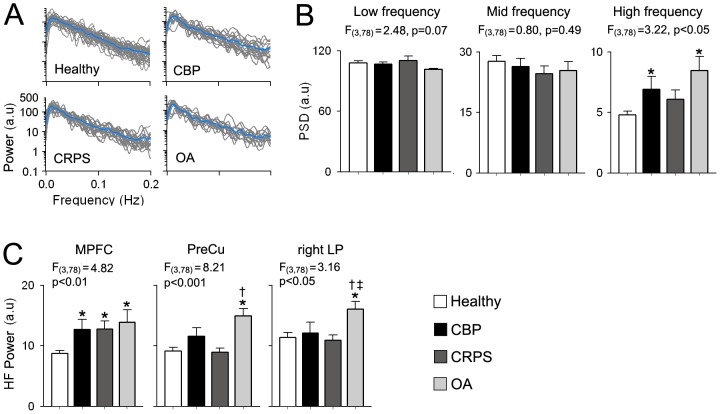
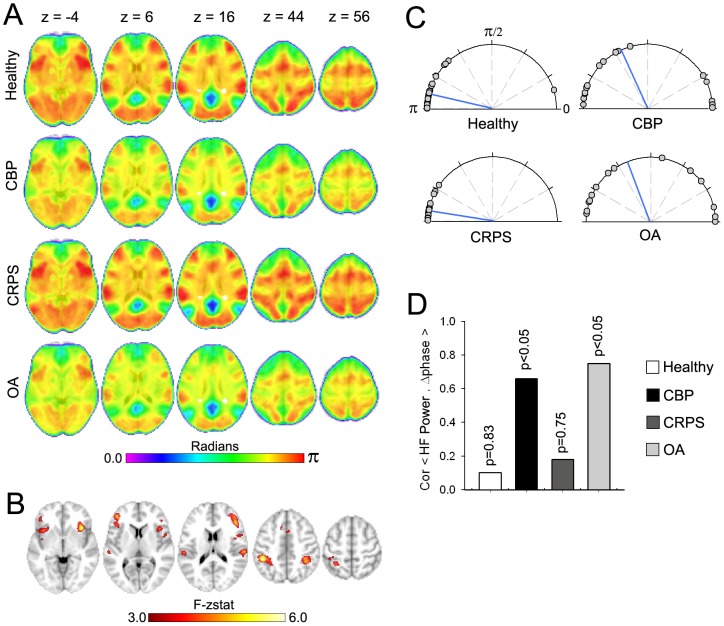
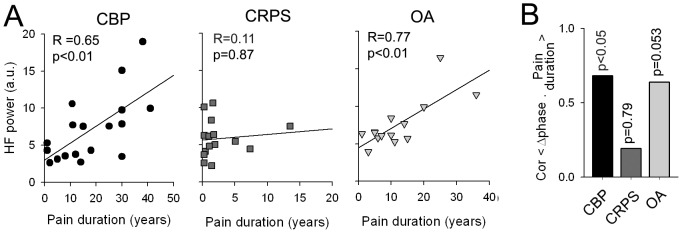
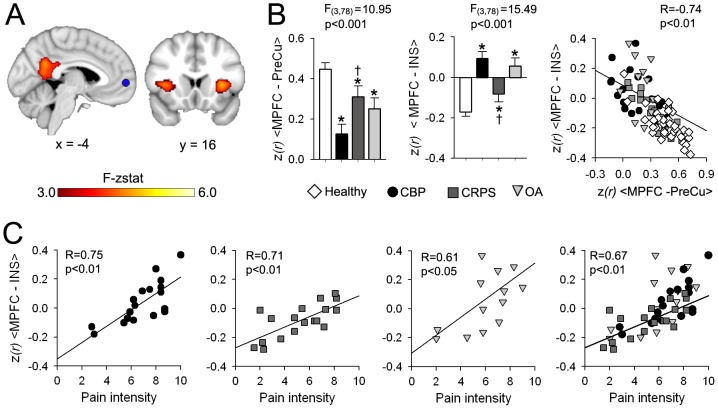
Chronic pain is associated with neuronal plasticity. Here we use resting-state functional magnetic resonance imaging to investigate functional changes in patients suffering from chronic back pain (CBP), complex regional pain syndrome (CRPS) and knee osteoarthritis (OA). We isolated five meaningful resting-state networks across the groups, of which only the default mode network (DMN) exhibited deviations from healthy controls. All patient groups showed decreased connectivity of medial prefrontal cortex (MPFC) to the posterior constituents of the DMN, and increased connectivity to the insular cortex in proportion to the intensity of pain. Multiple DMN regions, especially the MPFC, exhibited increased high frequency oscillations, conjoined with decreased phase locking with parietal regions involved in processing attention. Both phase and frequency changes correlated to pain duration in OA and CBP patients. Thus chronic pain seems to reorganize the dynamics of the DMN and as such reflect the maladaptive physiology of different types of chronic pain.


Conflict of interest statement

Competing Interests: The authors are not aware of any competing interests of the anonymous donor in relation to this work and do not consider the identity of the donor to be relevant to the editors or reviewers' assessment of the validity of this study.

Figures

Figure 1
Figure 1. Spatial properties of resting state networks in three chronic pain patient groups and in healthy controls.
(A) Percent spatial overlap of five resting state networks (RSNs) for healthy and pain patient groups. Colors represent percentage of subjects whose best fit component overlap at each voxel. Red denotes much overlap, while purple denotes little overlap. Overall, All RSNs show similar spatial representation across all groups with the exception of the default mode network (DMN), which exhibits larger overlap in the precuneus and posterior cingulate and less overlap in medial prefrontal cortex for CBP and CRPS groups. (B) Mean ± S.E.M. of number of voxels (z-score >3.0) of each RSN. The DMN is the only RSN that differs in size across groups (F3,78 = 3.45, p<0.05), with the CBP and CRPS groups having a larger DMN compared to controls (Post hoc test, *p<0.05 vs controls).
Figure 2
Figure 2. The DMN exhibits divergent connectivity properties across chronic pain patient groups.
(A) Brain maps show the group average spatial representaion of the DMN for all groups (average map thresholed at z-score >4.0). CBP and CRPS patients show decreased MPFC and increased PreCu and left and right LP representaion within the DMN compared to healthy subjects. (B) Maps illustrate clusters of significantly different connectivity for the DMN using a whole-brain voxelwise ANOVA (mixed effects analysis, f-zscore >3.0, corrected for multiple comparisons by cluster threshold p<0.01). All patient groups show decreased connectivity in MPFC (F3,78 = 7.21, p<0.001), ACC (F3,78 = 10.77, p<0.001), and left anterior INS/IFG (F3,78 = 9.13, p<0.001). CBP and CRPS subjects display increased connectivity in PreCu (F3,78 = 5.64, p<0.01), compared to healthy controls and OA patients, and in right LP (F3,78 = 5.70, p<0.01) compared to healthy controls. In addition, the left SMG exhibits stronger negative connectivity in CRPS and OA groups, than in CBP and control subjects (F3,78 = 9.57, p<0.001). Bars represent mean ± S.E.M. of normalized connectivity strength (Post hoc test: *p<0.05 vs healthy; †p<0.05 vs CBP; ‡p<0.05 vs CRPS; #p<0.05 vs OA).
Figure 3
Figure 3. The DMN shows chronic pain type specific increased high frequency oscillations.
(A) Individual power spectra for the DMN BOLD oscillations superimposed separately for each group. Blue traces represent group averages. (B) Bar graphs show the mean ± S.E.M. power from the DMN time courses for the low (0.01–0.05 Hz), mid (0.05–0.12 Hz) and high (0.12–0.2 Hz) frequency bands. CBP and OA patients exhibit increase in power for the high frequency (HF) band compared to controls (F3,78 = 3.22, p<0.05, corrected for gender and age). (C) Regions within the DMN show differential changes in HF power. All patient groups show increased HF power in MPFC (F3,78 = 4.78, p<0.01) compared to healthy controls. On the other hand, only OA patients show increases in HF power in PreCu (F3,78 = 8.21, p<0.001) compared to CRPS patients and controls and in right LP (F3,78 = 3.16, p<0.05) compared to all groups. (Post hoc test: *p<0.05 vs healthy; †p<0.05 vs CBP; ‡p<0.05 vs CRPS; #p<0.05 vs OA).
Figure 4
Figure 4. The DMN shows chronic pain type specific changes in phase properties.
(A) Brain maps show the group voxelwise average phase differences (Δphase) between the DMN time course and all other brain voxels. Blue-green areas represent smaller phase differences while yellow-red represents greater phase differences. In general CBP and OA patients exhibited decreased phase differences, compared to healthy subjects and CRPS patients. (B) Brain map illustrates clusters of significantly different phase relationship to the DMN, using a whole-brain voxelwise ANOVA (mixed effects analysis, f-zscore >3.0, corrected for multiple comparisons by cluster threshold p<0.01). The DMN in patients show changes in phase relationships to regions within the frontoparietal network inculding bilateral IPS, and FEF in addition to the right DLPFC, and to regions within the salience network including ACC and bilateral anterior and posterior insula. (C) Compass plots show the individual absolute phase differences (Δphase) between the DMN and the network identified in B for all groups. Watson-Williams test for circular data reveals a significant difference of mean phase across groups (F3,78 = 7.45, p<0.01). Blue lines represent the circular mean. (D) Correlation between Δphase and DMN HF Power. Only CBP and OA patients show a significant relationship.
Figure 5
Figure 5. DMN spectral power and phase changes are related to pain duration in specific patient groups.
(A) The DMN high frequency spectral power shows significant positive correlation to pain duration in CBP (R = 0.65, p<0.01) and OA (R = 0.77, p<0.01), but not in CRPS (R = 0.11, p = 0.87). (B) Phase differences between the DMN and frontoparietal network shows high correlation to pain duration in CBP (R = 0.68, p<0.05), a positive trend in OA (R = 0.64, p = 0.053) and no correlation in CRPS (R = 0.19, p = 0.79). Note pain duration is significanlty less in CRPS, than in CBP (t-value  = −4.56, p<0.01) and OA (t-value  = −3.34, p<0.01).
Figure 6
Figure 6. MPFC exhibits connectivity changes in proportion to intensity of pain.
(A) Brain map illustrates regions showing significantly different correlation to the MPFC across all groups using a whole-brain voxelwise ANCOVA corrected for age and gender(mixed effects analysis, f-zscore >3.0, corrected for multiple comparisons by cluster threshold p<0.01). Differences in MPFC connectivity between groups were restricted to the bilateral anterior INS and PreCu. (B) Bar graphs show the mean ± S.E.M. normalized correlation (z(r)) for MPFC-PreCu and MPFC-INS for all groups. All patients show significant decrease in MPFC-PreCu corelletion (F3,78 = 7.18, p<0.001, corrected for gender and age) and increase in MPFC-INS correlation (F3,78 = 8.38, p<0.001). In addition, CBP patients showed lower MPFC-PreCu and higher MPFC-INS compared to CRPS patients. Right scatter plot shows the relationship between MPFC-INS and MPFC-PreCu association. Increase in the MPFC-INS correlation was inversly related to MPFC-DMN connectivity across all subjects (R = −0.74, p<01). (C) MPFC-INS connectivity showed high correlation to pain intesity in CBP (R = 0.75, p<0.01), CRPS (R = 0.71, p<0.01) and OA (R = 0.61, p<0.05). This correlation was maintaintended when examined across all patient groups (R = 0.67, p<0.01). (Post hoc test: *p<0.05 vs healthy; †p<0.05 vs CBP).

References

    1. Apkarian AV, Hashmi JA, Baliki MN (2011) Pain and the brain: Specificity and plasticity of the brain in clinical chronic pain. Pain 152: s49–s64. - PMC - PubMed
    1. Tracey I, Bushnell MC (2009) How neuroimaging studies have challenged us to rethink: is chronic pain a disease? J Pain 10: 1113–1120. - PubMed
    1. Fox MD, Snyder AZ, Vincent JL, Raichle ME (2007) Intrinsic fluctuations within cortical systems account for intertrial variability in human behavior. Neuron 56: 171–184. - PubMed
    1. Raichle ME, Mintun MA (2006) Brain work and brain imaging. AnnuRevNeurosci 29: 449–476. - PubMed
    1. Tagliazucchi E, Balenzuela P, Fraiman D, Chialvo DR (2010) Brain resting state is disrupted in chronic back pain patients. Neurosci Lett. - PMC - PubMed

Publication types