. 2014 Sep 2;9(9):e104416.
doi: 10.1371/journal.pone.0104416. eCollection 2014.

Oral microbiome link to neurodegeneration in glaucoma

Affiliations

Oral microbiome link to neurodegeneration in glaucoma

Konstantin Astafurov et al. PLoS One. .

Abstract

Background: Glaucoma is a progressive optic nerve degenerative disease that often leads to blindness. Local inflammatory responses are implicated in the pathology of glaucoma. Although inflammatory episodes outside the CNS, such as those due to acute systemic infections, have been linked to central neurodegeneration, they do not appear to be relevant to glaucoma. Based on clinical observations, we hypothesized that chronic subclinical peripheral inflammation contributes to neurodegeneration in glaucoma.

Methods: Mouthwash specimens from patients with glaucoma and control subjects were analyzed for the amount of bacteria. To determine a possible pathogenic mechanism, low-dose subcutaneous lipopolysaccharide (LPS) was administered in two separate animal models of glaucoma. Glaucomatous neurodegeneration was assessed in the retina and optic nerve two months later. Changes in gene expression of toll-like receptor 4 (TLR4) signaling pathway and complement as well as changes in microglial numbers and morphology were analyzed in the retina and optic nerve. The effect of pharmacologic blockade of TLR4 with naloxone was determined.

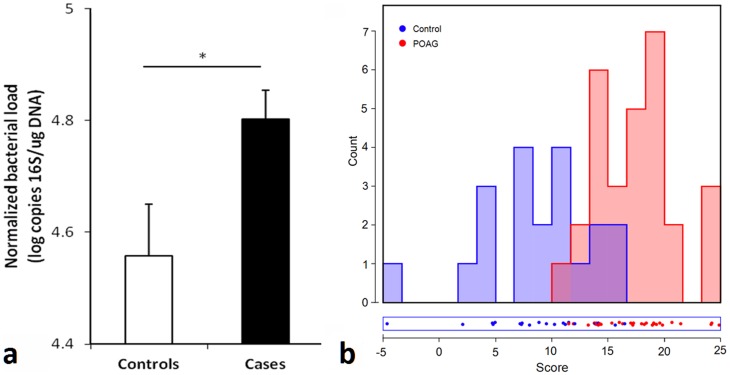
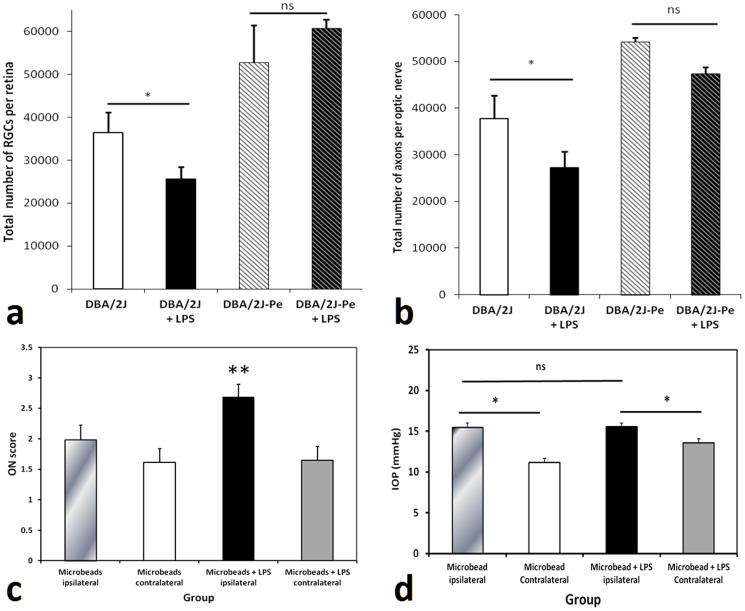
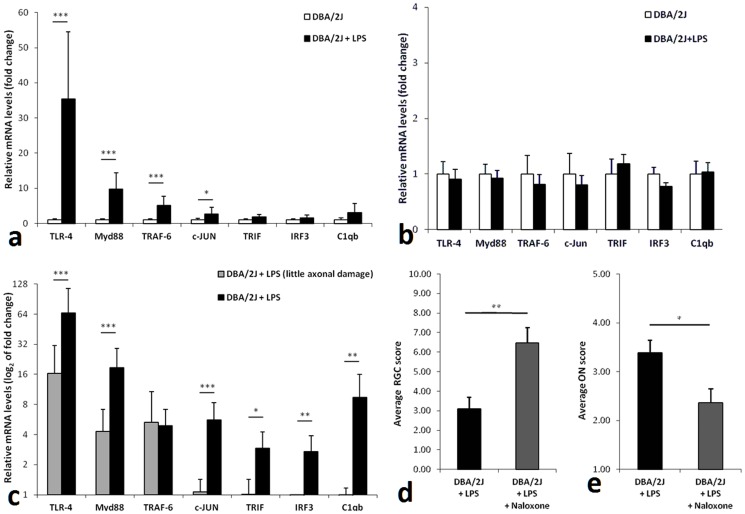
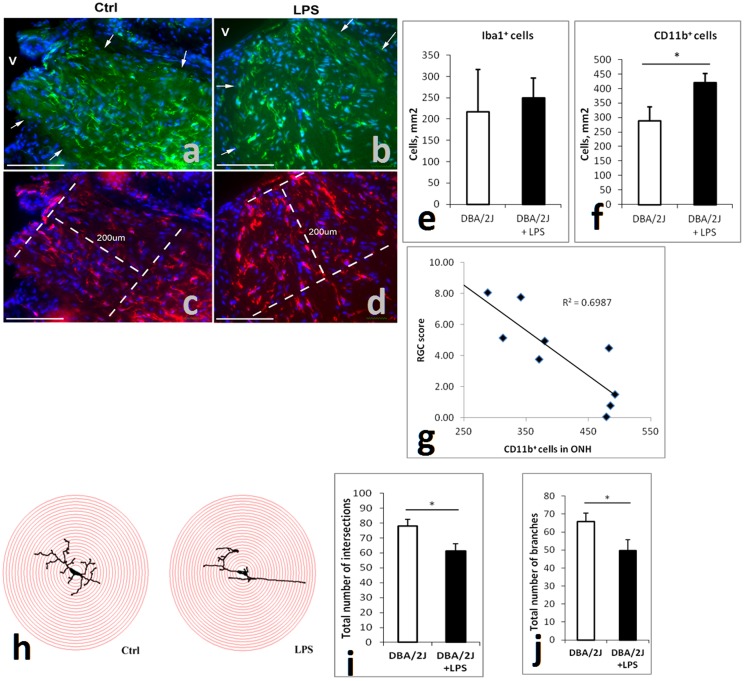
Findings: Patients with glaucoma had higher bacterial oral counts compared to control subjects (p<0.017). Low-dose LPS administration in glaucoma animal models resulted in enhancement of axonal degeneration and neuronal loss. Microglial activation in the optic nerve and retina as well as upregulation of TLR4 signaling and complement system were observed. Pharmacologic blockade of TLR4 partially ameliorated the enhanced damage.

Conclusions: The above findings suggest that the oral microbiome contributes to glaucoma pathophysiology. A plausible mechanism by which increased bacterial loads can lead to neurodegeneration is provided by experiments in animal models of the disease and involves activation of microglia in the retina and optic nerve, mediated through TLR4 signaling and complement upregulation. The finding that commensal bacteria may play a role in the development and/or progression of glaucomatous pathology may also be relevant to other chronic neurodegenerative disorders.


Conflict of interest statement

Competing Interests: The authors have declared that no competing interests exist.

Figures

Figure 1
Figure 1. Difference in oral bacterial load in African-American patients with and without glaucoma.
a) Normalized oral bacterial load (NOBL) of patients with and without glaucoma (p<0.017, t-test). Although cases were significantly different from controls in age (p<0.008, t-test), gender (p<0.02 Chi-square) and diabetes status (p<0.021, Chi square), GLM ANOVA of NOBLs (using group, gender, diabetes status and age [above or below median value] as independent variables) revealed a significant effect of group status (whether a subject belonged to cases or controls) only (p<0.024) while all other parameters did not show a statistically significant effect (p>0.26 for all). Linear regression of NOBL with age revealed a significant but low correlation (p<0.011, R2 = 0.063).b) Linear discriminant analysis of DNA amounts from various bacterial families normalized by the amount of total DNA in each sample. Cases are different from controls (MANOVA, p<0.001).
Figure 2
Figure 2. Peripheral LPS administration significantly accelerates glaucomatous pathology in DBA/2J mice (but not in DBA/2J-Pe mice) as well as in the microbead-induced IOP elevation model of glaucoma in C57BL/6 mice.
LPS (60 µg) was injected into one hind footpad of 6-month old male DBA/2J and DBA/2J-Pe mice and retinal and optic nerve damage was assessed at 8 months of age. (a) Computer-assisted counts of total RGCs per retina (n = 18 and n = 24 retinas for DBA/2J and DBA/2J+LPS, respectively; n = 4 and n = 10 retinas for DBA/2J-Pe and DBA/2J-Pe+LPS, respectively). (b) Semi-automated total optic nerve axon counts, n = 9 and n = 19 optic nerves for DBA/2J and DBA/2J+LPS, respectively; n = 4 and n = 11 optic nerves for DBA/2J-Pe and DBA/2J-Pe+LPS respectively. The same amount of LPS (60 µg) or vehicle was also administered to male C57BL/6 mice that were (n = 16) or were not (n = 13) subjected to unilateral microbead-induced IOP elevation. optic nerve damage was assessed 2 months later. (c) Semi-quantitative optic nerve damage score in eyes of microbead-treated C57BL/6 animals. (d) Average IOP of eyes of microbead-treated C57BL/6 animals. Data are presented as mean ± SEM. Statistical differences were assessed by one-way ANOVA, followed by Tukey-Kramer post-hoc testing (*p<0.05, **p<0.01, ns>0.05).
Figure 3
Figure 3. LPS induces up-regulation of TLR4 pathway and complement system genes in the retina but not in the brain of DBA/2J mice.
Treatment with naloxone ameliorates both optic nerve axon and RGC loss. (a) qPCR analysis of relative mRNA levels of genes in the TLR pathways in retinas (n = 9) of LPS-treated mice compared to those of control mice (n = 9) (mRNA levels in control retinas were set at one). (b) Analysis of relative gene expression of the same genes in the brains of the same control and experimental mice. (c) Analysis of TLR and complement gene expression in retinas of LPS-treated mice segregated into two groups according to the extent of damage in the optic nerve: samples from “DBA/2J+LPS” group (n = 5) had significant axon loss, whereas samples from “DBA/2J+LPS (little axonal damage)” (n = 4) had only a small degree of axon loss (comparable to that of non-LPS treated male DBA2/J animals). (d) Analysis of RGC survival in eyes from LPS and naloxone (n = 16) and LPS only treated (n = 21) animals, using semi-quantitative scoring. (e) optic nerve scores of eyes from LPS and naloxone (n = 14) and LPS only (n = 15) treated animals using semi-quantitative assessment. Data were tested for statistical differences between groups using either one-way ANOVA followed by Tukey-Kramer post-hoc testing (multiple groups) or t-test (two groups) (*p<0.05, **p<0.01, ***p<0.001). All data are presented as mean ± SEM.
Figure 4
Figure 4. Peripheral LPS administration leads to microglial cell changes in the ONH and retina.
(a–d) Representative images of Iba1 (green)/DAPI (blue) (a,b), as well as CD11b (red)/DAPI(blue) (c,d)-stained optic nerve head tissue from DBA2/J animals treated without (a,c) or with LPS (b,d). “V” denotes location of the vitreous body. Arrows point to the junction between the optic nerve tissue and the sclera. Dashed lines outline the region where cell counts were performed. Scale bars are 100 µm. (e,f) Analysis of Iba1+ (e) and CD11b+ (f) microglial cell numbers in the proximal unmyelinated part of the ONH. Counts are average numbers from 6 and 7 LPS treated eyes and 3 and 4 controls respectively. (g) Correlation between RGC score and numbers of CD11b+ cells in the prelaminar region of the ONH of all eyes analyzed. (h) Sholl analysis of retinal microglial cells: representative images of microglial cell traces subjected to Sholl analysis with the overlaid concentric circles. (i) The total number of intersections was decreased in microglia from the retinas of LPS-treated animals (n = 8) as compared to controls (n = 6). (j) Skeleton analysis of retinal microglial cell: the retinal microglia of LPS-treated mice (n = 8 eyes) had fewer branches than that of control mice (n = 6 eyes). Assessments of statistically significant differences between groups were done using t-test (*p<0.05).

References

    1. Quigley HA, Broman AT (2006) The number of people with glaucoma worldwide in 2010 and 2020. Br J Ophthalmol 90: 262–267. - PMC - PubMed
    1. Gordon MO, Torri V, Miglior S, Beiser JA, Floriani I, et al. (2007) Validated prediction model for the development of primary open-angle glaucoma in individuals with ocular hypertension. Ophthalmology 114: 10–19. - PMC - PubMed
    1. Fingert JH (2011) Primary open-angle glaucoma genes. Eye (Lond) 25: 587–595. - PMC - PubMed
    1. Stasi K, Nagel D, Yang X, Wang RF, Ren L, et al. (2006) Complement component 1Q (C1Q) upregulation in retina of murine, primate, and human glaucomatous eyes. Invest Ophthalmol Vis Sci 47: 1024–1029. - PubMed
    1. Bosco A, Steele MR, Vetter ML (2011) Early microglia activation in a mouse model of chronic glaucoma. J Comp Neurol 519: 599–620. - PMC - PubMed

Publication types

MeSH terms