. 2014 Nov;4(11):1290-8.
doi: 10.1158/2159-8290.CD-13-0696. Epub 2014 Sep 2.

L-2-Hydroxyglutarate: an epigenetic modifier and putative oncometabolite in renal cancer

Affiliations

L-2-Hydroxyglutarate: an epigenetic modifier and putative oncometabolite in renal cancer

Eun-Hee Shim et al. Cancer Discov. 2014 Nov.

Abstract

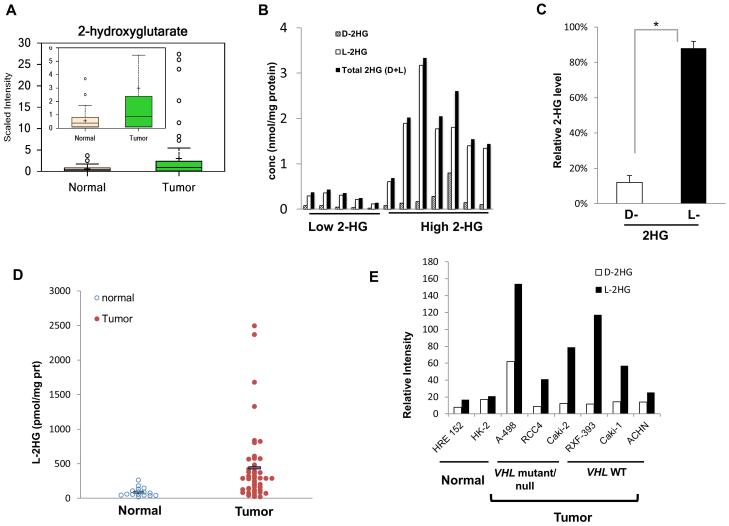
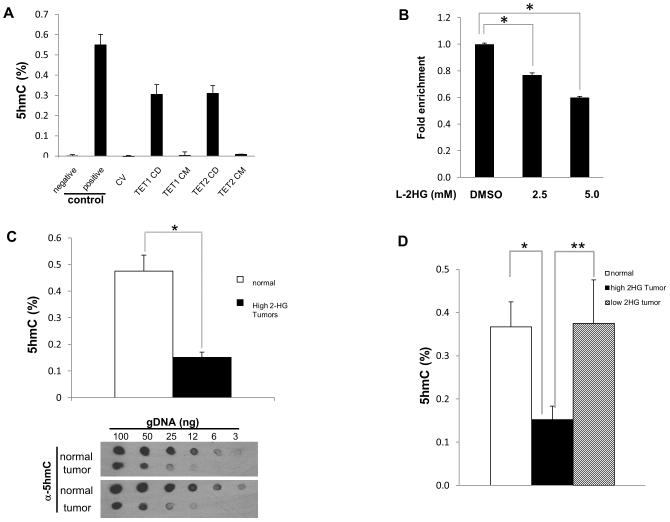
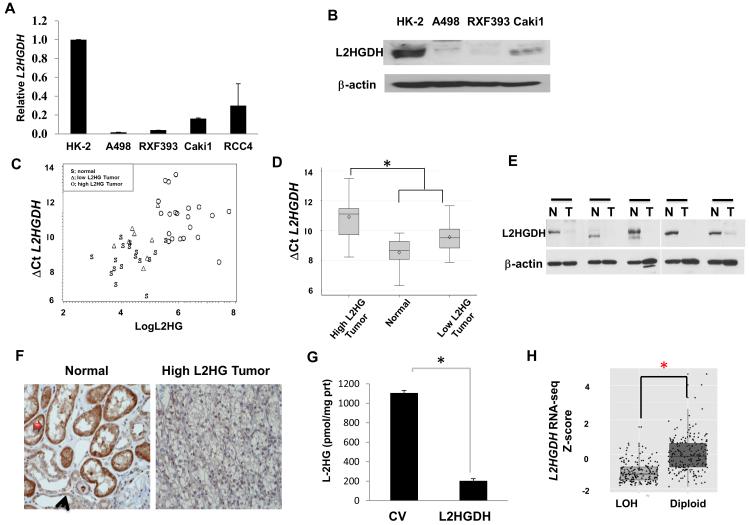
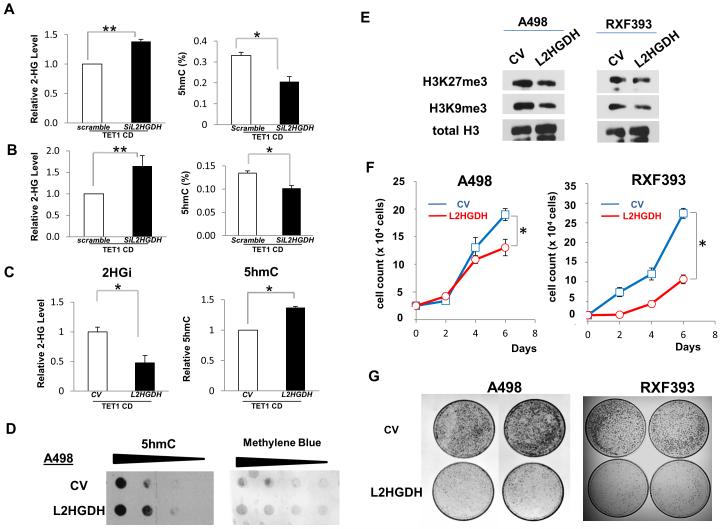
Through unbiased metabolomics, we identified elevations of the metabolite 2-hydroxyglutarate (2HG) in renal cell carcinoma (RCC). 2HG can inhibit 2-oxoglutaratre (2-OG)-dependent dioxygenases that mediate epigenetic events, including DNA and histone demethylation. 2HG accumulation, specifically the d enantiomer, can result from gain-of-function mutations of isocitrate dehydrogenase (IDH1, IDH2) found in several different tumors. In contrast, kidney tumors demonstrate elevations of the l enantiomer of 2HG (l-2HG). High-2HG tumors demonstrate reduced DNA levels of 5-hydroxymethylcytosine (5hmC), consistent with 2HG-mediated inhibition of ten-eleven translocation (TET) enzymes, which convert 5-methylcytosine (5mC) to 5hmC. l-2HG elevation is mediated in part by reduced expression of l-2HG dehydrogenase (L2HGDH). L2HGDH reconstitution in RCC cells lowers l-2HG and promotes 5hmC accumulation. In addition, L2HGDH expression in RCC cells reduces histone methylation and suppresses in vitro tumor phenotypes. Our report identifies l-2HG as an epigenetic modifier and putative oncometabolite in kidney cancer.

Significance: Here, we report elevations of the putative oncometabolite l-2HG in the most common subtype of kidney cancer and describe a novel mechanism for the regulation of DNA 5hmC levels. Our findings provide new insight into the metabolic basis for the epigenetic landscape of renal cancer.


Figures

Figure 1
Figure 1. L-2-hydroxyglutarate (L-2HG) is elevated in RCC tumors and cell lines
Human kidney samples were obtained by surgical resection and metabolites were extracted for metabolite profiling analysis by GC/MS analysis. (A) 2HG was significantly increased in primary tumor (Tumor) compared to adjacent benign kidney tissue (Normal). Inset graph present with smaller scale. (B) High and low 2HG tumors were analyzed by tandem MS to resolve the enantiomeric distribution of 2HG within these tumors. (C) Relative ratio of D-2HG and L-2HG against total 2HG in high 2HG RCC samples. Error bars represent standard error of mean. (*) p <0.05. (D) L-2HG levels were measured in another cohort of samples from a separate biorepository. (E) Enantiomeric resolution of 2HG in a panel of nontransformed and transformed lines of renal origin.
Figure 2
Figure 2. Increased L-2HG is associated with loss of 5-hmC in RCC tumors
(A) Validation of ELISA for 5hmC. HEK293 cells were transiently transfected with plasmids expressing control vector (CV), TET1 wild-type catalytic domain (CD) and mutant catalytic domain (CM), TET2 wild-type catalytic domain (CD) and mutant catalytic domain (CM). Cells were harvested and genomic DNA was examined to determine 5hmC level. (B) HK-2 renal epithelial cells were treated with L-2HG octyl ester for 4 hours and assayed for 5hmC levels via ELISA. (C) 5hmC levels between normal and high L-2HG RCC tumor samples were analyzed by ELISA (upper panel) and dot blot assay (lower panel). (D) 5hmC levels in normal, low 2HG tumors, and high 2HG tumors were determined by ELISA. Error bars represent standard error of mean. (*) p <0.005, (**) p <0.05.
Figure 3
Figure 3. L2HGDH is reduced in RCC tumors and cell lines
(A) The mRNA expression of L2HGDH in RCC lines relative to nontransformed renal epithelial cells (HK-2). (B) The protein expression of L2HGDH in RCC lines relative to nontransformed renal epithelial cells. (C and D) L2HGDH mRNA levels measured by real time RT-PCR in normal, low L-2HG tumor, and high L-2HG tumor and plotted as a function of L-2HG levels and graphically displayed. *p< 0.001. (E) High 2HG tumors and matched normal tissue were analyzed for L2HGDH protein levels by immunoblotting (T, RCC tumor; N, benign tissue). (F) Immunohistochemistry for L2HGDH in normal kidney and high L-2HG tumor. Red and black arrows denote proximal and distal tubular epithelial cells, respectively. (G) L-2HG levels were measured in A498 cells stable transduced with control vector and L2HGDH cDNA. (H) Analysis of TCGA data assessing the effects of copy loss on mRNA gene expression of L2HGDH. LOH, loss of heterozygosity. (*) p < 0.0001.
Figure 4
Figure 4. Knockdown or ectopic expression of L2HGDH is associated with changes of intracellular L-2HG concentration and DNA 5hmC level
siRNA to L2HGDH was co-transfected with TET1 catalytic domain (CD) in HK-2 cells (A) and HEK293 cells (B). Noncoding scramble was used as control siRNA (siControl). Mass spectrometry confirmed raised 2HG with L2HGDH knockdown (left panels). Genomic DNA was also isolated to determine 5hmC level by ELISA (right panels). (C) HEK293 cells were transiently co-transfected with TET1 CD and either L2HGDH cDNA or control vector (CV). Cells were subsequently challenged for 4hrs with 1mM L-2HG octyl ester. Metabolites were extracted for measurement of intracellular total 2HG level and analyzed by LC-MS (left panel). Genomic DNA was also isolated to determine 5hmC level by ELISA (right panel). Error bars indicate standard deviation from at least two independent experiments. (**) p < 0.005, (*) p < 0.05 (D) 5hmc dot blot assay in A498 cells +/- L2HGDH cDNA. Methylene blue blot is included for loading control. (E)Histone immunoblotting in A498 and RXF393 cells +/- L2HGDH cDNA. (F and G) Proliferation and colony formation assays in RCC cells +/- L2HGDH cDNA.

References

    1. Pollard PJ, Briere JJ, Alam NA, Barwell J, Barclay E, Wortham NC, et al. Accumulation of Krebs cycle intermediates and over-expression of HIF1alpha in tumours which result from germline FH and SDH mutations. Human molecular genetics. 2005;14:2231–9. - PubMed
    1. Ward PS, Patel J, Wise DR, Abdel-Wahab O, Bennett BD, Coller HA, et al. The common feature of leukemia-associated IDH1 and IDH2 mutations is a neomorphic enzyme activity converting alpha-ketoglutarate to 2-hydroxyglutarate. Cancer Cell. 2010;17:225–34. - PMC - PubMed
    1. Dang L, White DW, Gross S, Bennett BD, Bittinger MA, Driggers EM, et al. Cancer-associated IDH1 mutations produce 2-hydroxyglutarate. Nature. 2009;462:739–44. - PMC - PubMed
    1. Kaelin WG., Jr Cancer and altered metabolism: potential importance of hypoxia-inducible factor and 2-oxoglutarate-dependent dioxygenases. Cold Spring Harb Symp Quant Biol. 2011;76:335–45. - PMC - PubMed
    1. Wu H, Zhang Y. Mechanisms and functions of Tet protein-mediated 5-methylcytosine oxidation. Genes & development. 2011;25:2436–52. - PMC - PubMed

Publication types