

Microbial genomic analysis reveals the essential role of inflammation in bacteria-induced colorectal cancer
- PMID: 25182170
- PMCID: PMC4155410
- DOI: 10.1038/ncomms5724
Microbial genomic analysis reveals the essential role of inflammation in bacteria-induced colorectal cancer
Abstract
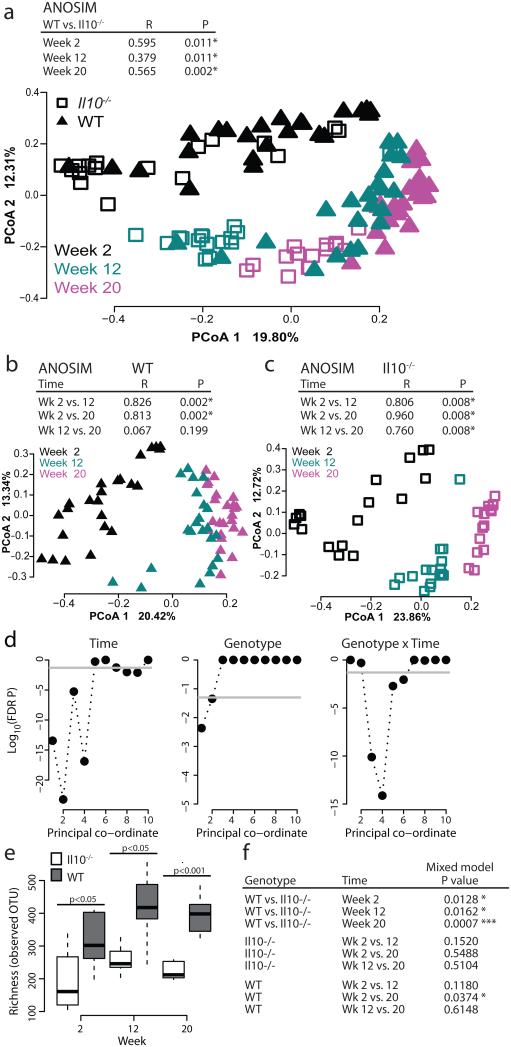
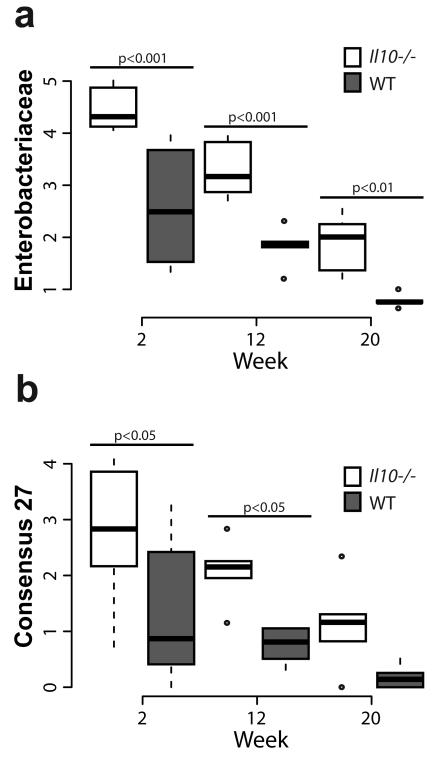
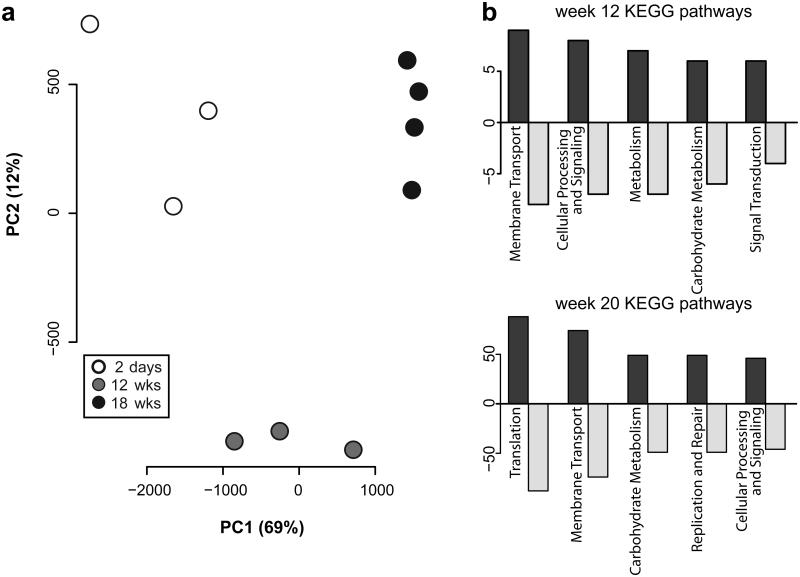
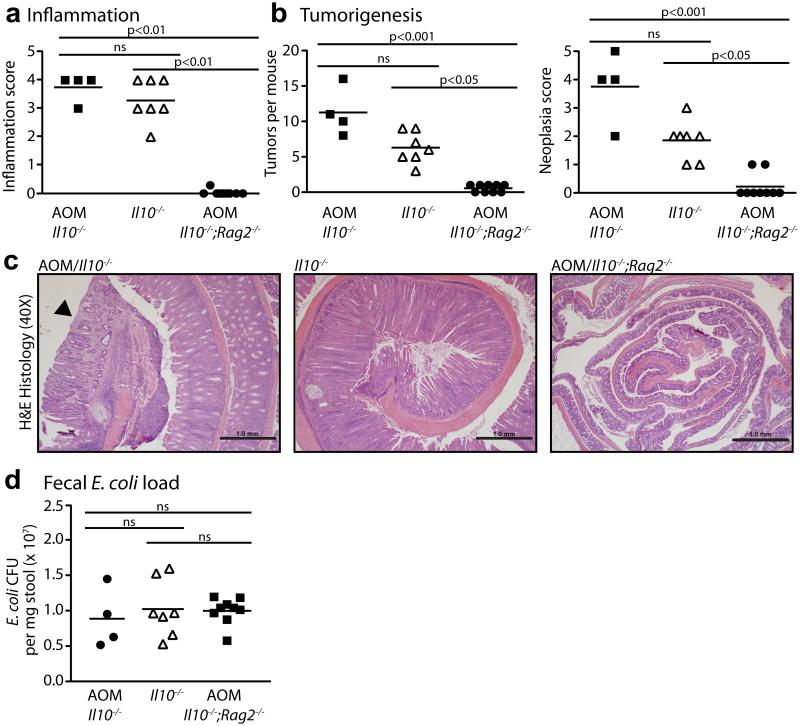
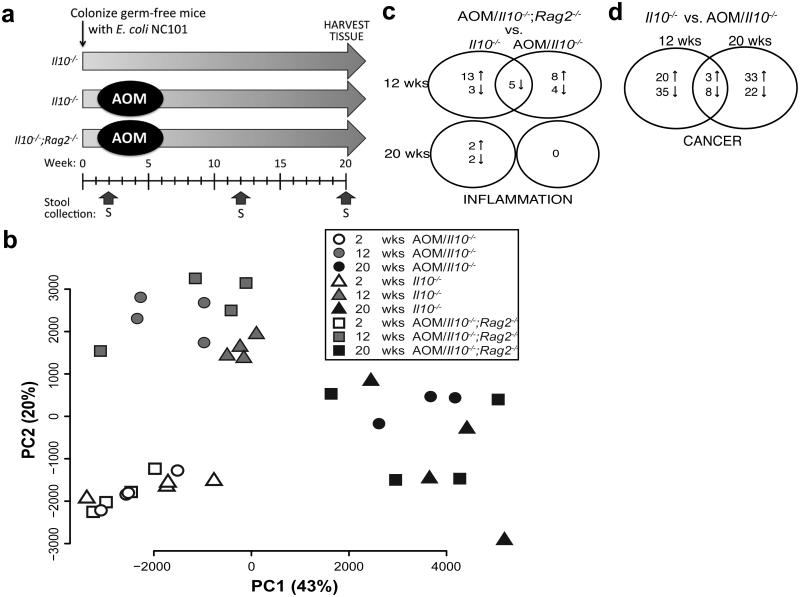
Enterobacteria, especially Escherichia coli, are abundant in patients with inflammatory bowel disease or colorectal cancer (CRC). However, it is unclear whether cancer is promoted by inflammation-induced expansion of E. coli and/or changes in expression of specific microbial genes. Here we use longitudinal (2, 12 and 20 weeks) 16S rRNA sequencing of luminal microbiota from ex-germ-free mice to show that inflamed Il10(-/-) mice maintain a higher abundance of Enterobacteriaceae than healthy wild-type mice. Experiments with mono-colonized Il10(-/-) mice reveal that host inflammation is necessary for E. coli cancer-promoting activity. RNA-sequence analysis indicates significant changes in E. coli gene catalogue in Il10(-/-) mice, with changes mostly driven by adaptation to the intestinal environment. Expression of specific genes present in the tumour-promoting E. coli pks island are modulated by inflammation/CRC development. Thus, progression of inflammation in Il10(-/-) mice supports Enterobacteriaceae and alters a small subset of microbial genes important for tumour development.
Figures
Similar articles
-
Intestinal inflammation targets cancer-inducing activity of the microbiota.Science. 2012 Oct 5;338(6103):120-3. doi: 10.1126/science.1224820. Epub 2012 Aug 16. Science. 2012. PMID: 22903521 Free PMC article.
-
Inflammation-induced acid tolerance genes gadAB in luminal commensal Escherichia coli attenuate experimental colitis.Infect Immun. 2013 Oct;81(10):3662-71. doi: 10.1128/IAI.00355-13. Epub 2013 Jul 22. Infect Immun. 2013. PMID: 23876805 Free PMC article.
-
Locoregional Effects of Microbiota in a Preclinical Model of Colon Carcinogenesis.Cancer Res. 2017 May 15;77(10):2620-2632. doi: 10.1158/0008-5472.CAN-16-3472. Epub 2017 Apr 17. Cancer Res. 2017. PMID: 28416491 Free PMC article.
-
Colorectal cancer-inflammatory bowel disease nexus and felony of Escherichia coli.Life Sci. 2017 Jul 1;180:60-67. doi: 10.1016/j.lfs.2017.05.016. Epub 2017 May 12. Life Sci. 2017. PMID: 28506682 Review.
-
E. coli and colon cancer: is mutY a culprit?Cancer Lett. 2013 Dec 1;341(2):127-31. doi: 10.1016/j.canlet.2013.08.003. Epub 2013 Aug 7. Cancer Lett. 2013. PMID: 23933175 Review.
Cited by
-
Gut Microbiota and Colon Cancer: A Role for Bacterial Protein Toxins?Int J Mol Sci. 2020 Aug 27;21(17):6201. doi: 10.3390/ijms21176201. Int J Mol Sci. 2020. PMID: 32867331 Free PMC article. Review.
-
Hepatic pIgR-mediated secretion of IgA limits bacterial translocation and prevents ethanol-induced liver disease in mice.Gut. 2023 Oct;72(10):1959-1970. doi: 10.1136/gutjnl-2022-328265. Epub 2023 Jan 23. Gut. 2023. PMID: 36690432 Free PMC article.
-
Intratumor microbiome in cancer progression: current developments, challenges and future trends.Biomark Res. 2022 May 31;10(1):37. doi: 10.1186/s40364-022-00381-5. Biomark Res. 2022. PMID: 35642013 Free PMC article. Review.
-
A computational system for identifying operons based on RNA-seq data.Methods. 2020 Apr 1;176:62-70. doi: 10.1016/j.ymeth.2019.03.026. Epub 2019 Apr 4. Methods. 2020. PMID: 30953757 Free PMC article. Review.
-
Inhibition of Rac family protein impairs colitis and colitis-associated cancer in mice.Am J Cancer Res. 2018 Jan 1;8(1):70-80. eCollection 2018. Am J Cancer Res. 2018. PMID: 29416921 Free PMC article.
References
-
- Holmes E, Li JV, Marchesi JR, Nicholson JK. Gut microbiota composition and activity in relation to host metabolic phenotype and disease risk. Cell Metab. 2012;16:559–564. - PubMed
Publication types
MeSH terms
Substances
Grants and funding
LinkOut - more resources
Full Text Sources
Other Literature Sources
Medical
Molecular Biology Databases
Miscellaneous
