Clinical Trial
. 2014 Nov;58(11):6747-57.
doi: 10.1128/AAC.03607-14. Epub 2014 Sep 2.

Quantification of rifapentine, a potent antituberculosis drug, from dried blood spot samples using liquid chromatographic-tandem mass spectrometric analysis

Affiliations
Clinical Trial

Quantification of rifapentine, a potent antituberculosis drug, from dried blood spot samples using liquid chromatographic-tandem mass spectrometric analysis

Teresa L Parsons et al. Antimicrob Agents Chemother. 2014 Nov.

Abstract

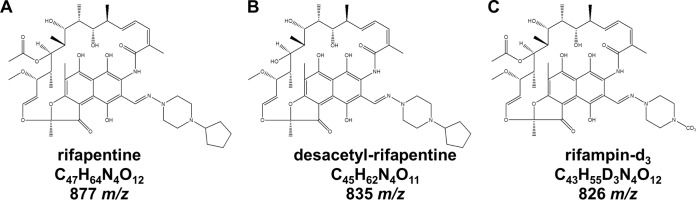
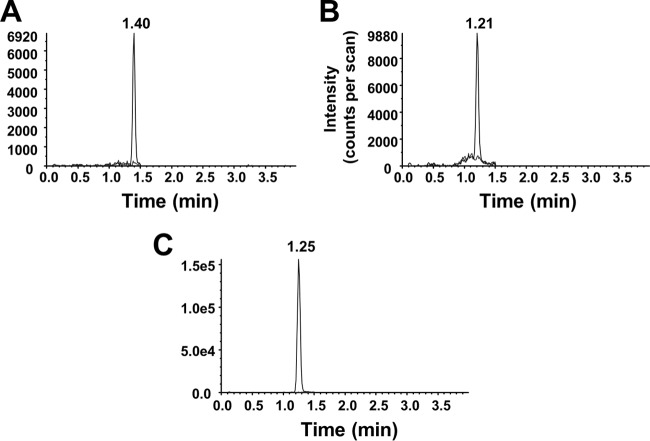
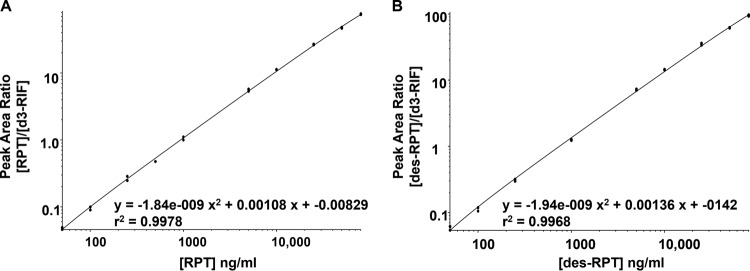
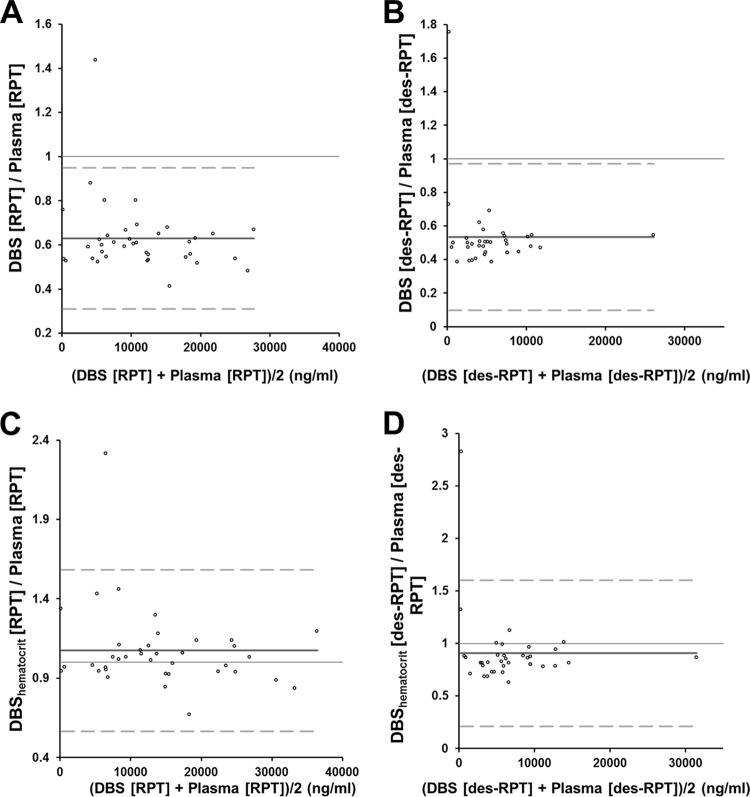
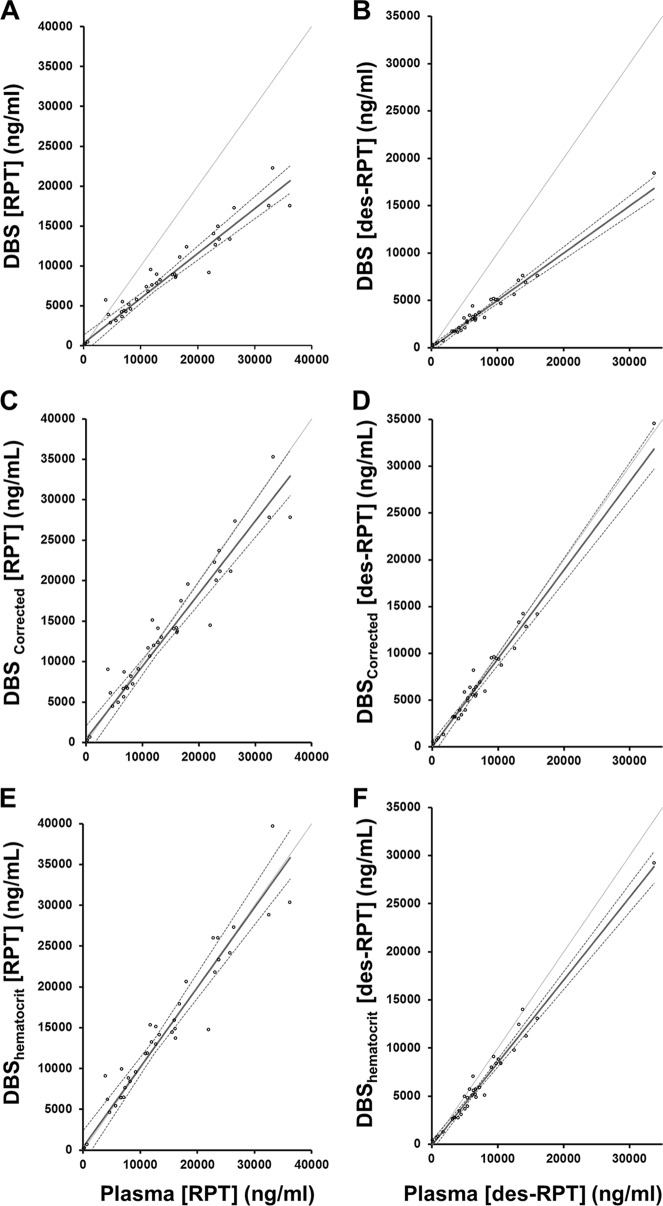
The quantification of antituberculosis drug concentrations in multinational trials currently requires the collection of modest blood volumes, centrifugation, aliquoting of plasma, freezing, and keeping samples frozen during shipping. We prospectively enrolled healthy individuals into the Tuberculosis Trials Consortium Study 29B, a phase I dose escalation study of rifapentine, a rifamycin under evaluation in tuberculosis treatment trials. We developed a liquid chromatography-tandem mass spectrometry (LC-MS/MS) method for quantifying rifapentine in whole blood on dried blood spots (DBS) to facilitate pharmacokinetic/pharmacodynamic analyses in clinical trials. Paired plasma and whole-blood samples were collected by venipuncture, and whole blood was spotted on Whatman protein saver 903 cards. The methods were optimized for plasma and then validated for DBS. The analytical measuring range for quantification of rifapentine and its metabolite was 50 to 80,000 ng/ml in whole-blood DBS. The analyte was stable on the cards for 11 weeks with a desiccant at room temperature and protected from light. The method concordance for paired plasma and whole-blood DBS samples was determined after correcting for participant hematocrit or population-based estimates of bias from Bland-Altman plots. The application of either correction factor resulted in acceptable correlation between plasma and whole-blood DBS (Passing-Bablok regression corrected for hematocrit; y = 0.98x + 356). Concentrations of rifapentine may be determined from whole-blood DBS collected via venipuncture after normalization in order to account for the dilutional effects of red blood cells. Additional studies are focused on the application of this methodology to capillary blood collected by finger stick. The simplicity of processing, storage, shipping, and low blood volume makes whole-blood DBS attractive for rifapentine pharmacokinetic evaluations, especially in international and pediatric trials.


Figures

FIG 1
FIG 1
Structures of rifapentine (A), desacetyl-rifapentine (B), and isotopically labeled rifampin (C), along with the chemical formulas and the mass/charge ratios of the compounds.
FIG 2
FIG 2
Chromatograms of drug-free and drug-spiked whole-blood DBS for the monitoring of ion transitions for rifapentine (A), desacetyl-rifapentine (B), and [2H3]rifampin (C). The drug-spiked whole blood concentration was 50 ng/ml (LLOQ) for both drugs, and the internal standard concentration spiked was 500 ng/ml.
FIG 3
FIG 3
Representative calibration curve for rifapentine and desacetyl-rifapentine from whole-blood DBS. The analytical measuring range for both drugs is 50 to 80,000 ng/ml, and the curves were fit to the calibrators using a quadratic regression with 1/x2 weighting. The calibration curves are displayed on a log-log scale so that all calibration points would be visible. The y axis is the peak area ratio of the analyte to the internal standard, and the x axis demarcates analyte concentration.
FIG 4
FIG 4
Bland-Altman plots of rifapentine (A and C) and desacetyl-rifapentine (B and D) concentration ratios of whole-blood DBS to plasma versus the average of the two concentrations (whole blood and plasma). The dark gray solid line is the mean ratio (bias) and the dashed lines are the limits of agreement (mean ratio ± 1.96 × standard deviation of the ratio). Shown are the whole-blood concentrations (A and B) and a comparison of participant-corrected hematocrit whole-blood concentrations with plasma concentrations (C and D). The one outlier seen in all four plots is from the same subject at the same time point. The most logical reason for the outlier status of this sample is that the plasma sample was drawn 23 min prior to the DBS sample, and therefore, the DBS concentrations were higher than those of plasma.
FIG 5
FIG 5
Passing-Bablok regression between concentrations in whole-blood DBS and plasma are displayed. The dark solid line is the Passing-Bablok fit, and the dashed lines are the 95% CI bands. The scatter plots illustrate uncorrected whole-blood rifapentine (A) and desacetyl-rifapentine (B) versus plasma drug concentrations, with regression line slopes and intercepts of 0.56 (95% CI, 0.50 to 0.64) and 303 (95% CI, −188 to 1,142), and 0.50 (95% CI, 0.47 to 0.55) and −8.84 (95% CI, −239 to 133), respectively. (C and D) Bland-Altman-corrected whole-blood rifapentine (C) and desacetyl-rifapentine (D) drug concentrations compared to those in plasma, with regression line slopes and intercepts of 0.90 (95% CI, 0.80 to 1.01) and 443 (95% CI, −273 to 1,652), and 0.95 (95% CI, 0.89 to 1.03) and −31.7 (95% CI, −489 to 185), respectively. (E and F) Participant-specific hematocrit-corrected whole-blood rifapentine (E) and desacetyl-rifapentine (F) concentrations compared to those in plasma, with regression line slopes and intercepts of 0.98 (95% CI, 0.87 to 1.10) and 356 (95% CI, −452 to 1,827), and 0.86 (95% CI, 0.81 to 0.93) and −144 (95% CI, −500 to 73.1), respectively.

References

    1. World Health Organization. 2013. Global tuberculosis report 2013. WHO/HTM/TB/2013.11. World Health Organization, Geneva, Switzerland: http://apps.who.int/iris/bitstream/10665/91355/1/9789241564656_eng.pdf?ua=1.
    1. Hietala SF, Bhattarai A, Msellem M, Röshammar D, Ali AS, Strömberg J, Hombhanje FW, Kaneko A, Björkman A, Ashton M. 2007. Population pharmacokinetics of amodiaquine and desethylamodiaquine in pediatric patients with uncomplicated falciparum malaria. J. Pharmacokinet. Pharmacodyn. 34:669–686. 10.1007/s10928-007-9064-2. - DOI - PubMed
    1. Hoogtanders K, van der Heijden J, Christiaans M, Edelbroek P, van Hooff JP, Stolk LM. 2007. Therapeutic drug monitoring of tacrolimus with the dried blood spot method. J. Pharm. Biomed. Anal. 44:658–664. 10.1016/j.jpba.2006.11.023. - DOI - PubMed
    1. Koal T, Burhenne H, Römling R, Svoboda M, Resch K, Kaever V. 2005. Quantification of antiretroviral drugs in dried blood spot samples by means of liquid chromatography/tandem mass spectrometry. Rapid Commun. Mass Spectrom. 19:2995–3001. 10.1002/rcm.2158. - DOI - PubMed
    1. Taneja I, Erukala M, Raju KS, Singh SP, Wahajuddin 2013. Dried blood spots in bioanalysis of antimalarials: relevance and challenges in quantitative assessment of antimalarial drugs. Bioanalysis 5:2171–2186. 10.4155/bio.13.180. - DOI - PubMed

Publication types

MeSH terms