. 2014 Nov;82(11):4899-908.
doi: 10.1128/IAI.02213-14. Epub 2014 Sep 2.

DAP1, a negative regulator of autophagy, controls SubAB-mediated apoptosis and autophagy

Affiliations

DAP1, a negative regulator of autophagy, controls SubAB-mediated apoptosis and autophagy

Kinnosuke Yahiro et al. Infect Immun. 2014 Nov.

Abstract

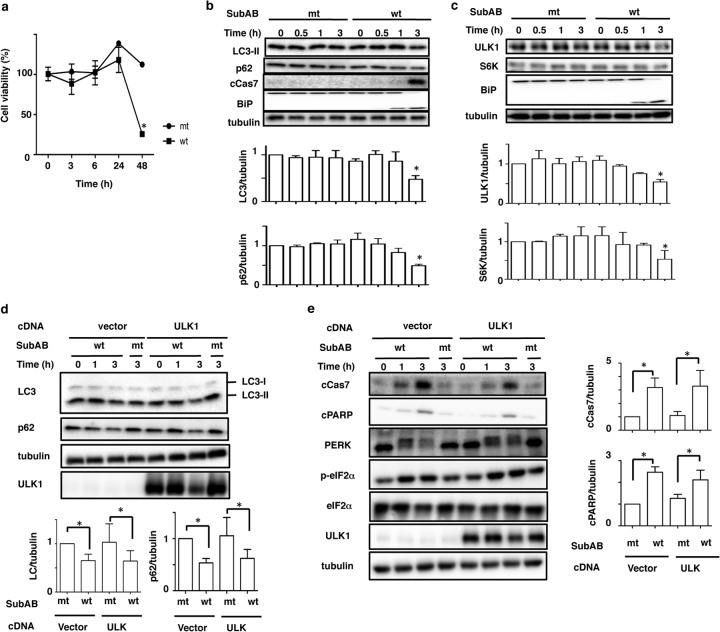
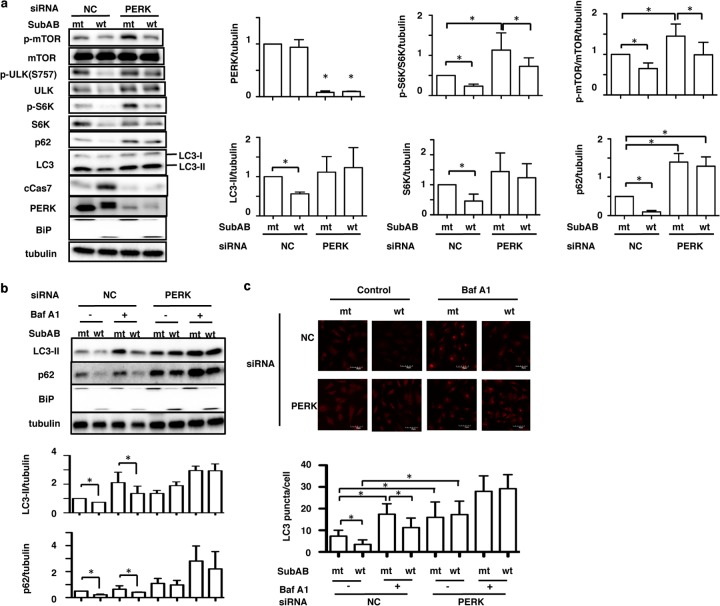
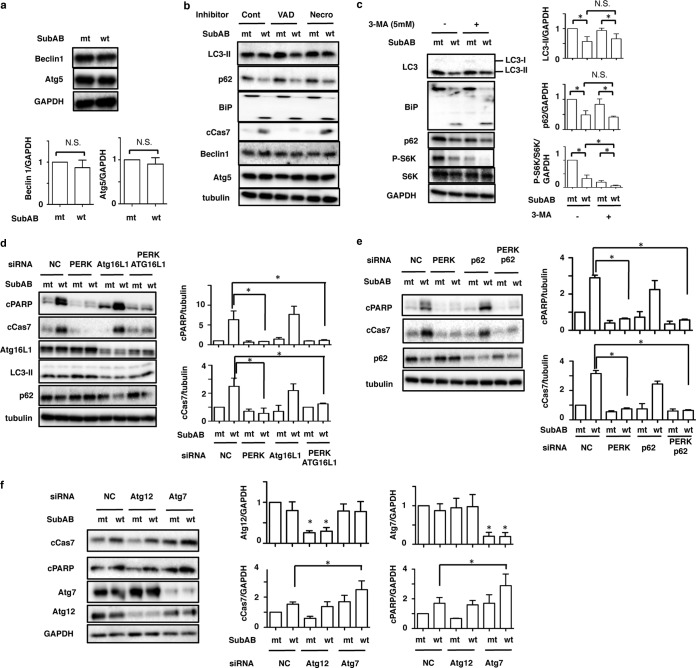
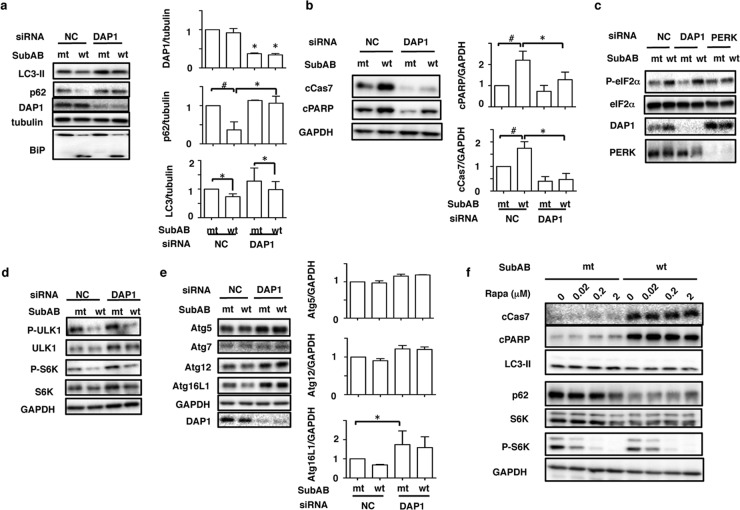
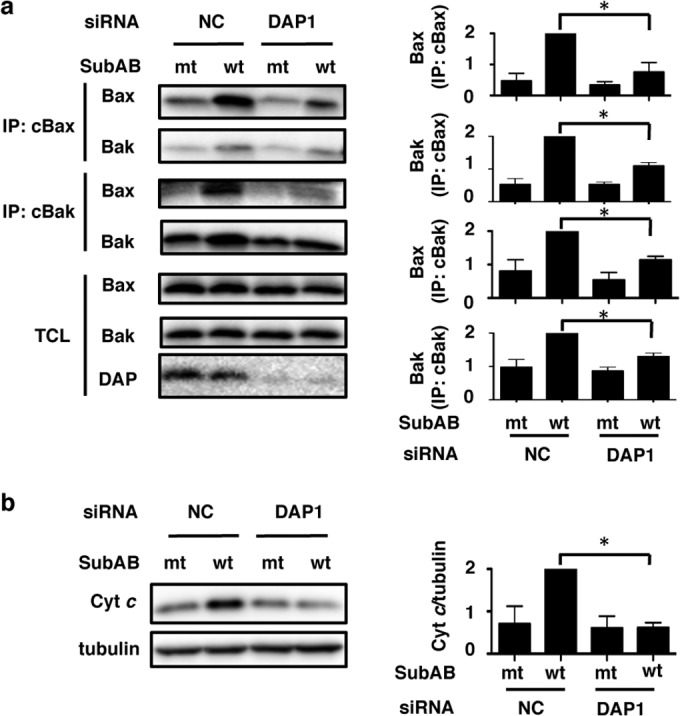
Autophagy and apoptosis play critical roles in cellular homeostasis and survival. Subtilase cytotoxin (SubAB), produced by non-O157 type Shiga-toxigenic Escherichia coli (STEC), is an important virulence factor in disease. SubAB, a protease, cleaves a specific site on the endoplasmic reticulum (ER) chaperone protein BiP/GRP78, leading to ER stress, and induces apoptosis. Here we report that in HeLa cells, activation of a PERK (RNA-dependent protein kinase [PKR]-like ER kinase)-eIF2α (α subunit of eukaryotic initiation factor 2)-dependent pathway by SubAB-mediated BiP cleavage negatively regulates autophagy and induces apoptosis through death-associated protein 1 (DAP1). We found that SubAB treatment decreased the amounts of autophagy markers LC3-II and p62 as well as those of mTOR (mammalian target of rapamycin) signaling proteins ULK1 and S6K. These proteins showed increased expression levels in PERK knockdown or DAP1 knockdown cells. In addition, depletion of DAP1 in HeLa cells dramatically inhibited the SubAB-stimulated apoptotic pathway: SubAB-induced Bax/Bak conformational changes, Bax/Bak oligomerization, cytochrome c release, activation of caspases, and poly(ADP-ribose) polymerase (PARP) cleavage. These results show that DAP1 is a key regulator, through PERK-eIF2α-dependent pathways, of the induction of apoptosis and reduction of autophagy by SubAB.


Figures

FIG 1
FIG 1
Effect of SubAB on autophagy in HeLa cells. (a) HeLa cells were incubated with catalytically inactivated (mt) or wild-type (wt) SubAB (200 ng/ml) for 0, 3, 6, 24, and 48 h. Cell viability with SubAB was determined with a Cell Counting kit as described in Materials and Methods. Data are means ± standard deviations of values from three experiments, with three duplicates per experiment (n = 6). *, P < 0.05. (b) HeLa cells were incubated with mt or wt SubAB (200 ng/ml) for 0, 0.5, 1, and 3 h. (Top) Cell lysates were analyzed by Western blotting using the indicated antibodies. (Bottom) The amounts of LC3-II and p62 after incubation with mt or wt SubAB were quantified by densitometry. Data are means ± standard deviations of values from three experiments. *, P < 0.05. (c) HeLa cells were treated with mt or wt SubAB for the indicated times. (Top) Cell lysates were analyzed by Western blotting using the indicated antibodies. (Bottom) The amounts of ULK1 and S6K after incubation with mt or wt SubAB were quantified by densitometry. Data are means ± standard deviations of values from three experiments. *, P < 0.05. (d) Cells transiently expressing Myc-tagged ULK1 were incubated with mt or wt SubAB for 3 h at 37°C. (Top) The amounts of LC3-II, p62, and ULK1 were determined by immunoblot analysis. (Bottom) The amounts of LC3-II and p62 after incubation with mt or wt SubAB for 3 h were quantified by densitometry. Data are means ± standard deviations of values from three experiments. *, P < 0.05. (e) Cells transiently expressing ULK1 cDNAs were treated with mt or wt SubAB for 0, 1, or 3 h at 37°C. (Left) Cell lysates were analyzed by Western blotting using specific antibodies as indicated. All experiments were repeated three times with similar results. (Right) The amounts of cCas7 and cPARP after incubation for 3 h with mt or wt SubAB were quantified by densitometry. Data are means ± standard deviations of values from three experiments. *, P < 0.05.
FIG 2
FIG 2
PERK controls apoptosis and autophagy by SubAB in HeLa cells. (a) Nontargeting control (NC) and PERK siRNA-transfected HeLa cells were incubated with mt or wt SubAB for 3 h. NC, nontargeting control siRNA. (Left) Cell lysates were analyzed by Western blotting using specific antibodies as indicated. (Right) The amounts of PERK, LC3-II, S6K, phospho-S6K (p-S6K), phospho-mTOR (p-mTOR), and p62 after incubation with mt or wt SubAB in control (NC) or PERK knockdown cells were quantified by densitometry. All experiments were repeated three times with similar results. Data are means ± standard deviations of values from three experiments. *, P < 0.05. (b) The siRNA-transfected HeLa cells were incubated with mt or wt SubAB in the presence or absence of 100 nM bafilomycin A1 (Baf A1) for 3 h. (Top) Cell lysates were analyzed by Western blotting using anti-LC3B, anti-p62, and anti-BiP antibodies. Tubulin was used as a loading control. (Bottom) The amounts of LC3-II and p62 were quantified by densitometry. All experiments were repeated three times with similar results. Data are means ± standard deviations of values from three experiments. *, P < 0.05. (c) (Top) The indicated siRNA-transfected HeLa cells were incubated with mt or wt SubAB in the presence or absence of 100 nM bafilomycin A1 (Baf A1) for 3 h, followed by fixation and then reaction with the indicated antibodies as described in Materials and Methods. (Bottom) The LC3 puncta in a single cell were manually counted under a confocal microscope (*, P < 0.05). For each group, 30 cells were randomly selected for averaging the number of LC3 puncta per cell.
FIG 3
FIG 3
Effects of SubAB on autophagy-related proteins in HeLa cells. (a) HeLa cells were incubated with mt or wt SubAB for 3 h. Cell lysates were analyzed by Western blotting using anti-Beclin1 and anti-Atg5 antibodies. GAPDH was used as a loading control. N.S., not significant. (b) HeLa cells were pretreated with 10 μM Z-VAD-FMK (VAD) or 20 μM Necrostatin 1 (Necro) for 30 min and were then incubated with mt or wt SubAB for 3 h. Cell lysates were analyzed by Western blotting using specific antibodies as indicated. Cont, control. (c) HeLa cells were preincubated with 5 mM 3-methyladenine (3-MA) for 30 min and were then incubated with mt or wt SubAB for 3 h. (Left) Cell lysates were analyzed by Western blotting using specific antibodies as indicated. (Right) The amounts of LC3-II, p62, and p-S6K were quantified by densitometry. All experiments were repeated three times with similar results. Data are means ± standard deviations of values from three experiments. *, P < 0.05. (d and e) The indicated siRNA-transfected HeLa cells were incubated with mt or wt SubAB for 3 h. Cell lysates were analyzed by Western blotting using the indicated antibodies. The amounts of cPARP and cCas7 were quantified by densitometry. All experiments were repeated three times with similar results. Data are means ± standard deviations of values from three experiments. *, P < 0.05. (f) NC, Atg12, and Atg7 siRNA-transfected HeLa cells were incubated with mt or wt SubAB for 3 h. (Left) Cell lysates were analyzed by Western blotting using specific antibodies as indicated. All experiments were repeated three times with similar results. (Right) Atg7, Atg12, cCas7, and cPARP obtained with mt and wt SubAB were quantified by densitometry. Data are means ± standard deviations of values from three experiments. *, P < 0.05.
FIG 4
FIG 4
Knockdown of DAP1 rescues SubAB-mediated autophagy and apoptosis. (a) Nontargeting control (NC) and DAP1 siRNA-transfected HeLa cells (1 × 10⁵/well) were incubated with mt or wt SubAB (0.2 μg/ml) for 3 to 4 h at 37°C. (Left) Cell lysates were analyzed by Western blotting using the indicated antibodies. (Right) The amounts of DAP1, p62, and LC3-II after incubation with mt or wt SubAB in NC or DAP1 knockdown cells were quantified by densitometry. All data are representative of the results of at least three separate experiments. Data are means ± standard deviations of values from three experiments. #, P < 0.03; *, P < 0.05. (b) NC and DAP1 siRNA-transfected cells were incubated with mt or wt SubAB (0.2 μg/ml) for 3 to 4 h at 37°C. (Left) Cell lysates were analyzed by Western blotting using anti-cCas7 and anti-cPARP antibodies. GAPDH was used as a loading control. (Right) The amounts of cCas7 and cPARP were quantified by densitometry. All data are representative of the results of at least three separate experiments. Data are means ± standard deviations of values from three experiments. #, P < 0.03; *, P < 0.05. (c) NC and DAP1 siRNA-transfected cells were incubated with wt or mt SubAB at 37°C for 2 h, followed by immunoblotting with anti-p-eIF2α(Ser51), anti-eIF2α, anti-DAP1, and anti-PERK antibodies. All data are representative of the results of at least three separate experiments. (d) NC and DAP1 siRNA-transfected cells were incubated with wt or mt SubAB at 37°C for 3 to 4 h, followed by immunoblotting with specific antibodies as indicated. (e) (Left) The siRNA-transfected cells were incubated and immunoblotted as described for panel d. (Right) The amounts of Atg5, Atg12, and Atg16L1 after incubation with mt or wt SubAB in NC or DAP1 knockdown cells were quantified by densitometry. All data are representative of the results of at least three separate experiments. Data are means ± standard deviations of values from three experiments. *, P < 0.05. (f) Cells were pretreated with the indicated concentrations of rapamycin (Rapa) for 1 h and were then incubated with mt or wt SubAB for 4 h, followed by immunoblotting with the indicated antibodies. All data are representative of the results of at least three separate experiments.
FIG 5
FIG 5
Depletion of DAP1 inhibits SubAB-induced Bak/Bax conformational changes. (a) NC and DAP1 siRNA-transfected cells were incubated with mt or wt SubAB (0.2 μg/ml) for 3 h at 37°C. Then cells were lysed, and proteins were immunoprecipitated with conformation-specific anti-Bax (cBax) or anti-Bak (cBak) monoclonal antibodies as described in Materials and Methods. The immunocomplexes (IP) or total-cell lysates (TCL) were analyzed by SDS-PAGE, followed by immunoblotting with anti-Bax and anti-Bak antibodies. (b) The level of cytochrome c (Cyt c) release into the cytoplasmic fraction was determined as described in Materials and Methods. Cytochrome c and tubulin were detected by Western blotting. Conformationally changed Bax, conformationally changed Bak, Bax/Bak complexes, and released Cyt c obtained with mt and wt SubAB were quantified by densitometry. Data are means ± standard deviations of values from three experiments. *, P < 0.05.

Similar articles

Cited by

References

    1. Riley LW, Remis RS, Helgerson SD, McGee HB, Wells JG, Davis BR, Hebert RJ, Olcott ES, Johnson LM, Hargrett NT, Blake PA, Cohen ML. 1983. Hemorrhagic colitis associated with a rare Escherichia coli serotype. N. Engl. J. Med. 308:681–685. 10.1056/NEJM198303243081203. - DOI - PubMed
    1. Latorre-Martinez JC, Garcia-Lozano T, Blanco J, Buesa J. 2007. Characterization of Escherichia coli O157:H7 strains isolated from sporadic cases of hemolytic-uremic syndrome in children. Enferm. Infecc. Microbiol. Clin. 25:603–604 (In Spanish.) 10.1157/13111190. - DOI - PubMed
    1. Shiomi M, Togawa M. 1997. Sporadic cases of hemolytic uremic syndrome and hemorrhagic colitis with serum IgM antibodies to lipopolysaccharides of enterohemorrhagic Escherichia coli O157. Nihon Rinsho 55:686–692 (In Japanese.) - PubMed
    1. Karmali MA. 2004. Prospects for preventing serious systemic toxemic complications of Shiga toxin-producing Escherichia coli infections using Shiga toxin receptor analogues. J. Infect. Dis. 189:355–359. 10.1086/381130. - DOI - PubMed
    1. Paton AW, Srimanote P, Talbot UM, Wang H, Paton JC. 2004. A new family of potent AB5 cytotoxins produced by Shiga toxigenic Escherichia coli. J. Exp. Med. 200:35–46. 10.1084/jem.20040392. - DOI - PMC - PubMed

Publication types

MeSH terms