Review
. 2014 Sep 1;74(17):4638-52.
doi: 10.1158/0008-5472.CAN-13-3534.

Diffusion-weighted imaging in cancer: physical foundations and applications of restriction spectrum imaging

Affiliations
Review

Diffusion-weighted imaging in cancer: physical foundations and applications of restriction spectrum imaging

Nathan S White et al. Cancer Res. .

Erratum in

  • Cancer Res. 2014 Nov 15;74(22):6733. McDonald, Carrie R [corrected to McDonald, Carrie];Kaine, Christopher J [corrected to Kane, Christopher J]

Abstract

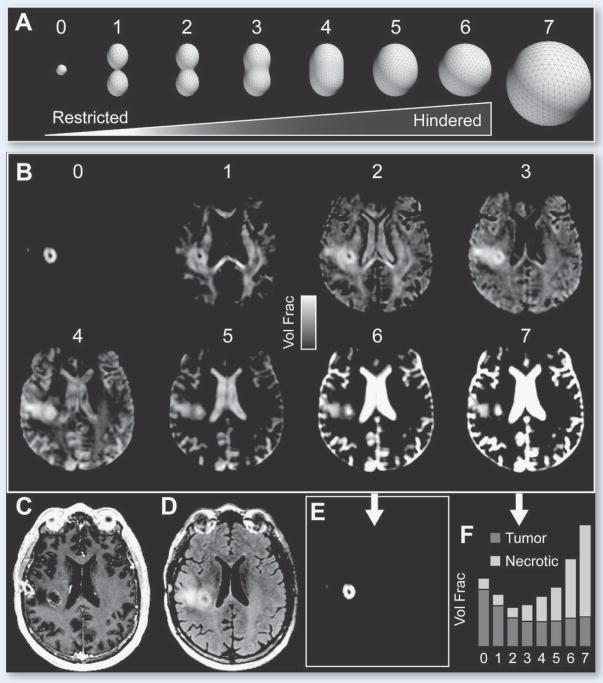
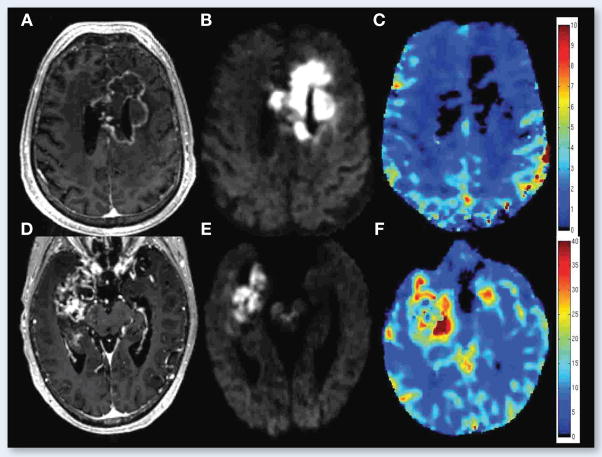
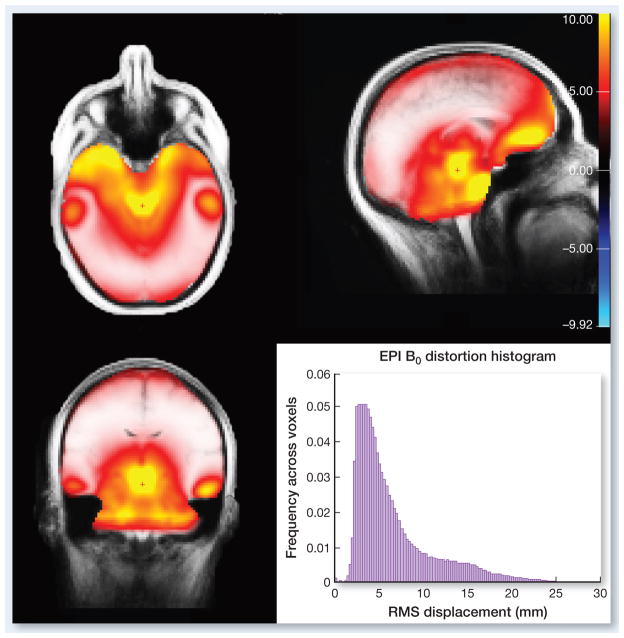
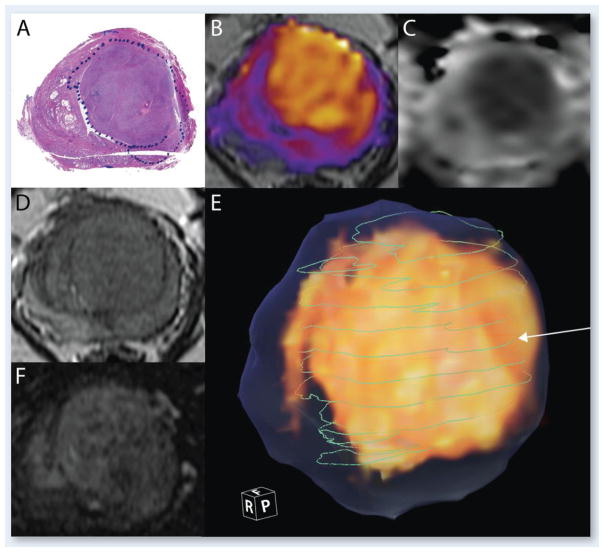
Diffusion-weighted imaging (DWI) has been at the forefront of cancer imaging since the early 2000s. Before its application in clinical oncology, this powerful technique had already achieved widespread recognition due to its utility in the diagnosis of cerebral infarction. Following this initial success, the ability of DWI to detect inherent tissue contrast began to be exploited in the field of oncology. Although the initial oncologic applications for tumor detection and characterization, assessing treatment response, and predicting survival were primarily in the field of neurooncology, the scope of DWI has since broadened to include oncologic imaging of the prostate gland, breast, and liver. Despite its growing success and application, misconceptions about the underlying physical basis of the DWI signal exist among researchers and clinicians alike. In this review, we provide a detailed explanation of the biophysical basis of diffusion contrast, emphasizing the difference between hindered and restricted diffusion, and elucidating how diffusion parameters in tissue are derived from the measurements via the diffusion model. We describe one advanced DWI modeling technique, called restriction spectrum imaging (RSI). This technique offers a more direct in vivo measure of tumor cells, due to its ability to distinguish separable pools of water within tissue based on their intrinsic diffusion characteristics. Using RSI as an example, we then highlight the ability of advanced DWI techniques to address key clinical challenges in neurooncology, including improved tumor conspicuity, distinguishing actual response to therapy from pseudoresponse, and delineation of white matter tracts in regions of peritumoral edema. We also discuss how RSI, combined with new methods for correction of spatial distortions inherent in diffusion MRI scans, may enable more precise spatial targeting of lesions, with implications for radiation oncology and surgical planning. See all articles in this Cancer Research section, "Physics in Cancer Research."


Conflict of interest statement

Conflicts of interest: None of the authors have any personal or institutional financial interest in drugs, materials, or devices described in this submission.

Figures

Figure 1
Figure 1
The diffusion experiment. Sensitivity to the random molecular displacements (Brownian motion) of water molecules is achieved through the use to two magnetic field gradient pulses with amplitude G, duration δ, and separation Δ. During the first pulse, the initial positions of water molecules (spins) are encoded with a phase offset depending on their spatial location in the gradient field. The second pulse is then applied after some finite delay Δ to realign the spin phases. In this way, if water molecules diffusion to a different physical location along the gradient field direction, refocusing will be imperfect and a net phase dispersion will result. This phase dispersion causes an attenuation of the magnitude signal and a decrease (darkening) of the measurement voxel in the reconstructed image.
Figure 2
Figure 2
The three principal modes of diffusion in tissue. (A) In free water, the average molecular excursion along a single dimension in space in terms of the root-mean-squared distance s increases linearly with the square root of diffusion time s = (2DTd)1/2 with a slope that depends on the intrinsic diffusivity D. (B) For hindered water in brain ECS, the net displacements remain linear with the square root of diffusion time (i.e. Gaussian) but the effective diffusion coefficient D* (or ADC) is reduced compared with D due to tortuosity of the ECS. The theoretical maximum reduction in D* (or ADC) that can be expected due to crowding of small spherical cells in the ECS is given by the tortuosity limit π/2 or 40% (35). (C) In restricted intracellular diffusion, the net distance traveled by water molecules is limited by the compartment dimensions leading to a sub-linear time evolution of the net squared displacement and a decrease ADC. The ADC of restricted intracellular water decreases with diffusion time as a larger proportion of the spins “bounce off” the plasma membrane.
Figure 3
Figure 3
RSI analysis of a 51 year-old Male with right frontal GBM. (A) Illustration of the RSI “spectrum” model used to fit the multi-b-value, multi-direction DWI data. Scales 0–2 and 3–6 correspond to restricted and hindered diffusion, respectively. Scales 0, 6, and 7 are isotropic, while Scales 1–5 are anisotropic (i.e. oriented). (B) RSI-derived (T2-weighted) volume fraction maps for each scale in A. (C) T1-weighted post-contrast (D) T2-weighted FLAIR (E) RSI-derived “cellularity map” (RSI-CM) corresponding to a weighted (“beamformed”) linear combination of Scales 0–7 showing maximal sensitivity and specificity to spherically restricted diffusion (Scale 0). (F) Bar plot of volume fractions for two representative voxels in tumor and necrotic tissue, respectively.
Figure 4
Figure 4
From left to right: T1-weighted post-contrast, T2-weighted FLAIR, ADC, and RSI Cellularity Map for a 53 year-old male with treatment naïve right temporal GBM (top row) and a 73 year-old female with metatstatic non-small cell lung cancer. Bottom: ROC curves demonstrating increased sensitivity, specificity, and overall accuracy for delineating high grade primary and metastatic brain tumors with RSI compared with ADC. Note the high tumor conspicuity on RSI and the more protruding finger-like margins in GBM compared with metastatic disease, consistent with infiltrating tumor into peritumoral edema.
Figure 5
Figure 5
67 year old male with left parietal GBM status post resection and chemoradiation. Top row shows the T1 post-contrast – T1 pre-contrast (A), FLAIR (B), ADC (C), and RSI-CMs (D) before the start of bevacizumab, while the middle row shows the T1 post-contrast – T1 pre-contrast (E), FLAIR (F), ADC (G), and RSI-CMs (H) after initiation of bevacizumab. Arrowheads point to the contrast enhancing region (green), the surrounding region of FLAIR-HI (yellow), and the region of RD on RSI-CMs (red). Although there is a decrease in contrast enhancement and surrounding FLAIR-HI after initiation of bevacizumab, the region of RD increases and become more confluent suggesting worsening residual/recurrent tumor. Moreover, this increase in the region of RD is much more conspicuous on the RSI-CMs compared to the ADC. The bottom row depicts these changes on “change maps” (change in T1 post-contrast – pre-contrast) (I), change in FLAIR (J), change in ADC (K), and change in the RSI-CMs (L) with red-yellow indicating an increase in signal intensity and blue-cyan indicating a decrease in signal intensity. Of note, on the ADC change map (K) the area of increased RD is essentially masked by the decreased signal intensity within the region of surrounding FLAIR-HI.
Figure 6
Figure 6
Streamline tractography of the superior longitudinal fasciculus (SLF) for a 58-year old female with a right temporal lobe GBM projected onto baseline and follow-up FLAIR images. The left panel shows the RSI and DTI-based tractography at baseline in regions of edema, whereas the right panel shows data obtained using the same tractography algorithm once the edema had mostly resolved. The ipsilateral (red) and contralateral (green) 3-D renditions of the SLF are superimposed on axial and sagittal FLAIR slices collected at each time point. The GBM is shown in blue in the pre-operative image. With RSI, the SLF appears very similar at baseline and at follow-up. However, with DTI, the SLF appears thinner and truncated at baseline in regions of edema. Black arrows point to frontal and parietal regions of the SLF that terminate completely in regions of edema and the red arrow shows the sparse streamlines in the temporal portion of the SLF. These streamlines are “recovered” using DTI once the edema resolves.
Figure 7
Figure 7
Comparison of 55 year old male with GBM treated with chemoradiation and bevacizumab (top row) and 66 year old male with GBM prior to any treatment (bottom row). T1 post-contrast images (A, D), RSI maps (B, E), and rCBV maps (C, F) are shown. Degree and homogeneity of restricted diffusion is greater in the patient treated with bevacizumab than in the pre-treatment GBM control (images scaled identically with same window and level), whereas rCBV in the region of restricted diffusion is remarkably low in the patient treated with bevacizumab—lower than in the GBM control and lower than in the NAWM.
Figure 8
Figure 8
3-plane map and histogram of the RMS displacement of voxels (in mm) due to B0 distortions for axially acquired EPI images (A/P phase encoding) from EPI scans of a 40 normal healthy subjects.
Figure 9
Figure 9
Gleason 3+4. A) Histology section stained with hematoxylin and eosin. The blue dotted line indicates the boundary of the tumor B) RSI Cellularity map, color-coded and overlaid on T2; C) ADC image; D) T2 image; E) 3D volume rendering of the RSI (in yellow), the whole extent of the prostate as traced on T2 images (translucent blue), and green lines indicating the boundary of the tumor on each of the whole mount histological sections that were compared with the RSI. The white arrow indicates the line corresponding to the histology section shown in A); F) Raw perfusion data.

References

    1. Sugahara T, Korogi Y, Kochi M, Ikushima I, Shigematu Y, Hirai T, et al. Usefulness of diffusion-weighted MRI with echo-planar technique in the evaluation of cellularity in gliomas. J Magn Reson Imaging. 1999;9:53–60. - PubMed
    1. Chen J, Xia J, Zhou YC, Xia LM, Zhu WZ, Zou ML, et al. Correlation between magnetic resonance diffusion weighted imaging and cell density in astrocytoma. Zhonghua Zhong Liu Za Zhi. 2005;27:309–11. - PubMed
    1. Guo AC, Cummings TJ, Dash RC, Provenzale JM. Lymphomas and high-grade astrocytomas: comparison of water diffusibility and histologic characteristics. Radiology. 2002;224:177–83. - PubMed
    1. Hilario A, Ramos A, Perez-Nunez A, Salvador E, Millan JM, Lagares A, et al. The added value of apparent diffusion coefficient to cerebral blood volume in the preoperative grading of diffuse gliomas. AJNR American journal of neuroradiology. 2012;33:701–7. - PMC - PubMed
    1. Server A, Kulle B, Maehlen J, Josefsen R, Schellhorn T, Kumar T, et al. Quantitative apparent diffusion coefficients in the characterization of brain tumors and associated peritumoral edema. Acta Radiol. 2009;50:682–9. - PubMed

Publication types

MeSH terms