

Frequency Selectivity of Voxel-by-Voxel Functional Connectivity in Human Auditory Cortex
- PMID: 25183885
- PMCID: PMC4677975
- DOI: 10.1093/cercor/bhu193
Frequency Selectivity of Voxel-by-Voxel Functional Connectivity in Human Auditory Cortex
Abstract
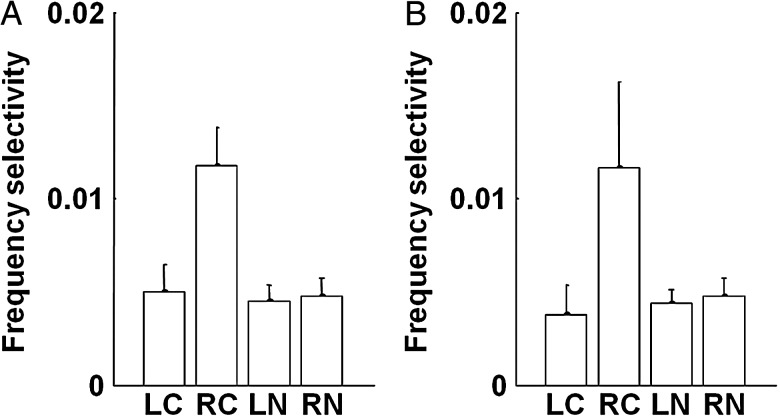
While functional connectivity in the human cortex has been increasingly studied, its relationship to cortical representation of sensory features has not been documented as much. We used functional magnetic resonance imaging to demonstrate that voxel-by-voxel intrinsic functional connectivity (FC) is selective to frequency preference of voxels in the human auditory cortex. Thus, FC was significantly higher for voxels with similar frequency tuning than for voxels with dissimilar tuning functions. Frequency-selective FC, measured via the correlation of residual hemodynamic activity, was not explained by generic FC that is dependent on spatial distance over the cortex. This pattern remained even when FC was computed using residual activity taken from resting epochs. Further analysis showed that voxels in the core fields in the right hemisphere have a higher frequency selectivity in within-area FC than their counterpart in the left hemisphere, or than in the noncore-fields in the same hemisphere. Frequency-selective FC is consistent with previous findings of topographically organized FC in the human visual and motor cortices. The high degree of frequency selectivity in the right core area is in line with findings and theoretical proposals regarding the asymmetry of human auditory cortex for spectral processing.
Keywords: frequency selectivity; functional connectivity; functional magnetic resonance imaging; functional organization; human auditory cortex.
© The Author 2014. Published by Oxford University Press. All rights reserved. For Permissions, please e-mail: journals.permissions@oup.com.
Figures
Similar articles
-
Functional connectivity as revealed by spatial independent component analysis of fMRI measurements during rest.Hum Brain Mapp. 2004 Jul;22(3):165-78. doi: 10.1002/hbm.20022. Hum Brain Mapp. 2004. PMID: 15195284 Free PMC article.
-
Functional connectivity corresponding to the tonotopic differentiation of the human auditory cortex.Hum Brain Mapp. 2018 May;39(5):2224-2234. doi: 10.1002/hbm.24001. Epub 2018 Feb 7. Hum Brain Mapp. 2018. PMID: 29417705 Free PMC article.
-
Modulation of Functional Connectivity in Auditory-Motor Networks in Musicians Compared with Nonmusicians.Cereb Cortex. 2017 May 1;27(5):2768-2778. doi: 10.1093/cercor/bhw120. Cereb Cortex. 2017. PMID: 27166170
-
Modulation of resting state functional connectivity of the motor network by transcranial pulsed current stimulation.Brain Connect. 2014 Apr;4(3):157-65. doi: 10.1089/brain.2013.0196. Epub 2014 Apr 9. Brain Connect. 2014. PMID: 24593667
-
Feature-dependent intrinsic functional connectivity across cortical depths in the human auditory cortex.Sci Rep. 2018 Sep 5;8(1):13287. doi: 10.1038/s41598-018-31292-x. Sci Rep. 2018. PMID: 30185951 Free PMC article.
Cited by
-
Neural Correlates of Early Sound Encoding and their Relationship to Speech-in-Noise Perception.Front Neurosci. 2017 Aug 25;11:479. doi: 10.3389/fnins.2017.00479. eCollection 2017. Front Neurosci. 2017. PMID: 28890684 Free PMC article.
-
High gamma cortical processing of continuous speech in younger and older listeners.Neuroimage. 2020 Nov 15;222:117291. doi: 10.1016/j.neuroimage.2020.117291. Epub 2020 Aug 21. Neuroimage. 2020. PMID: 32835821 Free PMC article.
-
Impact of Antiepileptic Drugs on Cognition and Neuromagnetic Activity in Childhood Epilepsy With Centrotemporal Spikes: A Magnetoencephalography Study.Front Hum Neurosci. 2021 Sep 10;15:720596. doi: 10.3389/fnhum.2021.720596. eCollection 2021. Front Hum Neurosci. 2021. PMID: 34566605 Free PMC article.
-
Changes in white matter functional networks during wakefulness and sleep.Hum Brain Mapp. 2022 Oct 1;43(14):4383-4396. doi: 10.1002/hbm.25961. Epub 2022 May 26. Hum Brain Mapp. 2022. PMID: 35615855 Free PMC article.
-
Topographical functional connectivity patterns exist in the congenitally, prelingually deaf.Sci Rep. 2016 Jul 18;6:29375. doi: 10.1038/srep29375. Sci Rep. 2016. PMID: 27427158 Free PMC article.
References
-
- Ashburner J, Friston K. 1997. Multimodal image coregistration and partitioning—a unified framework. Neuroimage. 6:209–217. - PubMed
-
- Averbeck BB, Latham PE, Pouget A. 2006. Neural correlations, population coding and computation. Nat Rev Neurosci. 7:358–366. - PubMed
-
- Averbeck BB, Lee D. 2006. Effects of noise correlations on information encoding and decoding. J Neurophysiol. 95:3633–3644. - PubMed
Publication types
MeSH terms
Grants and funding
LinkOut - more resources
Full Text Sources
Other Literature Sources
