. 2014 Aug 28:2:12.
doi: 10.1186/2049-3002-2-12. eCollection 2014.

Metformin directly acts on mitochondria to alter cellular bioenergetics

Affiliations

Metformin directly acts on mitochondria to alter cellular bioenergetics

Sylvia Andrzejewski et al. Cancer Metab. .

Abstract

Background: Metformin is widely used in the treatment of diabetes, and there is interest in 'repurposing' the drug for cancer prevention or treatment. However, the mechanism underlying the metabolic effects of metformin remains poorly understood.

Methods: We performed respirometry and stable isotope tracer analyses on cells and isolated mitochondria to investigate the impact of metformin on mitochondrial functions.

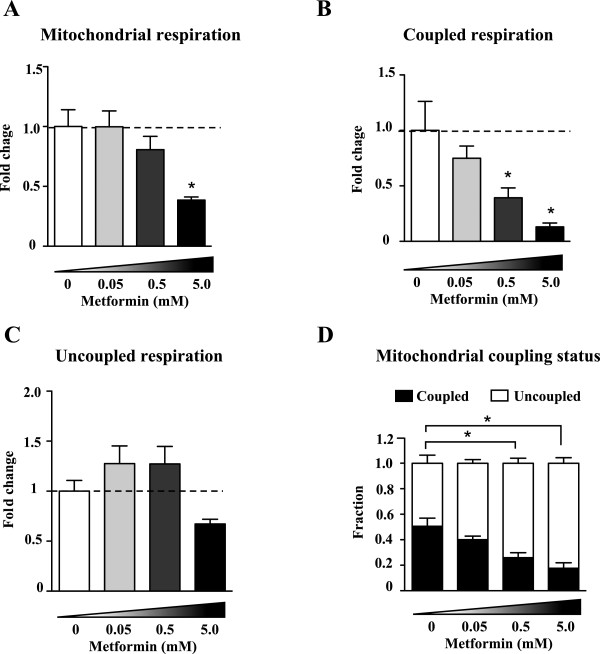
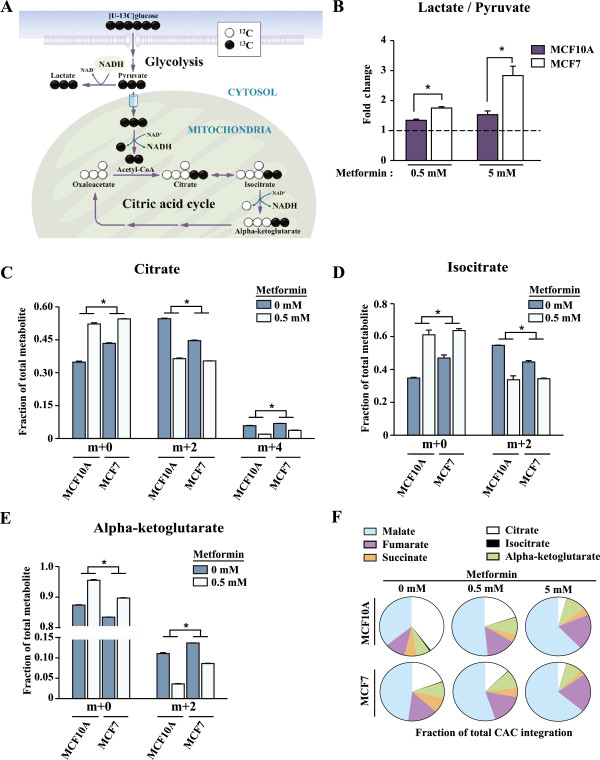
Results: We show that metformin decreases mitochondrial respiration, causing an increase in the fraction of mitochondrial respiration devoted to uncoupling reactions. Thus, cells treated with metformin become energetically inefficient, and display increased aerobic glycolysis and reduced glucose metabolism through the citric acid cycle. Conflicting prior studies proposed mitochondrial complex I or various cytosolic targets for metformin action, but we show that the compound limits respiration and citric acid cycle activity in isolated mitochondria, indicating that at least for these effects, the mitochondrion is the primary target. Finally, we demonstrate that cancer cells exposed to metformin display a greater compensatory increase in aerobic glycolysis than nontransformed cells, highlighting their metabolic vulnerability. Prevention of this compensatory metabolic event in cancer cells significantly impairs survival.

Conclusions: Together, these results demonstrate that metformin directly acts on mitochondria to limit respiration and that the sensitivity of cells to metformin is dependent on their ability to cope with energetic stress.

Keywords: Cancer; Citric acid cycle; Complex I; Metabolism; Metformin; Mitochondria; Respiration.


Figures

Figure 1
Figure 1
Mitochondrial respiration in cancer cells is more uncoupled from ATP production than that in nontransformed cells. Aerobic glycolysis and mitochondrial respiration were quantified in murine breast cancer cells (NT2196) and parental controls (NMuMG) as well as in human breast cancer cells (MCF7) and nontransformed controls (MCF10A). (A) Glucose consumption and (B) lactate production in cancer cells are presented as fold change from controls. (C) Total mitochondrial respiration, (D) coupled respiration and (E) uncoupled respiration in cancer cells are presented as fold change from controls. (F) The fraction of mitochondrial respiration devoted to coupled and uncoupled respiration was calculated by dividing the rate of coupled or uncoupled respiration by that of total mitochondrial respiration. Coupled respiration is the respiration used to drive ATP synthesis. Uncoupled respiration is used to drive proton leak reactions. Data are presented as means ± SEM. n = 3. *P <0.05, Students t-test, where * represents a significant change from nontransformed controls.
Figure 2
Figure 2
Dose-dependent effects of metformin on mitochondrial respiration. (A) Total, (B) coupled and (C) uncoupled respiration in MCF7 cells after 24 hours of treatment with ddH2O (control) or metformin of varying concentrations (0.05, 0.5 and 5.0 mM). Fold change represents the change in respiration from untreated samples. (D) The fraction of mitochondrial respiration devoted to coupled and uncoupled respiration was calculated as in Figure 1. Data are presented as means ± SEM. n = 4 to 5. *P <0.05, One-way ANOVA followed by a Dunnet’s multiple comparison test.
Figure 3
Figure 3
Sensitivity of cells to metformin is dependent on the capacity to engage in aerobic glycolysis. (A-B) Total respiration is presented as fold change upon metformin treatment (0.5mM) from untreated conditions. (C-D) The mitochondrial coupling status represents coupled and uncoupled respiration as a fraction of total mitochondrial respiration, for both untreated and treated conditions. (E-F) Glucose consumption, (G-H) lactate production and (I-J) live cell counts of cells treated with metformin (5 mM) for either 24 or 48 hours are represented as a fold change from untreated conditions. (K) Mitochondrial respiration of MCF7 cells grown in glucose or galactose media in the presence of ddH20 (control) or metformin (0.5 mM) for 24 hours. Data are normalized to the respiration rate of MCF7 cells in the presence of glucose without metformin. (L) The fractions of mitochondrial respiration devoted to coupled and uncoupled respiration were calculated as in C-D. (M) Live cell counts for MCF7 cells cultured in galactose media with treatment of metformin (0.5 or 5.0 mM) for periods of 24, 48 and 72 hours, are represented as a fold change from untreated conditions. For (A-D), Data are presented as means ± SEM. n = 4, where *P <0.05, Student’s t-test. For (E-J,L,M), data are presented as means ± SEM. n = 3, # and *P <0.05, Student’s t-test, where * represents a significant change from untreated conditions and # represents a significant change between indicated cell lines. For (K), data are presented as means ± SEM. n = 3, # and *P <0.05, Student’s t-test, where * represents a significant change from the respiration rate of MCF7 cells in the presence of glucose without metformin, while # represents a significant change from the respiration rate of MCF7 cells in the presence of galactose without metformin.
Figure 4
Figure 4
Metformin reduces glucose metabolism through the citric acid cycle. (A) Schematic depicting glucose carbon flow into glycolysis and the citric acid cycle (CAC). The usage of tracer metabolites such as [U-13C]glucose where all carbons (12C, white) are replaced by 13C (black circles) allows for the measurement of CAC activity by gas chromatography/mass spectrometry (GC/MS) analysis and isotopomer enrichments. (B-F) MCF7 and MCF10A cells were treated with ddH2O (control) or metformin (0.5 mM or 5.0 mM) for 24 hours. Cells were then incubated with [U-13C]glucose (m + 6) for 1 hour. (B) Intracellular lactate to pyruvate ratio induced by metformin treatment, displayed as fold change from untreated conditions. (C) Enrichment of citrate (m + 2) and (m + 4), (D), isocitrate (m + 2) (E) and alpha-ketoglutarate (m + 2) upon incubation with [U-13C]glucose and quantified as mass isotopomer distributions. (F) CAC intermediates reorganization upon metformin treatment. The sum of the ion intensities for all the isotopomers of each individual CAC intermediate was normalized to the sum of the ion intensities for all the isotopomers of all combined CAC intermediates. For B-E, data are presented as mean ± SEM of a representative experiment performed in triplicate of three independent experiments for control and 0.5 mM metformin treatments, and two independent experiments for 5.0 mM metformin treatment. *P <0.05, Student’s t-test. For F, data are presented as mean of a representative experiment performed in triplicate of three independent experiments for control and 0.5 mM metformin treatments, and two independent experiments for 5.0 mM metformin treatment. CAC: citric acid cycle.
Figure 5
Figure 5
Metformin directly acts on mitochondria to inhibit respiration. (A-B) Design of experiments with isolated mitochondria from murine skeletal muscle. Mitochondria were incubated with either complex I (malate and pyruvate) or complex II (succinate and rotenone) substrates. Typical respiratory control ratio (RCR) values are shown for mitochondria respiring on either complex I or II substrates. Respiration in the presence of substrates is called state 2. Respiration in the presence of ADP where mitochondria are using ADP to make ATP is called state 3. Respiration in the presence of oligomycin where mitochondria are driving proton leak reactions is called state 4. FCCP stimulates uncoupled respiration and represents the maximal respiratory capacity. RCR values are calculated by dividing the rate of respiration in state 3 by that in state 4 and are indicative of the integrity of the mitochondrial suspensions. (C-F) Mitochondria isolated from murine skeletal muscle were incubated with complex I (C,E) or complex II (D,F) substrates and treated with ddH2O (control) or metformin (2 mM) (E-F). Respiration rates are expressed as the fold difference from untreated mitochondria. Data are presented as means ± SEM. n = 3. *P <0.05, Student’s t-test.
Figure 6
Figure 6
Metformin inhibits citric acid cycle activity in isolated mitochondria. Mitochondria were incubated with [U-13C]pyruvate (m + 3) and unlabeled malate in the presence of ddH2O (control) or metformin (5 mM) for 30 minutes. (A) Schematic depicting stable isotope tracer experiment where substrates used are uniformly labeled [U-13C]pyruvate and unlabeled malate. The metabolites analyzed in B-E are placed into gray boxes where the isotopic enrichment is written as m + k where k is the number of 13C (black circles). (B) Enrichment of lactate (m + 3), (C), citrate (m + 2), (D) alpha-ketoglutarate (m + 2) and (E) succinate (m + 2) as evaluated by GC/MS analysis of mass distributions. Data are expressed as normalized ion amount which represents values obtained from mass isotopomer distribution (MID) × corrected area. Data are presented as means ± SEM. n = 3. *P <0.05, Student’s t-test (m + 2 or m + 3). #P <0.05, Student’s t-test (m + 0).
Figure 7
Figure 7
Metformin directly acts on mitochondria and shifts the balance between coupling and uncoupling reactions. Metformin is transported into cells through the OCT family of transporters, where it acts on mitochondria to inhibit complex I-dependent respiration and increase the proportion of uncoupled respiration. Cells respond by increasing glycolysis, ultimately leading to increased lactate production.

Comment in

References

    1. Bosi E. Metformin–the gold standard in type 2 diabetes: what does the evidence tell us? Diabetes Obes Metab. 2009;11(Suppl 2):3–8. - PubMed
    1. Campbell RK, White JR Jr, Saulie BA. Metformin: a new oral biguanide. Clin Ther. 1996;18:360–371. doi: 10.1016/S0149-2918(96)80017-8. discussion 359. - DOI - PubMed
    1. Turner RC. The U.K. Prospective diabetes study. A review. Diabetes Care. 1998;21(Suppl 3):C35–C38. - PubMed
    1. Evans JM, Donnelly LA, Emslie-Smith AM, Alessi DR, Morris AD. Metformin and reduced risk of cancer in diabetic patients. BMJ. 2005;330:1304–1305. doi: 10.1136/bmj.38415.708634.F7. - DOI - PMC - PubMed
    1. Giovannucci E, Harlan DM, Archer MC, Bergenstal RM, Gapstur SM, Habel LA, Pollak M, Regensteiner JG, Yee D. Diabetes and cancer: a consensus report. CA Cancer J Clin. 2010;60:207–221. doi: 10.3322/caac.20078. - DOI - PubMed