Review
. 2014 Sep 2;19(9):13643-82.
doi: 10.3390/molecules190913643.

1H-NMR as a structural and analytical tool of intra- and intermolecular hydrogen bonds of phenol-containing natural products and model compounds

Affiliations
Review

1H-NMR as a structural and analytical tool of intra- and intermolecular hydrogen bonds of phenol-containing natural products and model compounds

Pantelis Charisiadis et al. Molecules. .

Abstract

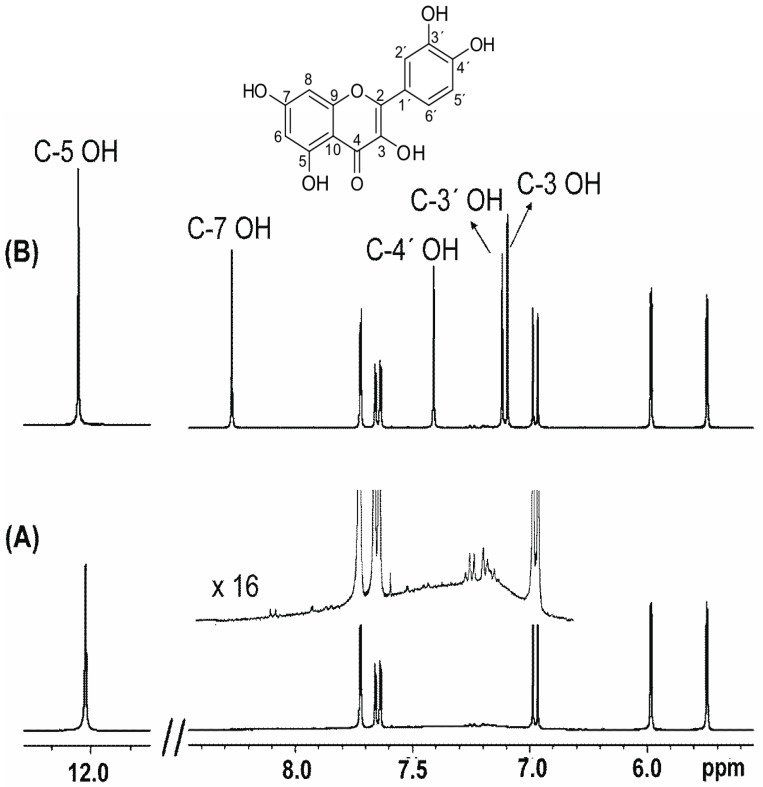
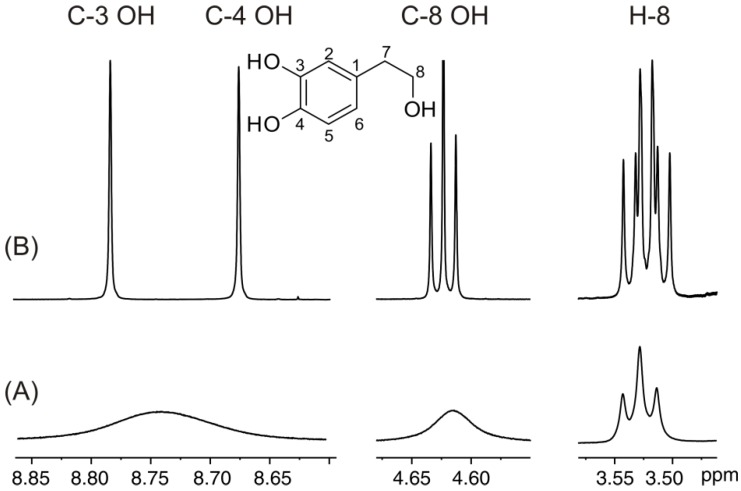
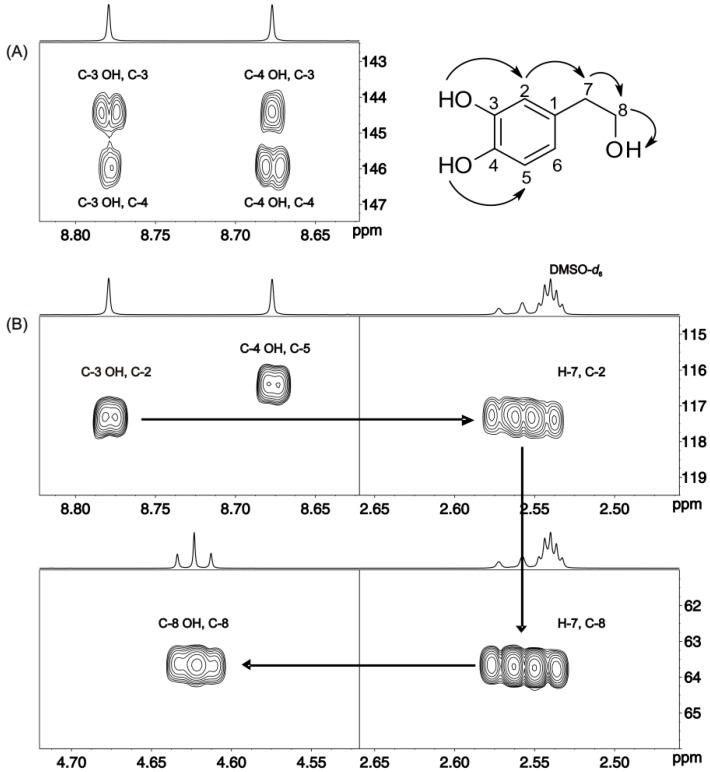
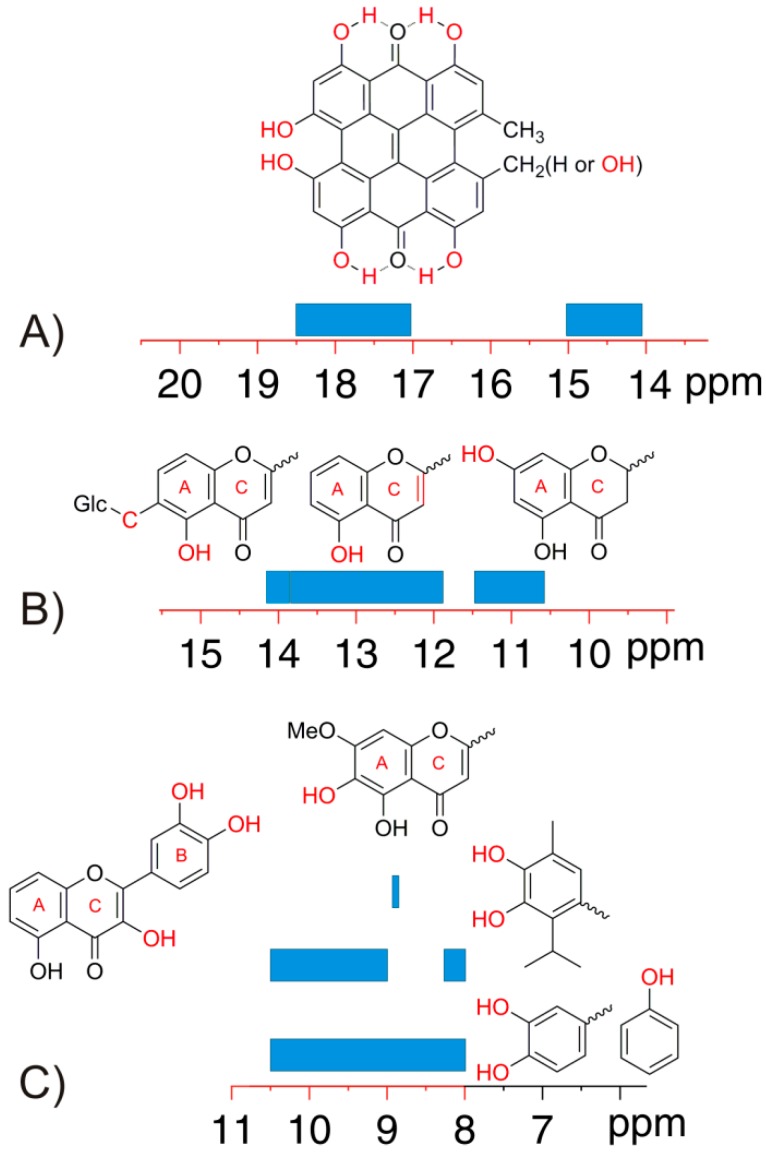
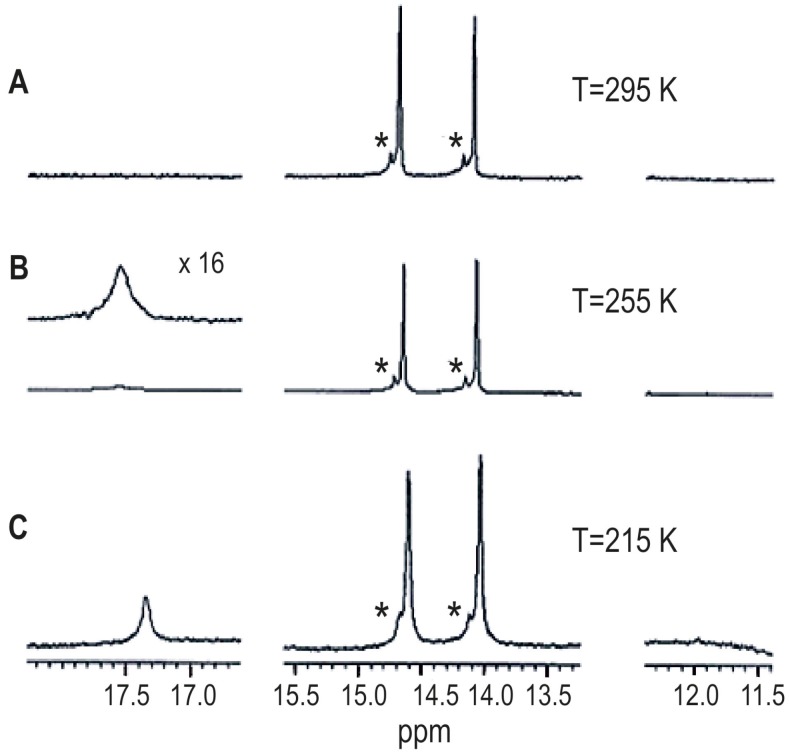
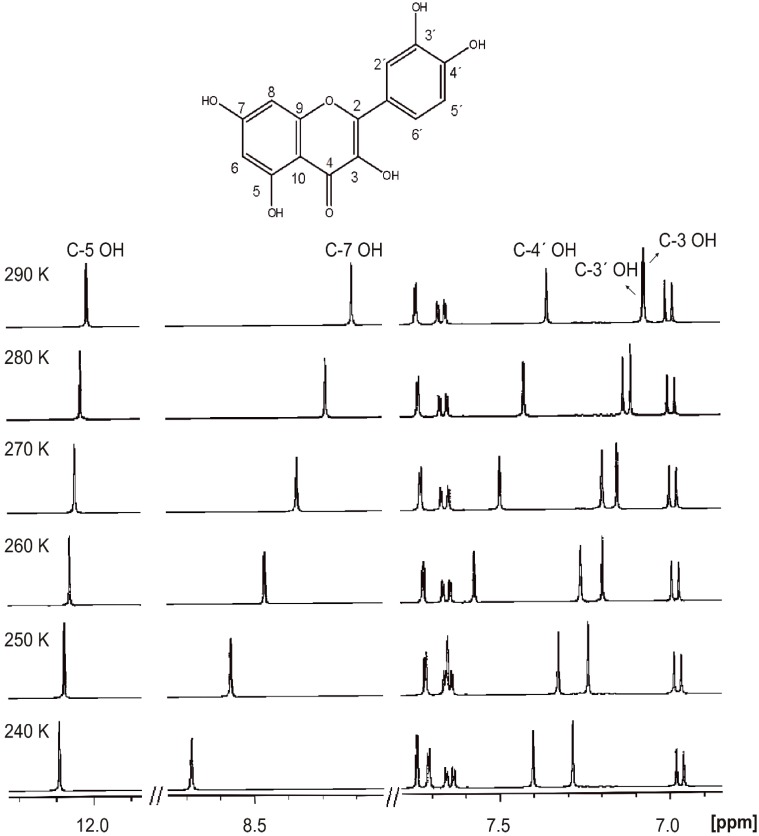
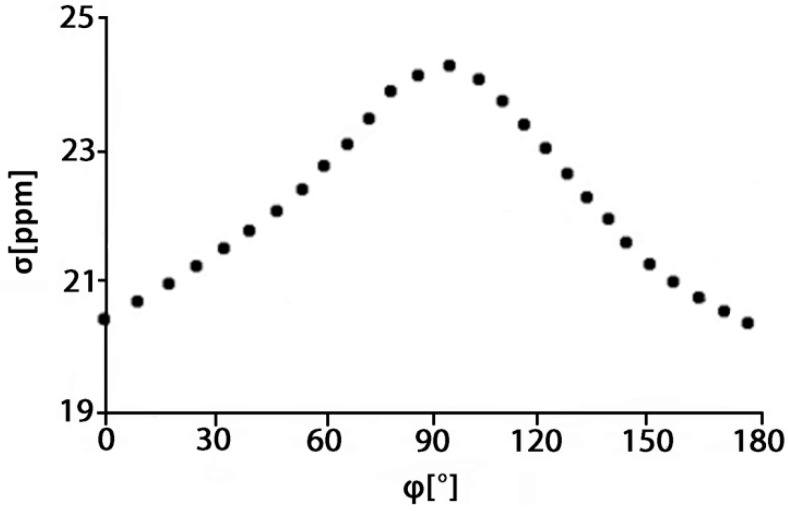
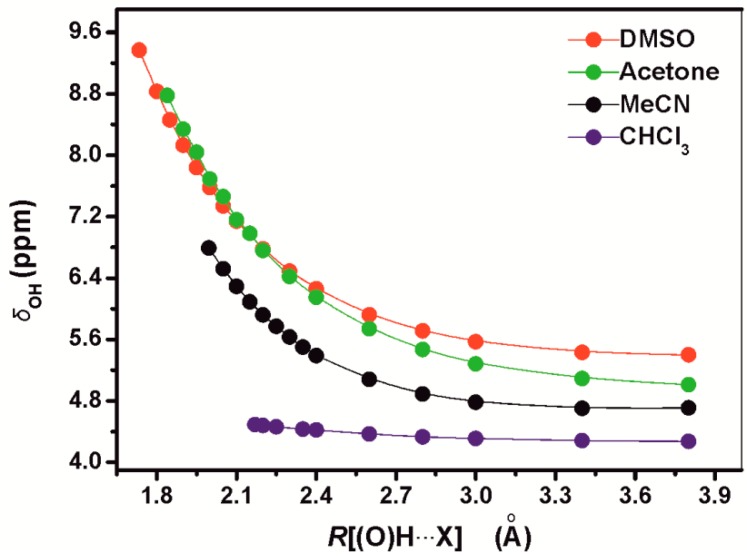
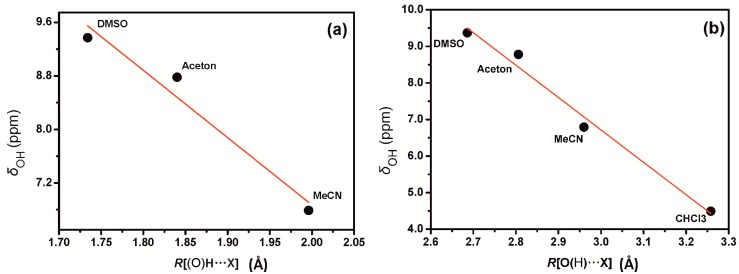
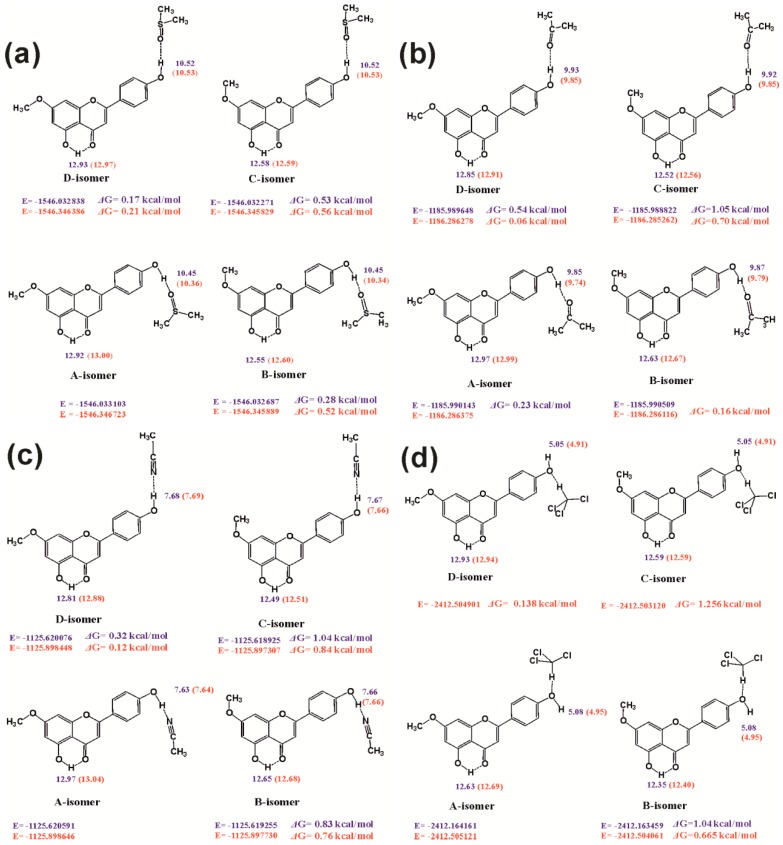
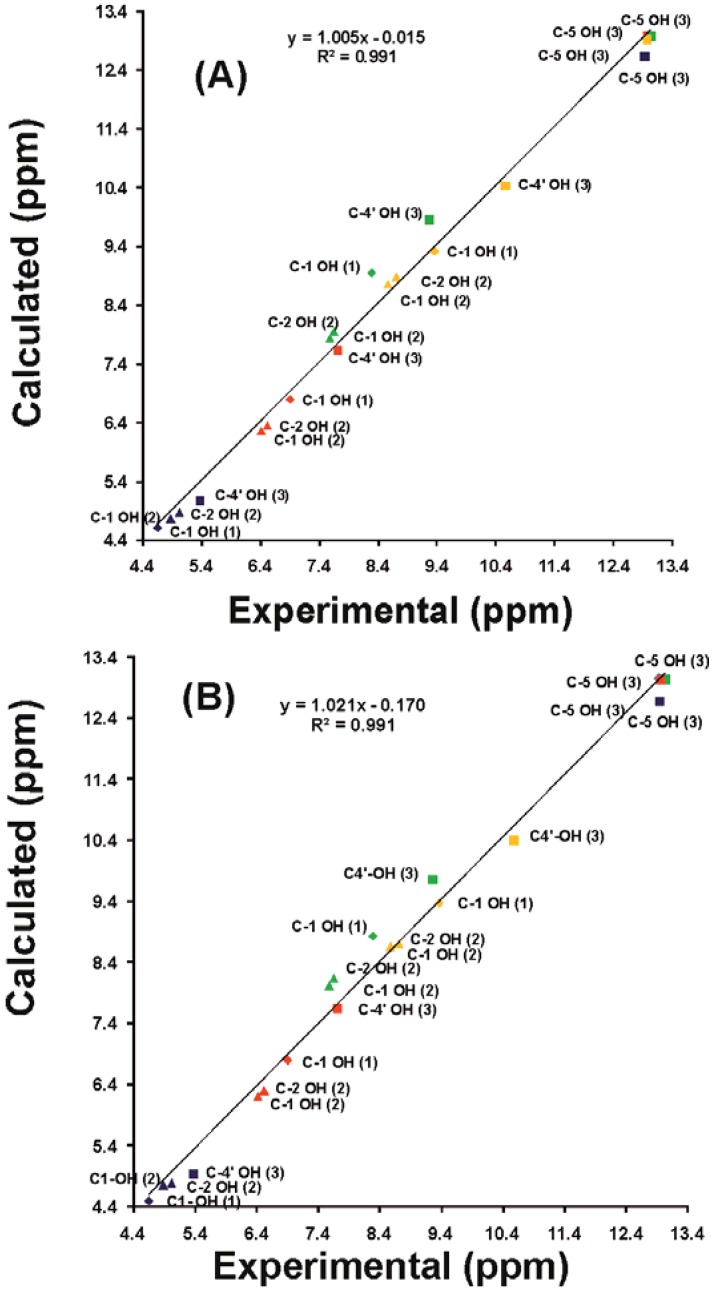
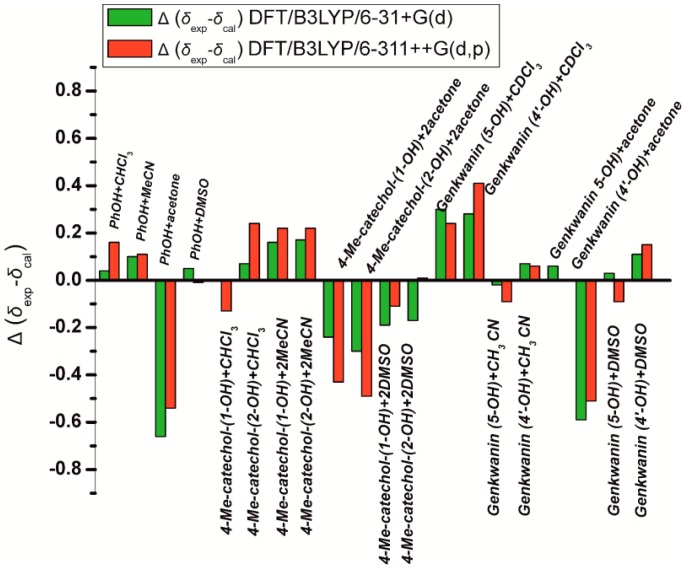
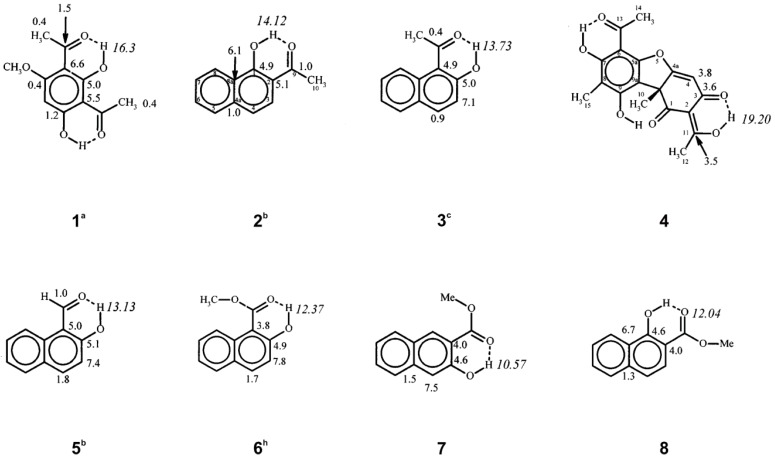
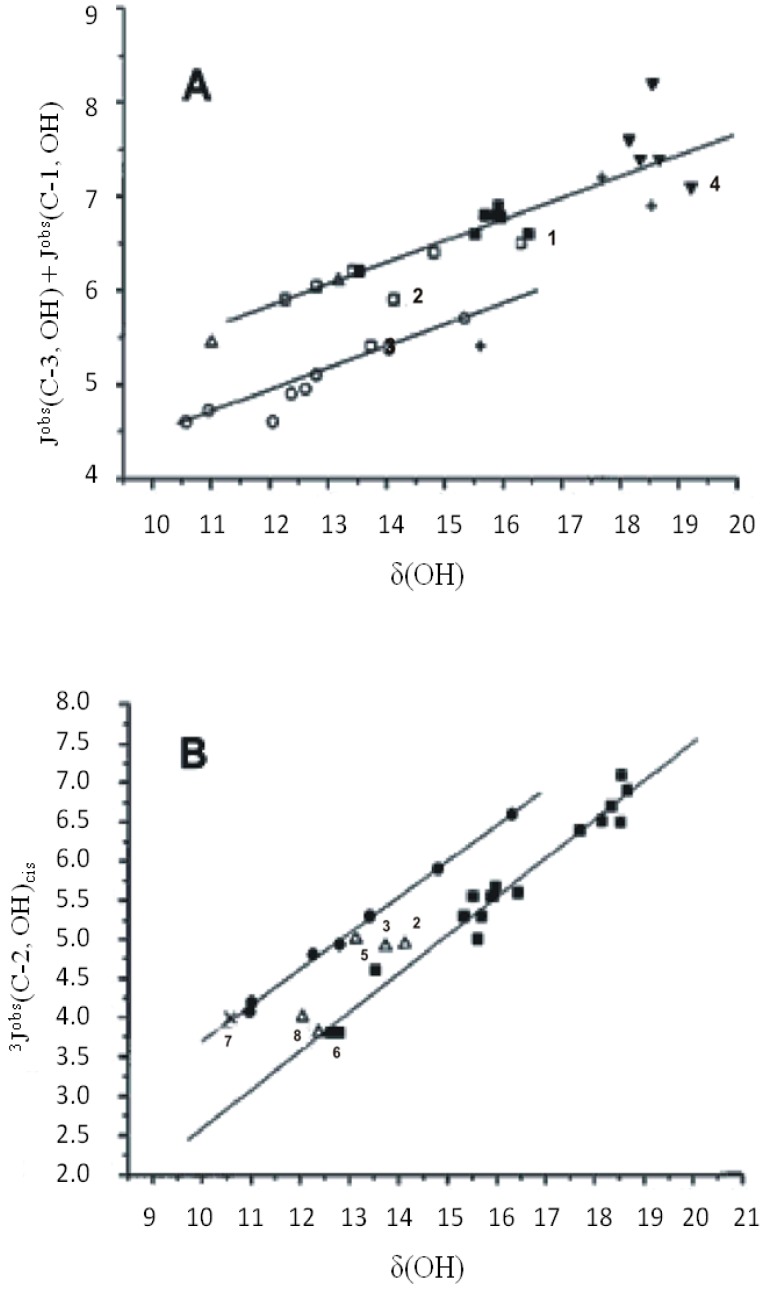
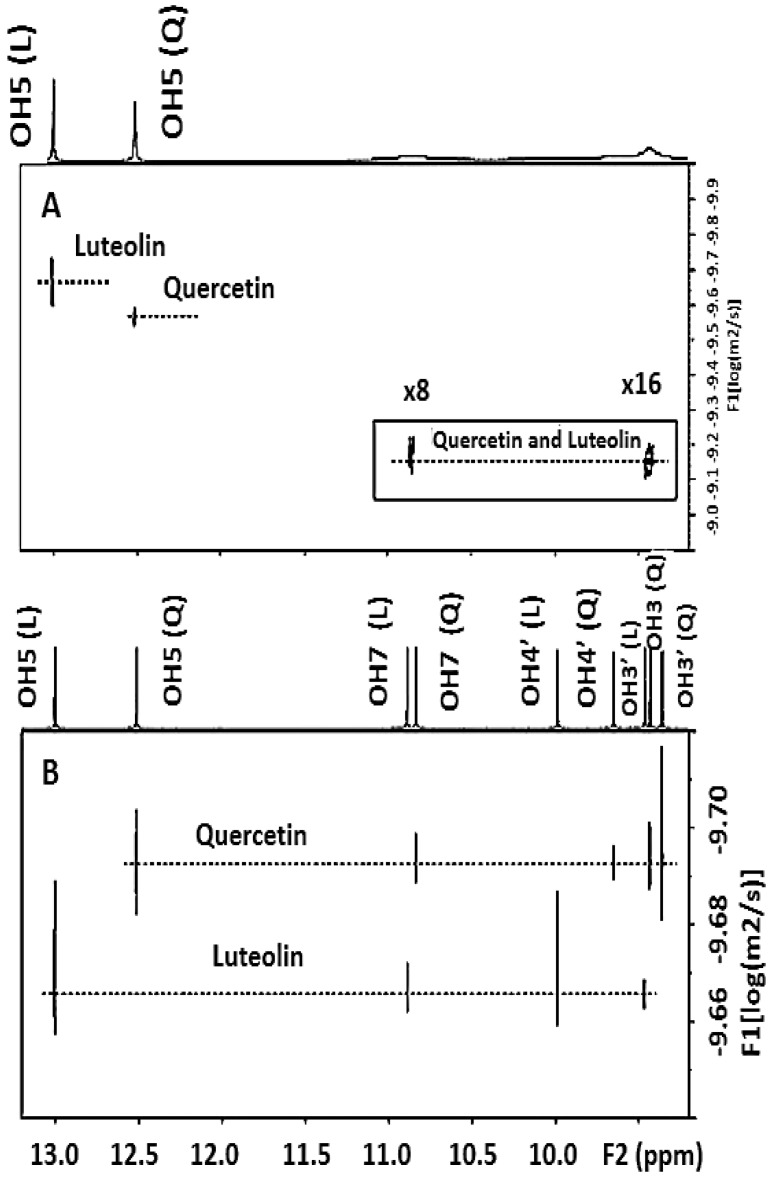
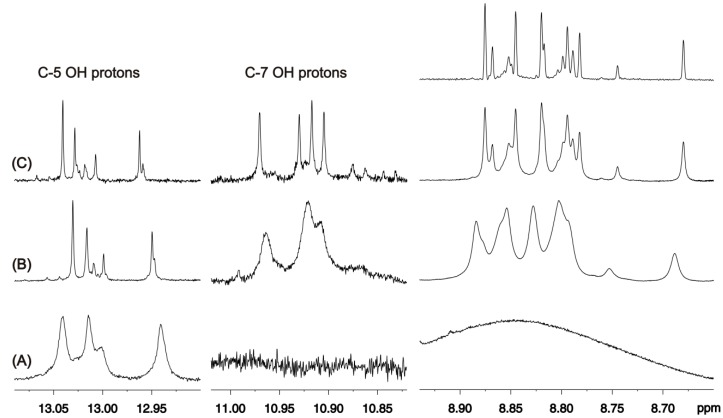
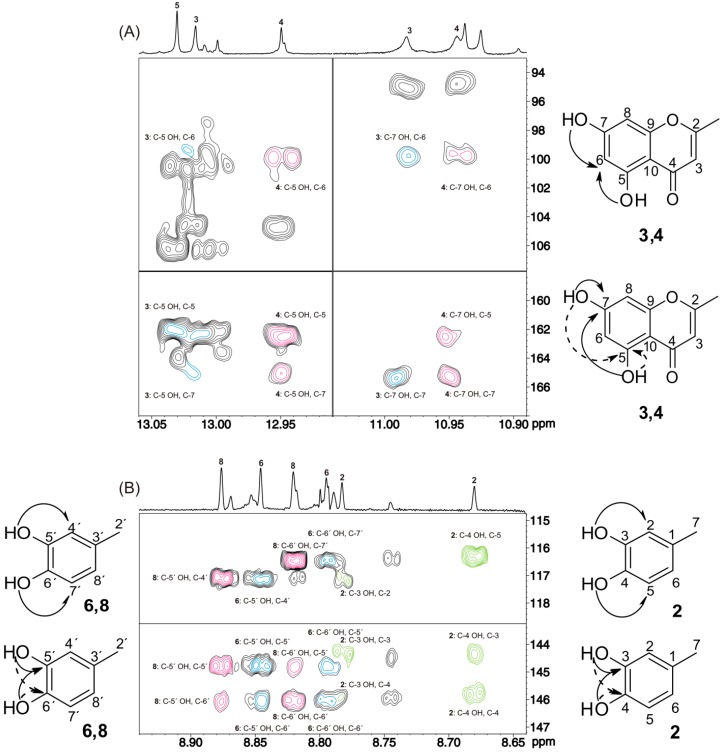
Experimental parameters that influence the resolution of 1H-NMR phenol OH signals are critically evaluated with emphasis on the effects of pH, temperature and nature of the solvents. Extremely sharp peaks (Δν1/2≤2 Hz) can be obtained under optimized experimental conditions which allow the application of 1H-13C HMBC-NMR experiments to reveal long range coupling constants of hydroxyl protons and, thus, to provide unequivocal assignment of the OH signals even in cases of complex polyphenol natural products. Intramolecular and intermolecular hydrogen bonds have a very significant effect on 1H OH chemical shifts which cover a region from 4.5 up to 19 ppm. Solvent effects on -OH proton chemical shifts, temperature coefficients (Δδ/ΔT), OH diffusion coefficients, and nJ(13C, O1H) coupling constants are evaluated as indicators of hydrogen bonding and solvation state of phenol -OH groups. Accurate 1H chemical shifts of the OH groups can be calculated using a combination of DFT and discrete solute-solvent hydrogen bond interaction at relatively inexpensive levels of theory, namely, DFT/B3LYP/6-311++G (2d,p). Excellent correlations between experimental 1H chemical shifts and those calculated at the ab initio level can provide a method of primary interest in order to obtain structural and conformational description of solute-solvent interactions at a molecular level. The use of the high resolution phenol hydroxyl group 1H-NMR spectral region provides a general method for the analysis of complex plant extracts without the need for the isolation of the individual components.


Conflict of interest statement

The authors declare no conflict of interest.

Figures

Figure 1
Figure 1
Effect of pH on lnkinter, where kinter is the intermolecular proton exchange rate, for various functional groups in peptides and proteins. Adapted with permission from [15]. Copyright 1986, by John Wiley & Sons.
Figure 2
Figure 2
500 MHz 1D 1H-NMR spectra of the hydroxyl group region of caffeic acid (1) (C = 5.7 × 10⁻³ M, T = 292 K, number of scans = 32), in (A) DMSO-d6; upper trace: simulated line-shapes with two Lorentzian peaks for C-4 OH and C-3 OH having line-widths of 203 Hz and 164 Hz, respectively, using the Bruker peak-fitting routine; (B) and (C) with a molar ratio [picric acid]/[caffeic acid] of 12 × 10−3 and 219 × 10−3, respectively. Reproduced with permission from [16]. Copyright 2001, by the American Chemical Society.
Figure 3
Figure 3
Variable temperature 400 MHz 1H-NMR spectra of quercetin in CD3OH, concentration 10 mM. Reproduced with permission from [20]. Copyright 2002, by Elsevier Science Ltd. (Amsterdam, The Netherlands).
Figure 4
Figure 4
1H-NMR spectra (500 MHz) of oleuropein 6-O-β-d-glucopyranoside, concentration 5 mM (T = 292 K, number of scans = 64, experimental time = 8 min) in (A) DMSO-d6; (B) acetone-d6, upper trace after the addition of 2 μL picric acid, 8 mM in acetone-d6; and (C) CD3CN, upper trace after the addition of 2 μL picric acid, 8 mM in CD3CN. Reprinted with permission from [25]. Copyright 2013, The Royal Society of Chemistry.
Figure 5
Figure 5
1H-NMR spectra (400 MHz) of quercetin, concentration 5 mM (T = 280 K, number of scans = 32, experimental time = 4 min) in (A) CD3CN, upper trace after vertical expansion (×16), and (B) the same solution as in (A) with the presence of 2 μL picric acid, 8 mM. Reprinted with permission from [25]. Copyright 2013, The Royal Society of Chemistry.
Figure 6
Figure 6
500 MHz 1D 1H-NMR spectra of hydroxytyrosol (C = 19.6 × 10⁻³ M, T = 288 K, number of scans = 16), in (A) DMSO-d6; (B) with a molar ratio of [picric acid]/[hydroxytyrosol] of 1.3 × 10⁻³. Reproduced with permission from [16]. Copyright 2011, by the American Chemical Society.
Figure 7
Figure 7
Selected regions of the 500 MHz 2D 1H-13C HMBC-NMR spectrum of the solution of Figure 6B (T = 288 K, number of scans = 8, experimental time = 1 h). The experiment was optimized for nJ (1H, 13C) values for 6 to 8 Hz. Reproduced with permission from [16]. Copyright 2011, by the American Chemical Society.
Scheme 1
Scheme 1
Chemical structure of oleuropein, 20, hydroxytyrosol, 21, rosmarinic acid, 22, caffeic acid, 23, carvacrol, 24, p-cymene-2,3-diol, 25, and p-cymene-2,3-diol 6-6′ dimer, 26 [25].
Figure 8
Figure 8
Classification of the chemical shifts of the –OH groups in DMSO-d6 on the basis of the structure of the molecule and the nature of the substituent in the rings. (A), (B) and (C) are the 15–20 ppm, 10–15 ppm, and 8–10 ppm regions, respectively.
Figure 9
Figure 9
meso-Napthodianthrone skeleton-Q7,14 (1), 7,14-dioxo tautomer of hypericin (2), and 1,6-dioxo tautomer (3) [31].
Figure 10
Figure 10
Variable temperature gradient 1H-NMR spectra of hypericin in MeOH-d3 (anionic form 4): number of scans 64, 762 and 1312 for A, B and C, respectively. The asterisk denotes an unknown compound. Reprinted with permission from [31]. Copyright 2002, by Elsevier Science Ltd. (Amsterdam, The Netherlands).
Figure 11
Figure 11
Solvent dependent equilibrium of 7,14 -dioxo tautomer of hypericin HyH, Q7,14 (2), and its anionic stable form Hy (4) [31].
Figure 12
Figure 12
Variable temperature (400 MHz) 1H-NMR spectra of quercetin in CD3CN, concentration 5 mM, with the presence of 2 μL picric acid, 8 mM in CD3CN (number of scans = 32, experimental time = 4 min). Reprinted with permission from [25]. Copyright 2013, The Royal Society of Chemistry.
Figure 13
Figure 13
R–X═O•••H dihedral angle (ϕ) dependence of the nuclear shielding of the OH hydrogen of phenol. The hydrogen bond acceptor is acetone. Adapted with permission from [44]. Copyright 2007, by John Wiley & Sons, Ltd.
Figure 14
Figure 14
The dependence of the OH proton chemical shifts, δOH (ppm), of the 1:1 phenol + solvent complexes vs. the distance R[(O)H•••X] (X = O for DMSO (red) and acetone (green), X = N for MeCN (black), and X = C for CHCl3(blue). Reprinted with permission from [41]. Copyright 2013, The Royal Society of Chemistry.
Figure 15
Figure 15
The dependence of the OH proton chemical shift, δOH (ppm), in the minimum energy conformer, optimized at the DFT/B3LYP/6-311++G(d,p) level of theory, of 1:1 phenol + solvent complexes vs. R[(O)H•••X] (a) and R[O(H)•••X] (b) distances (X = O for DMSO and acetone, X = N for MeCN, and X = C for CHCl3). Reprinted with permission from [41]. Copyright 2013, The Royal Society of Chemistry.
Figure 16
Figure 16
The effect of conformation of the C-7 OCH3 and C-4′ OH groups on the chemical shifts of the C-4′OH and C-5 OH protons for the 1:1 complexes of (a) genkwanin + DMSO; (b) genkwanin + Me2CO; (c) genkwanin + MeCN and (d) genkwanin + CHCl3, with the use of DFT/B3LYP/6-31+G(d) (data in blue) and DFT/B3LYP/6-311++G(d,p) (data in red) level of theory. Reprinted with permission from [41]. Copyright 2013, The Royal Society of Chemistry.
Figure 17
Figure 17
Calculated (at the GIAO DFT/B3LYP/6-311++G(2d,p) level of theory) vs. experimental values of the chemical shifts of the –OH protons of phenol, 4-methylcatehol and genkwanin in different solvents with minimization of the solvation complexes at the DFT/B3LYP/6-31+G(d) (A) and DFT/B3LYP/6-311++G(d,p) (B) level of theory. Reprinted with permission from [41]. Copyright 2013, The Royal Society of Chemistry.
Figure 18
Figure 18
Histogram of the errors Δ(δexpδcal) of the calculated (at the GIAO DFT/B3LYP/6-311++ G(2d,p) level of theory) 1H OH chemical shifts with minimization of the solvation complexes at the DFT/B3LYP/6-31+G(d) and DFT/B3LYP/6-311++G(d,p) level of theory. Reprinted with permission from [41]. Copyright 2013, The Royal Society of Chemistry.
Figure 19
Figure 19
Observed OH chemical shifts (ppm) and nJ(13C, O1H) coupling constants (Hz). a 300 K. b 265 K. c 250 K. h 290 K [50].
Figure 20
Figure 20
Plot of the Jobs(C-3, OH) + Jobs(C-1, OH) vs δ(OH). (A) □, ketones; ○, esters; ■, diketones; ▼, triketones; ∆, aldehydes; +, amides. (B) ■, Olefinic; ●, o-hydroxyacylbenzes; ∆, 1,2-disubstituted napthlalenes; X, 2,3-disubstituted napthlalenes. The numbers refer to the compounds of Figure 19. Adapted with permission [50]. Copyright 1998, John Willey & Sons.
Figure 21
Figure 21
Fine-tuning of quercetin (Q) and luteolin (L) (Table 2) diffusion values. 500 MHz 1H-NMR DOSY of a mixture of luteolin (3.7 mM) and quercetin (3.5 mM) in DMSO-d6 (289 K, Δ = 100 ms, δg = 4.8 ms, ns = 16, total experimental time 27 min). The insert indicates the hydroxyl protons at a lower contour level (×8 and ×16). (A) Without and (B) with the addition of 0.07 mM picric acid (molar ratio [picric acid]/[luteolin]~0.014 and [picric acid]/[quercetin] = 0.015). Reproduced with permission from [55]. Copyright 2012, by Elsevier Science Ltd. (Amsterdam, The Netherlands).
Figure 22
Figure 22
Selected regions of the 500 MHz 1D 1H-NMR spectra of 20 mg of an olive leaf methanol extract in 0.6 mL of DMSO-d6 (T = 288 K): (A) without the addition of picric acid; (B) with a mass ratio of [picric acid]/[extract] of 49.3 × 10⁻³; (C) the same solution as in (A) with a dilution factor of 8 and mass ratio of [picric acid]/[extract] of 49.4 × 10⁻³; upper trace, the same spectrum as in (C) with the application of Lorentz-to-Gauss transformation. Reproduced with permission from [16]. Copyright 2011, by the American Chemical Society.
Figure 23
Figure 23
500 MHz 2D 1H-13C HMBC-NMR spectrum of 10 mg of an olive leaf methanol extract in 0.6 mL of DMSO-d6 with a mass ratio of [picric acid]/[extract] of 49.3 × 10⁻³ (T = 288 K, number of scans = 88, experimental time = 11 h and 34 min). The experiment was optimized for nJ(1H, 13C) values of 6 to 8 Hz. (A) The common cross-peaks of the C-5 and C-7 hydroxyl protons to carbons C-6, C-5, and C-7 of luteolin-4′-O-β-d-glucopyranoside (4) and the common cross-peaks of the C-5 and C-7 hydroxyl protons to carbons C-6 and C-7 of luteolin (3) are illustrated in red and blue, respectively. (B) The common cross-peaks of the C-5′ and C-6′ hydroxyl protons to carbons C-4′ and C-7′, respectively (upper trace), and the common cross-peaks to carbons C-5′ and C-6′ (lower trace) are illustrated in blue for oleuropein 6-O-β-d-glucopyranoside (6), green for hydroxytyrosol (2), and red for oleuropein (aldehyde form) (8). Reproduced with permission from [16]. Copyright 2011, by the American Chemical Society.
Figure 24
Figure 24
Chemical structures of the compounds which were identified in olive leaf methanol and aqueous extracts [16].
Scheme 2
Scheme 2
Experimental protocol for sequential and carbon resonance assignments [16].
Figure 25
Figure 25
Selected region of 400 MHz 1H-NMR spectra of (A) hypericin; (B) pseudohypericin; (C) Hypericum perforatum extract with plant material from Epirus, Greece, and (D) dietary supplement. Number of scans: 1,024, acquisition time: 1.02 s, total experimental time: 102.7 min. P and H denote pseudohypericin and hypericin, respectively. Reproduced with permission from [72]. Copyright 2008, by Elsevier Science Ltd. (Amsterdam, The Netherlands).
Figure 26
Figure 26
Correlation between the OH temperature coefficient and chemical shift differences in different solvents (DMSO-d6, acetone-d6 and CD3CN) of hydroxyl protons of oleuropein, hydroxytyrosol, quercetin, kaempferol and genkwanin. The C-5 OH protons of the flavonoids implicated in intramolecular hydrogen bonding are well clustered in the upper left corner of the graph. Reprinted with permission from [25]. Copyright 2013, The Royal Society of Chemistry.

References

    1. Jeffrey G.A., Sanger S.W. Hydrogen Bonding in Biological Structures. Springer Verlag; Berlin, Germany: 1991.
    1. Scheider S. Hydrogen Bonding: A Theoretical Perspective. Oxford University Press; New York, NY, USA: 1997.
    1. Perrin C.L., Nielson J.B. “Strong” hydrogen bonds in chemistry and biology. Annu. Rev. Phys. Chem. 1997;48:511–544. doi: 10.1146/annurev.physchem.48.1.511. - DOI - PubMed
    1. Gilli P., Pretto L., Bertolasi V., Gilli G. Predicting hydrogen-bond strengths from acid-base molecular properties. The pKa slide rule: Toward the solution of a long-lasting problem. Acc. Chem. Res. 2009;42:33–44. doi: 10.1021/ar800001k. - DOI - PubMed
    1. Gunther H. NMR Spectroscopy: Basic Principles, Concepts and Applications in Chemistry. 2nd ed. John Wiley & Sons; Hoboken, NJ, USA: 1995.

Publication types

LinkOut - more resources