. 2014 Sep 3;6(252):252ra120.
doi: 10.1126/scitranslmed.3008791.

Breast-fed and bottle-fed infant rhesus macaques develop distinct gut microbiotas and immune systems

Affiliations

Breast-fed and bottle-fed infant rhesus macaques develop distinct gut microbiotas and immune systems

Amir Ardeshir et al. Sci Transl Med. .

Abstract

Diet has a strong influence on the intestinal microbiota in both humans and animal models. It is well established that microbial colonization is required for normal development of the immune system and that specific microbial constituents prompt the differentiation or expansion of certain immune cell subsets. Nonetheless, it has been unclear how profoundly diet might shape the primate immune system or how durable the influence might be. We show that breast-fed and bottle-fed infant rhesus macaques develop markedly different immune systems, which remain different 6 months after weaning when the animals begin receiving identical diets. In particular, breast-fed infants develop robust populations of memory T cells as well as T helper 17 (TH17) cells within the memory pool, whereas bottle-fed infants do not. These findings may partly explain the variation in human susceptibility to conditions with an immune basis, as well as the variable protection against certain infectious diseases.


Conflict of interest statement

Competing interests: S.V.L. consults for Janssen Pharmaceuticals and Theravance Biopharma and is on the Scientific Advisory Board of Second Genome. The other authors declare no competing interests.

Figures

Fig. 1
Fig. 1. Circulating TH17 cells throughout the macaque life span
(A) Percentage of TH17 cells among CD4+ T cells in peripheral blood, from birth to more than 9 years of age. Data points are connected by lines wherever they represent longitudinal samples from one animal. The curve shown is a loess curve plotted in R using a span value of 0.6. (B) Absolute numbers of circulating TH17 cells in rhesus macaques aged 17 to 62 months. The slight decrease seen is not significant in mixed-effects regression (P = 0.06). (C) Development of TH17 cells throughout the first 18 months of life. As in (A), the percentage of TH17 cells among CD4+ T cells in peripheral blood is shown. The curve shown is a loess curve; the increase shown is highly significant in mixed-effects regression (P < 0.00005).
Fig. 2
Fig. 2. Different gut microbiotas in dam-reared and nursery-reared animals at 6 and 12 months of age
(A) Richness, evenness, and Shannon index diversity are higher in dam-reared (DR) compared with nursery-reared (NR) animals. (B) Principal component analysis shows clear separation of NR and DR gut microbiotas at 6 and 12 months. Note that interindividual distances in these plots are generally reflective of Bray-Curtis dissimilarities. (C) Waterfall plot showing Δ abundance of taxa that are statistically different between rearing groups. Δ abundance is calculated by subtraction of average abundance in one rearing group from average abundance in another. (D) Abundance of genera based on pooled data from taxa assigned to each.
Fig. 3
Fig. 3. Dam-reared animals harbor robust TH17 cell populations
(A to D) Principal component analysis of immune cell abundances at (A) 5, (B) 6, (C) 9, and (D) 12 months, all plotted using loadings from the 12-month immune cell profile. (E) Heat map showing scaled values for various T cell subsets that were found to be statistically different between rearing groups. Animals (shown as columns) were clustered using hclust. (F) Populations of various immune cell subsets over time. Lines represent averages for rearing groups with SE brackets.
Fig. 4
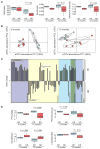
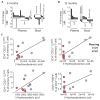
Fig. 4. Metabolomic profiles differ between rearing groups
(A to B) Waterfall plots of statistically significantly different metabolites at (A) 6 and (B) 12 months, defined by P < 0.05 and fold change > 2. (C) Scatterplots with regression lines for Treg populations and short-chain fatty acids found in plasma at 12 months. All metabolites are plotted using absorbance units.
Fig. 5
Fig. 5. Relationship between arachidonic acid concentrations and TH17 cell abundance
(A to B) Scatterplot and longitudinal regression show a significant association between stool arachidonic acid and (A) TH17 cells or (B) memory TH17 cells. (C) Significant association between arachidonic acid concentrations and Prevotella. All panels show 12-month data. (D) Significant correlations between stool concentrations of arachidonic acid, TH17 cells, and bacterial genera plotted in network form.

References

    1. Lozupone CA, Stombaugh JI, Gordon JI, Jansson JK, Knight R. Diversity, stability and resilience of the human gut microbiota. Nature. 2012;489:220–230. - PMC - PubMed
    1. McKenna P, Hoffmann C, Minkah N, Aye PP, Lackner A, Liu Z, Lozupone CA, Hamady M, Knight R, Bushman FD. The macaque gut microbiome in health, lentiviral infection, and chronic enterocolitis. PLOS Pathog. 2008;4:e20. - PMC - PubMed
    1. Pantoja-Feliciano IG, Clemente JC, Costello EK, Perez ME, Blaser MJ, Knight R, Dominguez-Bello MG. Biphasic assembly of the murine intestinal microbiota during early development. ISME J. 2013;7:1112–1115. - PMC - PubMed
    1. Guarner F, Malagelada JR. Gut flora in health and disease. Lancet. 2003;361:512–519. - PubMed
    1. Hsiao EY, McBride SW, Hsien S, Sharon G, Hyde ER, McCue T, Codelli JA, Chow J, Reisman SE, Petrosino JF, Patterson PH, Mazmanian SK. Microbiota modulate behavioral and physiological abnormalities associated with neurodevelopmental disorders. Cell. 2013;155:1451–1463. - PMC - PubMed

Substances