. 2014 Sep 18;513(7518):375-381.
doi: 10.1038/nature13726. Epub 2014 Sep 3.

The genomic substrate for adaptive radiation in African cichlid fish

David Brawand #  1   2 Catherine E Wagner #  3   4 Yang I Li #  2 Milan Malinsky  5   6 Irene Keller  4 Shaohua Fan  7 Oleg Simakov  7   8 Alvin Y Ng  9 Zhi Wei Lim  9 Etienne Bezault  10 Jason Turner-Maier  1 Jeremy Johnson  1 Rosa Alcazar  11 Hyun Ji Noh  1 Pamela Russell  12 Bronwen Aken  6 Jessica Alföldi  1 Chris Amemiya  13 Naoual Azzouzi  14 Jean-François Baroiller  15 Frederique Barloy-Hubler  14 Aaron Berlin  1 Ryan Bloomquist  16 Karen L Carleton  17 Matthew A Conte  17 Helena D'Cotta  15 Orly Eshel  18 Leslie Gaffney  1 Francis Galibert  14 Hugo F Gante  19 Sante Gnerre  1 Lucie Greuter  3   4 Richard Guyon  14 Natalie S Haddad  16 Wilfried Haerty  2 Rayna M Harris  20 Hans A Hofmann  20 Thibaut Hourlier  6 Gideon Hulata  18 David B Jaffe  1 Marcia Lara  1 Alison P Lee  9 Iain MacCallum  1 Salome Mwaiko  3 Masato Nikaido  21 Hidenori Nishihara  21 Catherine Ozouf-Costaz  22 David J Penman  23 Dariusz Przybylski  1 Michaelle Rakotomanga  14 Suzy C P Renn  10 Filipe J Ribeiro  1 Micha Ron  18 Walter Salzburger  19 Luis Sanchez-Pulido  2 M Emilia Santos  19 Steve Searle  6 Ted Sharpe  1 Ross Swofford  1 Frederick J Tan  24 Louise Williams  1 Sarah Young  1 Shuangye Yin  1 Norihiro Okada  21   25 Thomas D Kocher  17 Eric A Miska  5 Eric S Lander  1 Byrappa Venkatesh  9 Russell D Fernald  11 Axel Meyer  7 Chris P Ponting  2 J Todd Streelman  16 Kerstin Lindblad-Toh  1   26 Ole Seehausen  3   4 Federica Di Palma  1   27
Affiliations

The genomic substrate for adaptive radiation in African cichlid fish

David Brawand et al. Nature. .

Abstract

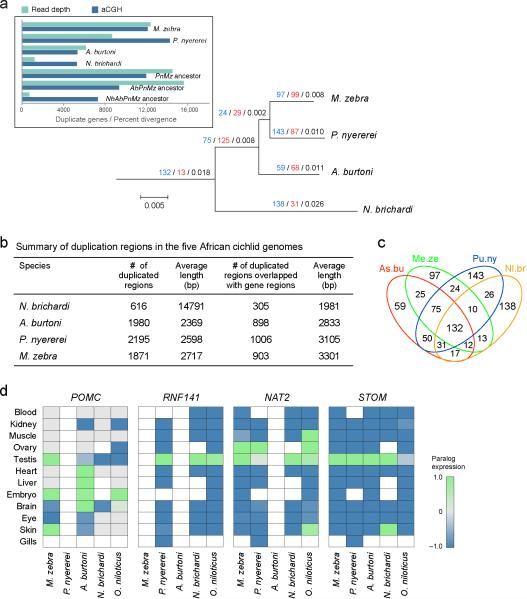
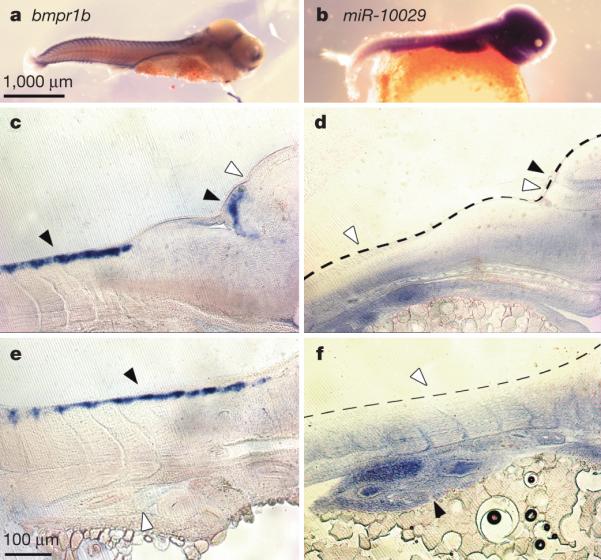
Cichlid fishes are famous for large, diverse and replicated adaptive radiations in the Great Lakes of East Africa. To understand the molecular mechanisms underlying cichlid phenotypic diversity, we sequenced the genomes and transcriptomes of five lineages of African cichlids: the Nile tilapia (Oreochromis niloticus), an ancestral lineage with low diversity; and four members of the East African lineage: Neolamprologus brichardi/pulcher (older radiation, Lake Tanganyika), Metriaclima zebra (recent radiation, Lake Malawi), Pundamilia nyererei (very recent radiation, Lake Victoria), and Astatotilapia burtoni (riverine species around Lake Tanganyika). We found an excess of gene duplications in the East African lineage compared to tilapia and other teleosts, an abundance of non-coding element divergence, accelerated coding sequence evolution, expression divergence associated with transposable element insertions, and regulation by novel microRNAs. In addition, we analysed sequence data from sixty individuals representing six closely related species from Lake Victoria, and show genome-wide diversifying selection on coding and regulatory variants, some of which were recruited from ancient polymorphisms. We conclude that a number of molecular mechanisms shaped East African cichlid genomes, and that amassing of standing variation during periods of relaxed purifying selection may have been important in facilitating subsequent evolutionary diversification.


Figures

Extended Data Figure 1
Extended Data Figure 1. Genome assembly and evolutionary rates
a, Genome assembly and annotation. b, Genome-wide dN/dS. Rates are calculated from 20 resampled sets of 200 orthologous genes. Gene annotations from interspecies projections (see Methods in Supplementary Information) were excluded from the data set.
Extended Data Figure 2
Extended Data Figure 2. Rapid Evolution of EDNRB1
a, Alignments of EDNRB1 in cichlids with human (HS), zebrafish (DAR) and medaka (ORL). Black star denotes site shown to be required to activate SRF in human by interacting with the G protein G13 (ref. 40). Red star denotes site that may affect the anchoring of the C terminus of EDNRB1to the transmembrane domain. Highlighted are amino acid substitution in the ancestor of haplochromine and lamprologini (blue) and in the ancestor of haplochromine (red). b, Location of substitutions on 7 transmembrane domain representation (Adapted from ref. Science 318, 1453–1455. Reprinted with permission from AAAS.). c, Sites (spheres) on the structure of the human kappa opioid receptor in complex (4DJH). Only the right homodimer is annotated.
Extended Data Figure 3
Extended Data Figure 3. Duplication in the cichlid genomes
a, The number of the recently duplicated genomic regions identified by the read depth method in the five East African cichlid genomes. The numbers in red is the number of duplicated genes and the numbers in black is the corresponding branch length. b, Summary of duplication regions in the five African cichlid genomes. c, Venn diagram of the duplicated genes detected by aCGH across cichlid species relative to O. niloticus. d, Expression patterns of duplicate genes. Matrix represents the expression level of retained duplicate genes from the cichlid common ancestor in the specified tissues. Expression is showed as an inverse logit function of log2-transformed, relative sequence fragment numbers. Uncoloured fields designate missing expression data or absence of either of the paralogue copies in the annotation set.
Extended Data Figure 4
Extended Data Figure 4. Cichlid OR and TAAR genes
a, Cichlid OR and TAAR genes identified in this study. b, PHYML tree based on the fish TAAR and OR amino acid sequences. A phylogeny tree was constructed with all OR and TAAR cichlid proteins identified in this study (n = 503 + 119) plus 229 OR and 173 TAAR genes identified in zebrafish, fugu, tetraodon, medaka and stickleback. The amino-acid sequences were aligned with MAFFT version 7 and a tree constructed with PHYML and visualized with Fig Tree (version 1.3.1). The TAAR branches are in pink and the OR branches in blue or yellow. Colours indicate the composition of the branches. Dark blue branches are made of cichlid OR only, light blue indicates the presence of cichlid and model fish OR proteins. Yellow is for branches made of OR model fish proteins, only. Light pink branches correspond to cichlid and model fish TAAR proteins and dark pink to model fish TAAR proteins only. Letters correspond to family names.
Extended Data Figure 5
Extended Data Figure 5. Comparison of TEs among cichlids and other vertebrate genomes
a, Repeat content of selected vertebrate genomes. Table, no legend. b, Proportions of TEs in the genomes. c, Proportions of each TE class among all TEs. The TE proportions are much lower in cichlid genomes than that in zebrafish.
Extended Data Figure 6
Extended Data Figure 6. A comparison of TEs in the African cichlids and Medaka genomes
af, The x-axis indicates a specific TE family at a given divergence from the consensus sequence and y-axis indicates its percentage of the genome.
Extended Data Figure 7
Extended Data Figure 7. Cichlid transposable elements
a, Association between TE insertions and gene expression levels of orthologous genes. All 5 cichlids are merged into the same data set. Groupings are based on whether one gene copy lies within 20 kb up or downstream of a TE. b, Orientation bias of transposable elements within or near non-duplicated genes. TE orientation bias in intron sequence of 5 cichlid species. Bias is shown as log2(sense/antisense) of TE counts. c, Orientation bias of transposable elements in introns of protein coding genes. The x-axis denotes the maximum age of the TEs as divergence from the consensus sequence. The y-axis shows the proportion of TE insertions in the sense of transcription. Data points with large confidence intervals (exceeding the display range) are omitted. d, Orientation bias of LINE insertions in introns in 4% divergence wide windows in O. niloticus, N. brichardi and combined haplochromines. Proportion of sense oriented LINEs in introns is shown on the y-axis. Age is shown on the x-axis as percent divergence from the TE consensus.
Extended Data Figure 8
Extended Data Figure 8. Reporter gene expression of a selectedO. niloticus hCNE–P. nyererei aCNE pair in transgenic zebrafish
a, O. niloticus Pbx1a locus showing the conservation track and alignment of an hCNE (LG18.20714) in O. latipes and East Africa cichlids. b, Reporter gene expression in 72 hours post-fertilization (hpf) G1 transgenic zebrafish. Expression is shown for the hCNE in O. niloticus and the corresponding aCNE in P. nyererei. The P. nyererei aCNE also shows expression in circulating blood cells.
Extended Data Figure 9
Extended Data Figure 9. Reporter gene expression of a selected hCNE–aCNE pairs in transgenic zebrafish (G0)
a, b, Comparison of expression pattern driven by O. niloticus and N. brichardi aCNE #911 (UNCX locus) in 72 hours post-fertilization (hpf) zebrafish embryos. c, d, Comparison of expression pattern driven by tilapia and N. brichardi aCNE #7012 (SERPINH1 locus) in 72 hpf zebrafish embryos. e, f, Comparison of expression pattern driven by tilapia and N. brichardi aCNE #1649 (TBX2 locus) in 72 hpf zebrafish embryos. g, h, Comparison of expression pattern driven by tilapia and M. zebra aCNE #26432 (FOXP4 locus) in 72 hpf zebrafish embryos. i, j, Comparison of expression pattern driven by tilapia and A. burtoni aCNE #5509 (PROX1 locus) in 72 hpf zebrafish embryos.
Extended Data Figure 10
Extended Data Figure 10. Cichlid microRNAs
a, Novelty in microRNAs mapped on the phylogenetic tree of the five cichlid species. Complementary expression of novel cichlid miRNA mir-10032 (c, e, g) and predicted target gene neurod2 (b, d, f) in stage 23 (9–10 days post-fertilization) Metriaclima zebra embryos. d, e are 18-μm sagittal sections. In d and e, arrows point to expression in the medulla (left), cerebellum (middle) and optic tectum (right). neurod2 is expressed in the neural tube (b, f), while mir-10032 is expressed in the surrounding somites (c, g). In all panels, anterior is to the right.
Figure 1
Figure 1. The adaptive radiation of African cichlid fish
Top left, map of Africa showing lakes in which cichlid fish have radiated. Right, the five sequenced species: Pundamilia nyererei (endemic of Lake Victoria); Neolamprologus brichardi (endemic of Lake Tanganyika); Metriaclima zebra (endemic of Lake Malawi); Oreochromis niloticus (from rivers across northern Africa); Astatotilapia burtoni (from rivers connected to Lake Tanganyika). Major ecotypes are shown from each lake: a, pelagic zooplanktivore; b, rock-dwelling algaescraper; c, paedophage (absent from Lake Tanganyika); d, scale eater; e, snail crusher; f, reef-dwelling planktivore; g, lobe-lipped insect eater; h, pelagic piscivore; i, ancestral river-dweller also found in lakes (absent from Lake Tanganyika). Bottom left, phylogenetic tree illustrating relationships between the five sequenced species (red), major adaptive radiations and major river lineages. The tree is from ref. , pruned to the major lineages. Upper timescale (4), lower timescale (32). Photos by Ad Konings (Tanganyika a, b, d, e, g, h; Malawi a, c, d, e, f, g, h, i), O.S. (Victoria ag, i; Malawi b), Frans Witte (Victoria h), W.S. (Tanganyika f), Oliver Selz (Victoria f, A. burtoni), Marcel Haesler (O. niloticus).
Figure 2
Figure 2. Gene duplication in the ancestry of East African lake cichlids
Black numbers represents species divergence calculated as neutral genomic divergence between the sequenced species using ~2.7 million fourfold degenerate sites from the alignment of 9 teleost genomes. This neutral substitution model suggests ~2% pairwise divergence between the three haplochromines and a ~6% divergence to N. brichardi. Red numbers represent duplicated genes. Asterisks indicate excluded branches owing to incomplete lineage sorting in haplochromines or weak support of consensus species tree.
Figure 3
Figure 3. Novel cichlid microRNAs
af, Complementary expression of mir-10029 (b, d, f) and its predicted target gene bmpr1b (a, c, e) in stage 18 (6 days post-fertilization) Metriaclima zebra embryos. cf are 18-μm sagittal sections. In c and d arrows point to expression (black) or lack of expression (white) in the somites, presumptive cerebellum, and optic tectum (from left to right). In e and f, arrows point to expression and lack of expression in the somites (dorsal) and the gut (ventral). In all panels, anterior is to the right.
Figure 4
Figure 4. Genomic divergence stems from incomplete lineage sorting (ILS) and both old and novel coding and noncoding variation
a, Coalescence times and trees supporting ILS among the genomes of allopatric East African cichlid lineages were inferred by coalHMM. The most common genealogy matches the known species tree and represents a M. zebraP. nyererei coalescence that falls between the two speciation times, Tzn (speciation M. zebraP. nyererei) and Tznb (speciation M. zebraP. nyerereiA. burtoni). In genealogies 1 (dashed line), 2, and 3, all coalescence events are ancient and occur before time Tznb. b, Phylogenetic analysis of RAD-sequence data showing well-supported differentiation among young Victoria species. The complete data set (top) renders the genus Mbipia non-monophyletic, exclusion of the top 1% divergent loci (bottom) supports monophyly of each genus. c, Genomic divergence in paired comparisons of Lake Victoria cichlids (per-site FST; black/grey are chromosomes). Sister species from top: Pundamilia nyererei/P. pundamilia and Mbipia lutea/M. mbipi differ in male breeding coloration but have conserved morphology; Neochromis omnicaeruleus/N. sp. “unicuspid scraper” and distant relatives P. pundamilia/M. mbipi and P. nyererei/M. lutea have similar coloration but differ in morphology. Red-highlighted SNPs indicate significantly divergent sites between colour-contrasting species, but not between same-colour species. Bar plots show the proportion of SNPs in four annotation categories: exons (orange), introns (dark blue), 25-kb flanking genes (turquoise), or none of the above (grey), for thresholds of increasing FST. In “All sites” and “Ancient variant sites” analyses, symbols indicate an excess of SNPs in a given annotation category compared to expectations from the full data set or from all non-ancient variant sites, respectively (FDR q-values: *q < 0.05; †q = 0.05), (Supplementary Information, Data Portals, Supplementary Population Genomics FTP files).

Comment in

References

    1. Darwin C. On the Origin of Species. 6th edn John Murray; 1859.
    1. Simpson GG. Tempo and Mode in Evolution. Columbia Univ. Press; 1944.
    1. Kocher TD. Adaptive evolution and explosive speciation: the cichlid fish model. Nature Rev. Genet. 2004;5:288–298. - PubMed
    1. Wagner CE, Harmon LJ, Seehausen O. Ecological opportunity and sexual selection together predict adaptive radiation. Nature. 2012;487:366–369. - PubMed
    1. Meyer A. Morphometrics and allometry in the trophically polymorphic cichlid fish, Cichlasoma citrinellum: alternative adaptations and ontogenic changes in shape. J. Zool. 1990;221:237–260.

Publication types