. 2014 Sep 3;34(36):11929-47.
doi: 10.1523/JNEUROSCI.1860-14.2014.

An RNA-sequencing transcriptome and splicing database of glia, neurons, and vascular cells of the cerebral cortex

Affiliations

An RNA-sequencing transcriptome and splicing database of glia, neurons, and vascular cells of the cerebral cortex

Ye Zhang et al. J Neurosci. .

Erratum in

  • J Neurosci. 2015 Jan 14;35(2):846-6

Abstract

The major cell classes of the brain differ in their developmental processes, metabolism, signaling, and function. To better understand the functions and interactions of the cell types that comprise these classes, we acutely purified representative populations of neurons, astrocytes, oligodendrocyte precursor cells, newly formed oligodendrocytes, myelinating oligodendrocytes, microglia, endothelial cells, and pericytes from mouse cerebral cortex. We generated a transcriptome database for these eight cell types by RNA sequencing and used a sensitive algorithm to detect alternative splicing events in each cell type. Bioinformatic analyses identified thousands of new cell type-enriched genes and splicing isoforms that will provide novel markers for cell identification, tools for genetic manipulation, and insights into the biology of the brain. For example, our data provide clues as to how neurons and astrocytes differ in their ability to dynamically regulate glycolytic flux and lactate generation attributable to unique splicing of PKM2, the gene encoding the glycolytic enzyme pyruvate kinase. This dataset will provide a powerful new resource for understanding the development and function of the brain. To ensure the widespread distribution of these datasets, we have created a user-friendly website (http://web.stanford.edu/group/barres_lab/brain_rnaseq.html) that provides a platform for analyzing and comparing transciption and alternative splicing profiles for various cell classes in the brain.

Keywords: alternative splicing; astrocytes; microglia; oligodendrocytes; transcriptome; vascular cells.


Figures

Figure 1.
Figure 1.
Purification of neurons, glia, and vascular cells. A, We purified eight cell types—neurons, astrocytes, OPCs, NFOs, MOs, microglia, endothelial cells, and pericytes—from mouse cerebral cortex with a combination of immunopanning and FACS procedures (for details, see Materials and Methods). B, RNA was extracted from purified cells and analyzed by microarray and RNA-Seq. C, Spearman's rank correlation of RNA-Seq biologically independent replicates. Each replicate consists of pooled cortices from 3–12 animals. D, Expression of classic cell-specific markers in purified glia, neurons, and vascular cells samples determined by RNA-Seq. Two biological replicates of each cell type are shown. Specific expression of known cell-specific markers demonstrates the purity of the glial, neuronal, and vascular samples.
Figure 2.
Figure 2.
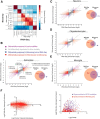
Comparison of RNA-Seq and microarray analyses showed that RNA-Seq identified more differentially expressed genes across cell types than microarray. A, Spearman's rank correlation between gene expression data obtained by the RNA-Seq and microarray methods across cell types. Gene expression profiles of the same cell type obtained by the RNA-Seq and microarray methods showed a high degree of correlation. B, Numbers of differentially expressed genes identified by the RNA-Seq and microarray methods. A snapshot of the data is summarized in the Venn diagram. Using a fourfold difference as the cutoff, RNA-Seq analysis identified 3129 genes as differentially expressed by astrocytes, whereas microarray identified only 1367 genes. The majority of genes identified by microarray as differentially expressed are similarly classified by RNA-Seq (1279). RNA-Seq identified an additional 1850 genes as differentially expressed that were not identified by microarray as differentially expressed. C–E, RNA-Seq versus microarray comparisons for neurons, oligodendrocytes, and microglia. F, The relationship between fold enrichment and expression level in astrocytes. There is a sharp cutoff line on the left (FPKM = 0.1 or −3.3 on the log2 scale) because we set any FPKM value <0.1 to 0.1 to avoid ratio inflation in fold enrichment calculations. G, The relationship between fold enrichment and expression level in astrocytes.
Figure 3.
Figure 3.
RNA-Seq analysis revealed cell type-specific gene expression profiles. A, Dendrogram and unsupervised hierarchical clustering heat map (using Euclidean distance) of purified cortical glia, neurons, and vascular cells. The vertical distances on each branch of the dendrogram represent the degree of similarity between gene expression profiles of various samples. Biological replicates showed the highest degree of correlation represented by short vertical distances. Cells in the oligodendrocyte lineage cluster closely together, and the order of the three oligodendrocyte-lineage cell types corresponds to their maturation stages (OPC–NFO–MO). Although astrocytes and oligodendrocytes are both glial cells, their gene expression profiles are as different between each other as they are different from neurons. Consistent with their embryonic origin, mesodermal-derived endothelial cells and microglia cluster farther away from ectoderm-derived neurons, astrocytes, and oligodendrocytes. B, The top 40 enriched genes per cell type are shown in a heat map. Only highly expressed genes with FPKM >20 are included in this analysis. Fold enrichment is calculated as FPKM of one cell type divided by the average FPKM of all other cell types. The majority of these genes showed specific expression by only one cell type, with the exception that some are expressed during more than one maturation stage in the oligodendrocyte lineage.
Figure 4.
Figure 4.
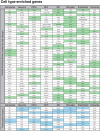
Cell-specific markers and transcription factors. The top 40 genes and top 10 transcription factors ranked by fold enrichment of each cell type are listed. The most highly expressed genes are highlighted. Green, FPKM >150; blue, FPKM >50 for transcription factors. Fold enrichment of astrocytes, neurons, microglia, and endothelial cells are calculated as FPKM of one cell type divided by the average FPKM of all other cell types. Fold enrichment of OPC, NFO, and MO are calculated as FPKM of one cell type divided by the average FPKM of all non-oligodendrocyte-lineage cells, to highlight top genes specifically expressed by a particular maturation stage during oligodendrocyte development. Only highly expressed genes with FPKM >20 are included in the ranking to highlight genes that are most likely to have significant cell type-specific functions.
Figure 5.
Figure 5.
Alternative splicing analysis of neurons, glia and vascular cells. A, Six types of alternative splicing events are detected by RNA-Seq. Boxes and black lines represent exons and introns, respectively. Blue lines and red lines represent alternative splicing events detected in the dataset. The 5′ end is to the left, and the 3′ end is to the right. Cassette, The inclusion or exclusion of an exon; Tandom Cassette, the inclusion or exclusion of two or more tandom exons; Mutually Exclusive, the inclusion of one exon in one transcript and inclusion of a different exon in another transcript; Intron Retention, the inclusion or exclusion of a segment previously annotated to be an intron; Alternative 5′ SS, the alternative usage of a splicing site on the 5′ end of an exon; Alternative 3′ SS, the alternative usage of a splicing site on the 3′ end of an exon. B, Frequencies of the six types of alternative splicing events detected in the entire dataset and in individual cell types. In all cell types, cassette exon events, i.e., the inclusion or exclusion of an exon, are the most frequently detected alternative splicing events. C, The numbers of genes that are alternatively spliced in each cell type and the union of these samples. The dotted line represents the total number of genes that are known to contain a potential splicing event in the mouse genome. The number of these genes that are expressed in a given cell type are represented by gray bars. The black bars indicate the numbers of genes that are alternatively spliced in a given cell type based on criteria outlined in Materials and Methods. D, The numbers of statistically significant cell type-specific alternative splicing events in each cell type. Neurons have the highest number of specific splicing events, whereas oligodendrocyte-lineage cells have the least amount of specific splicing events. E, Pkm2 is an example of a gene spliced uniquely in astrocytes and neurons. The traces represent raw data of the number of reads mapped to the Pkm2 gene from astrocytes and neurons. The height of the blue bars represents number of reads. The bottom schematic is the transcript model of Pkm2 gene from the UCSC Genome Browser. Boxes represent exons, and black lines represent introns. The exon shown in blue is predominantly included in neurons, whereas the exon shown in yellow is included only in astrocytes. This is an example of a mutually exclusive event. F, Validation of PKM1/2 splicing differences by PCR. We designed primers targeting exons unique to PKM1, unique to PKM2, and exons common to PKM1 and PKM2. PCR products were detected from neuron, astrocyte, and whole-brain samples in patterns predicted by the RNA-Seq data.
Figure 6.
Figure 6.
Validation of RNA-Seq results by qRT-PCR and in situ hybridization. A, qRT-PCR validation of cell type-enriched genes identified by RNA-Seq. We performed qRT-PCR with Fluidigm BioMark microfluidic technology. Expression of several genes identified by RNA-Seq as enriched in each cell type was examined by qRT-PCR. The housekeeping gene Gapdh was included for comparison. Twelve replicates of each purified cell type and three replicates of whole-brain samples were analyzed. Warmer colors represent lower Ct values (higher abundance of transcripts), and cooler colors represent higher Ct values (lower abundance of transcripts). Black indicates no amplification. Data of genes labeled in red were quantified in B. B, Ct differences of Atp13a4, Cpne7, Fam70b, Tmem88b, and Rcsd1 compared with Gapdh were plotted on a log2 scale. Error bar represents SD. RNA-Seq analysis showed that Atp13a4, Cpne7, Fam70b, Tmem88b, and Rcsd1 are enriched in astrocytes, neurons, OPCs, oligodendrocytes, and microglia, respectively. qRT-PCR validated these results. C–G, In situ hybridization validated novel cell type-specific genes. Left, Low-magnification image of the cortex and hippocampus. Scale bar, 200 μm. Right, High-magnification image of the cortex. Scale bar, 50 μm. Fluorescence in situ hybridization signals with probes against novel cell type-specific genes (red) and known cell type-specific markers (green) are shown. The regions in the yellow boxes are enlarged and shown as single channel and merged images on the right.
Figure 7.
Figure 7.
Energy metabolism differences between astrocytes and neurons. The expression of several regulatory enzymes by astrocytes but not neurons allows astrocytes to adapt their metabolic flux to the energy state of the cell and to perform higher rate of aerobic glycolysis. Left, Diagram of energy metabolism pathways. Glycogen metabolism and glycolysis, which occur in the cytosol, and the tricarboxylic acid cycle, which occurs in the mitochondria, are shown. Steps highlighted with red asterisks are differentially regulated in astrocytes and neurons. Right, Detailed diagram of energy metabolism differences between astrocytes and neurons. Metabolic steps with key differences are labeled with numbers 1–4 and explained below the diagram. The rate of reactions is represented by the width of the arrows. The predominant metabolic products converted from pyruvate (lactate in astrocytes and acetyl-CoA in neurons) are highlighted in green.

References

    1. Allen NJ, Barres BA. Neuroscience: glia—more than just brain glue. Nature. 2009;457:675–677. doi: 10.1038/457675a. - DOI - PubMed
    1. Almeida A, Bolaños JP, Moncada S. E3 ubiquitin ligase APC/C-Cdh1 accounts for the Warburg effect by linking glycolysis to cell proliferation. Proc Natl Acad Sci U S A. 2010;107:738–741. doi: 10.1073/pnas.0913668107. - DOI - PMC - PubMed
    1. Ashurst JL, Chen CK, Gilbert JGR, Jekosch K, Keenan S, Meidl P, Searle SM, Stalker J, Storey R, Trevanion S, Wilming L, Hubbard T. The Vertebrate Genome Annotation (Vega) database. Nucleic Acids Res. 2005;33:D459–D465. doi: 10.1093/nar/gki135. - DOI - PMC - PubMed
    1. Bainbridge MN, Warren RL, Hirst M, Romanuik T, Zeng T, Go A, Delaney A, Griffith M, Hickenbotham M, Magrini V, Mardis ER, Sadar MD, Siddiqui AS, Marra MA, Jones SJ. Analysis of the prostate cancer cell line LNCaP transcriptome using a sequencing-by-synthesis approach. BMC Genomics. 2006;7:246. doi: 10.1186/1471-2164-7-246. - DOI - PMC - PubMed
    1. Bandyopadhyay U, Cotney J, Nagy M, Oh S, Leng J, Mahajan M, Mane S, Fenton WA, Noonan JP, Horwich AL. RNA-Seq profiling of spinal cord motor neurons from a presymptomatic SOD1 ALS mouse. PLoS One. 2013;8:e53575. doi: 10.1371/journal.pone.0053575. - DOI - PMC - PubMed

Publication types