. 2014 Sep 3;34(36):11972-83.
doi: 10.1523/JNEUROSCI.2177-14.2014.

Dynamic representation of the temporal and sequential structure of rhythmic movements in the primate medial premotor cortex

Affiliations

Dynamic representation of the temporal and sequential structure of rhythmic movements in the primate medial premotor cortex

David A Crowe et al. J Neurosci. .

Abstract

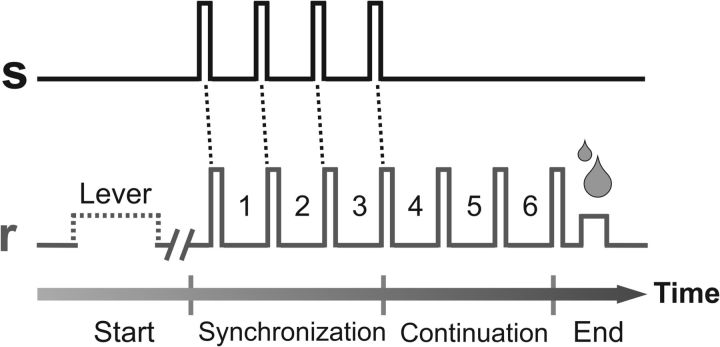
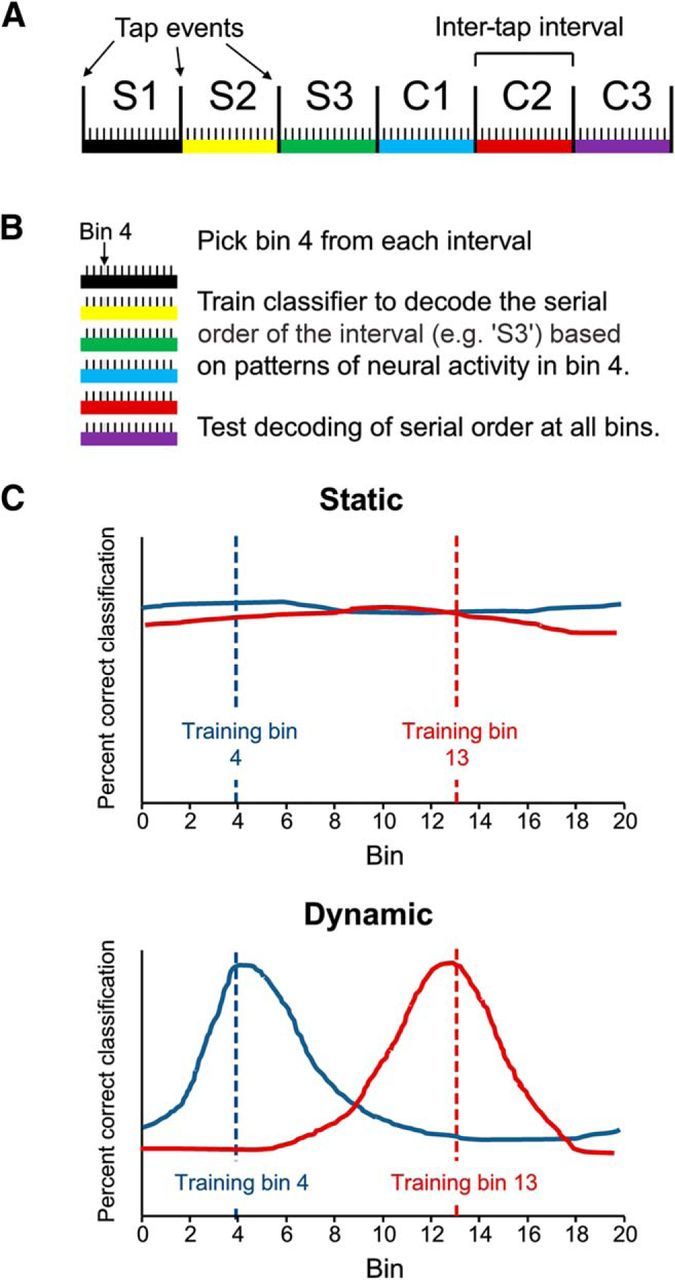
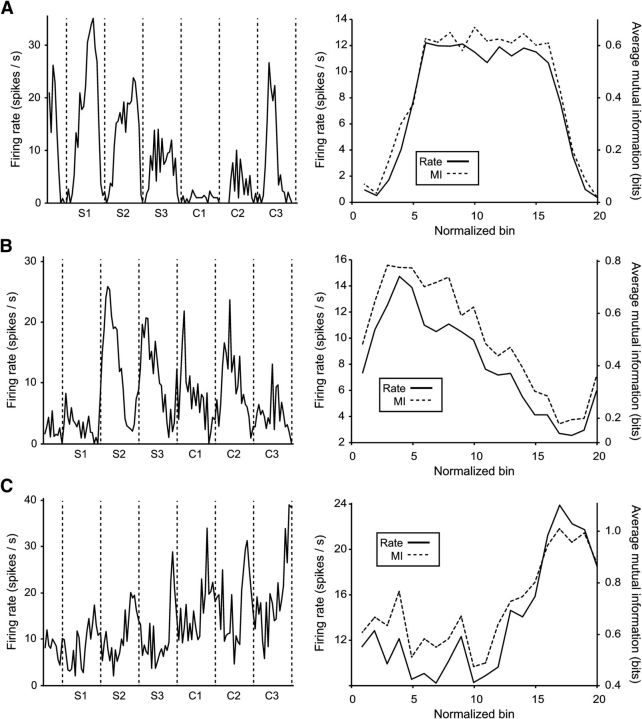
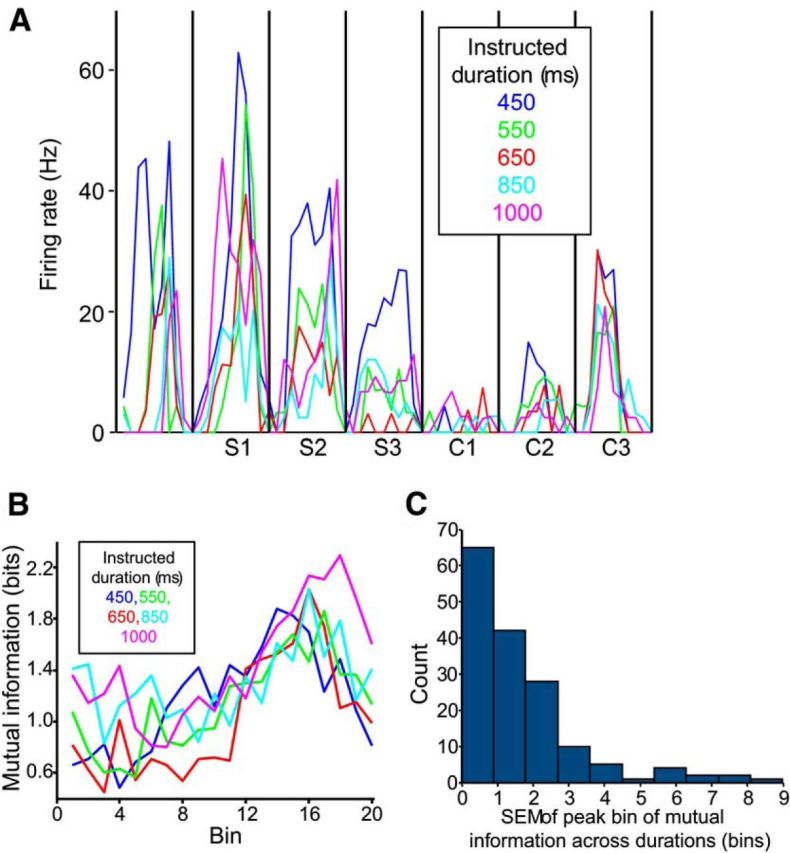
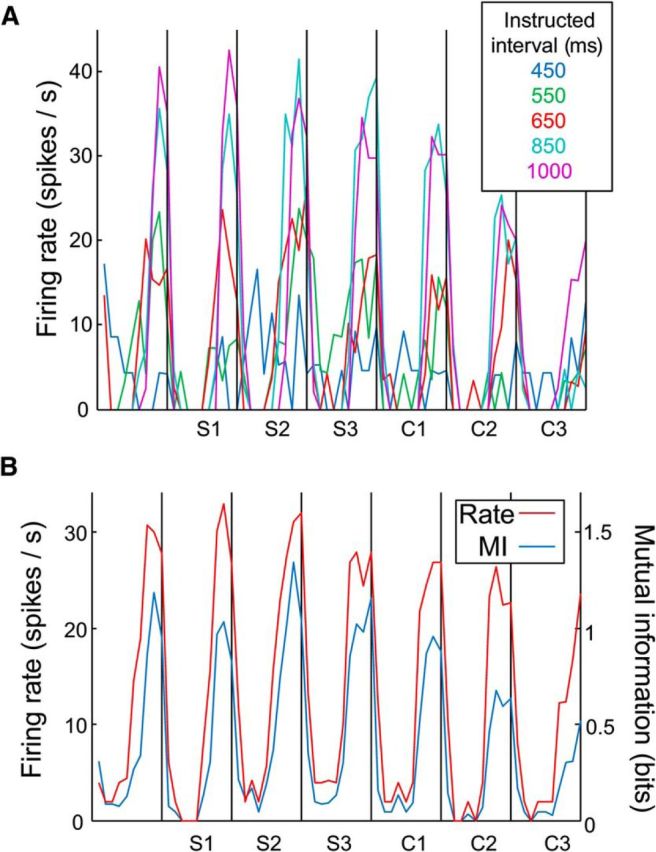
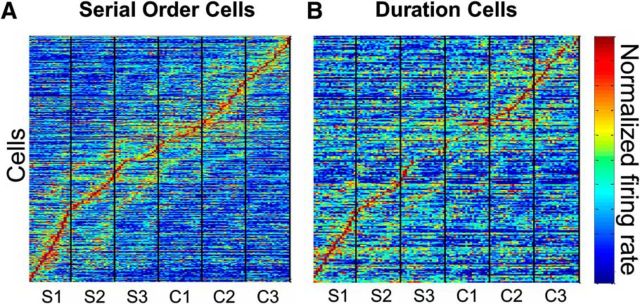
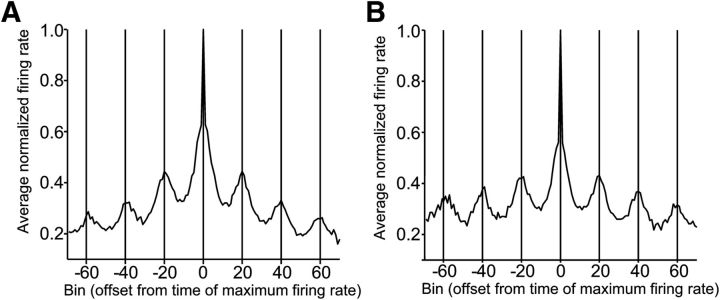
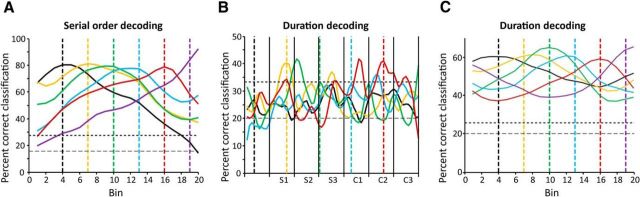
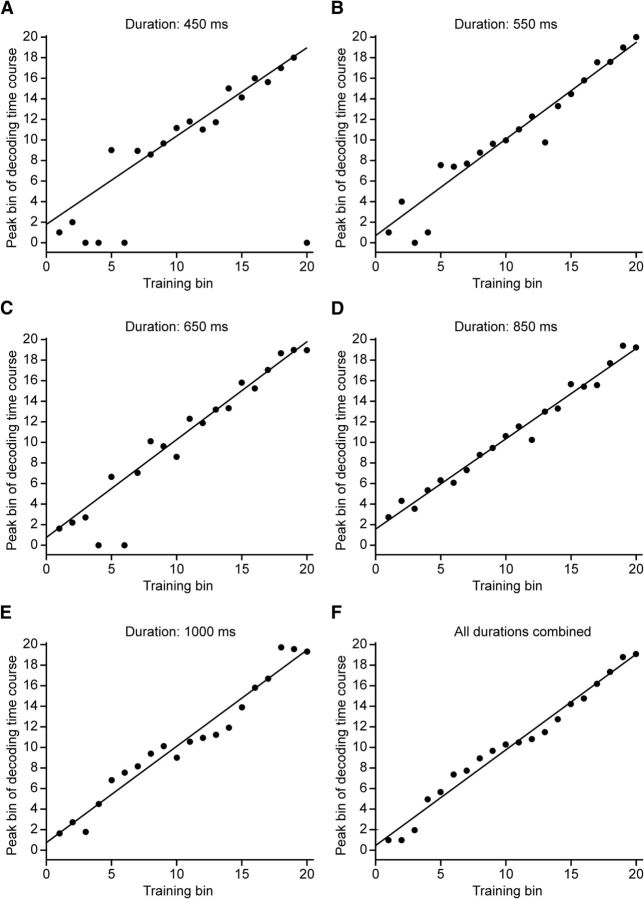
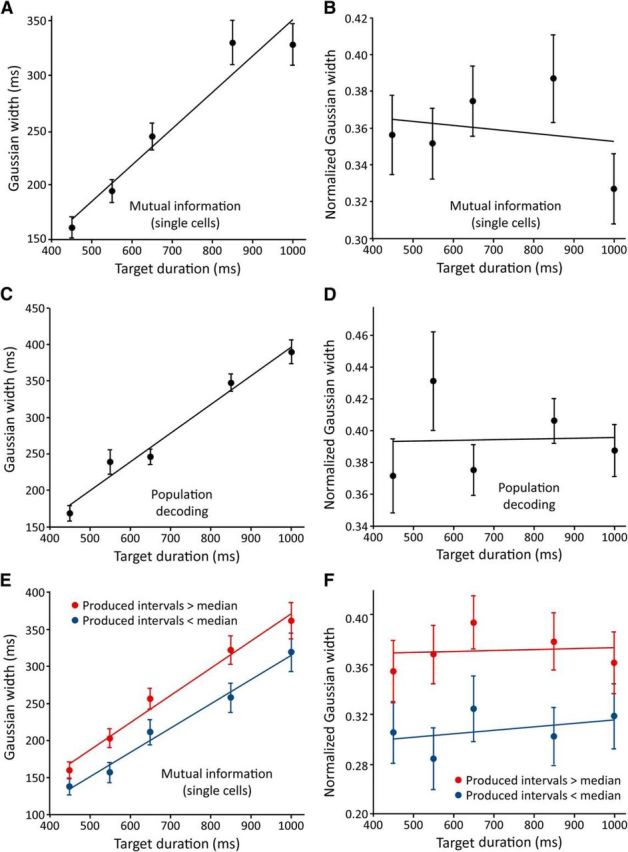
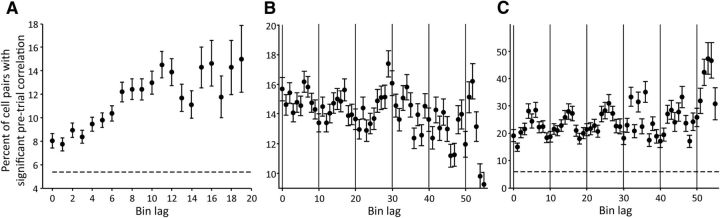
We determined the encoding properties of single cells and the decoding accuracy of cell populations in the medial premotor cortex (MPC) of Rhesus monkeys to represent in a time-varying fashion the duration and serial order of six intervals produced rhythmically during a synchronization-continuation tapping task. We found that MPC represented the temporal and sequential structure of rhythmic movements by activating small ensembles of neurons that encoded the duration or the serial order in rapid succession, so that the pattern of active neurons changed dramatically within each interval. Interestingly, the width of the encoding or decoding function for serial order increased as a function of duration. Finally, we found that the strength of correlation in spontaneous activity of the individual cells varied as a function of the timing of their recruitment. These results demonstrate the existence of dynamic representations in MPC for the duration and serial order of intervals produced rhythmically and suggest that this dynamic code depends on ensembles of interconnected neurons that provide a strong synaptic drive to the next ensemble in a consecutive chain of neural events.

Keywords: medial premotor cortex; neural dynamics; sequential processing; temporal processing.


Figures

Figure 1.
Figure 1.
Illustration of an SCT. Monkeys were required to push a button (r, gray line) each time stimuli with a constant interstimulus interval duration (s, black line) were presented, which resulted in a stimulus-movement cycle. After four consecutive synchronized movements, the stimuli stopped and the monkeys continued tapping with a similar interval duration for three additional intervals. Hence, six intertap intervals were generated by the monkeys in each trial. The instructed durations, defined by brief auditory or visual stimuli, were 450, 550, 650, 850, and 1000 ms, and were chosen pseudorandomly within a repetition.
Figure 2.
Figure 2.
Illustration of serial-order decoding analysis. A, Each trial consisted of six produced intertap intervals (colored bars S1–C3) per duration. Monkeys performed five trials in each set. B, To decode serial order during the intertap interval, we divided each interval into equally spaced bins and collected observations at each bin across six intervals and five trials. Thus, at each bin, we obtained 30 observations. We used the patterns of activity of 352 cells to decode the serial order of each of the 30 observations. On each iteration of the decoding, we trained the decoder at one bin and used the resulting classification functions to decode serial order at all bins. We repeated this process using each bin as the training bin, providing one decoding time course for every bin. The proportion of observations correctly classified at each bin is an indication of how reliably patterns of activity across the population vary as a function of serial order. C, By training the decoder at a particular bin (dashed lines) and classifying at all other bins (solid lines), we were able to test whether the representation of serial order was static over time or dynamic. If patterns of neural activity that represent different serial orders remain the same across the intertap interval (Static representation, top), decoding accuracy should be consistent across all bins, no matter which bin was used to train the decoder. If serial order was represented by different patterns of activity at different times (Dynamic representation, bottom), then decoding should be highest at bins nearest the training bin.
Figure 3.
Figure 3.
Activity of sample cells, averaged across intertap interval durations using normalized bins (20 bins per interval for all durations). A, Left, Shows the average firing rate (across 30 trials) of a neuron whose activity varied as a function of the serial order of intertap interval. Vertical lines indicate tap events. The three Synchronization intervals (S1–S3) and three Continuation intervals (C1–C3) are indicated under the x-axis. Right, Shows the average firing rate (solid line) and MI of firing rate and serial order (dashed line), within the intertap interval, across 180 observations (30 trials × 6 serial orders). B, C, Activity of two other cells with activity significantly related to serial order. Maximum possible MI = 2.58 bits.
Figure 4.
Figure 4.
The activity of serial-order cells across interval durations (20 bins per interval). A, The average firing rate of a serial-order neuron, across the five instructed intertap durations (5 trials per duration). Vertical lines indicate tap events. Synchronization (S1–S3) and Continuation (C1–C3) intervals are indicated under the x-axis. B, The MI time courses for a serial-order neuron, across the five durations (30 observations–6 serial orders × 5 trials–per point). MI tended to peak late in the interval at all durations (maximum possible MI = 2.58 bits). C, Gaussian curves were fit to each cell's MI time course, at each duration (e.g., the lines in B). We calculated the SEM of the peaks of these curves (in bins), for each cell, across durations. The histogram shows these SEM values; lower values indicate cells with similar peaks across durations (e.g., the cell in B). Data are from 169 cells with at least two successful Gaussian fits with peaks in the bin range.
Figure 5.
Figure 5.
The activity of a duration cell, using normalized bin across durations (20 bins per interval). A, The average firing rate of a neuron whose activity varied as a function of the intertap interval duration, at each duration (5 trials per duration). Conventions as in Figure 2. B, Activity averaged across durations, compared with the MI of this cell's firing rate and intertap interval duration (across 25 trials–5 trials × 5 durations). Maximum possible MI = 2.32 bits.
Figure 6.
Figure 6.
Dynamic activity within populations of serial-order and duration cells. A, Average normalized firing rate of cells with activity significantly related to serial order, aligned to bin of maximum rate. Each intertap interval was divided into 20 bins. Vertical lines indicate tap events. Synchronization (S1–S3) and Continuation (C1–C3) intervals are indicated under the x-axis. Data averaged over 25 trials. B, Average normalized firing rate of cells with activity significantly related to duration, aligned to bin of maximum rate. Each intertap interval was divided into 20 bins. All data are collapsed across durations and averaged over 25 trials.
Figure 7.
Figure 7.
Average normalized firing rate of cells with activity significantly related to serial order (N = 352 cells; A) or duration (N = 298 cells; B), aligned to bin of maximum rate. Each intertap interval was divided into 20 bins.
Figure 8.
Figure 8.
Decoding time courses. Each colored time course was generated by training the decoder at a particular bin, indicated by the vertical line of the same color, and then classifying serial order or duration at all bins. A, Example time courses showing the time evolution of serial-order representation. Decoding performance is highest near the training bin and falls off over time, indicating a dynamic representation. In this example, decoding was performed on trials with instructed durations of 1000 ms (∼50 ms bin width), using 30 observations at each time point (5 trials × 6 serial orders). Since there were six intertap intervals, chance decoding was 17%. The horizontal dashed line indicates the average decoding performance of the decoder on 100 bootstrap iterations of the analysis, in which serial orders were randomized. The horizontal dotted line indicates the 95th percentile of the bootstrap distribution. B, Example time courses showing dynamic representation of intertap interval duration. Decoding performance peaks at the training bin, and shows a cyclical variation, with similar peaks in other intertap intervals (25 observations at each time point: 5 trials × 5 durations). Since there were five durations, chance decoding was 20%. Horizontal dashed and dotted lines indicate the mean and 95th percentile of 100 bootstrap iterations performed by randomizing duration. C, Example times courses of duration decoding when data were collapsed across intervals, as in the serial-order analysis. Dashed and dotted lines as in B.
Figure 9.
Figure 9.
Serial-order decoding time course peaks as a function of training bins, at each instructed duration. A–E, Each dot represents the peak, in time bins, of a fitted Gaussian curve to the decoding time course obtained when the decoder was trained at the bin indicated on the x-axis (30 observations; 5 trials × 6 serial orders). Nonlinear regression was used to produce the fits. Dots at bin zero on the y-axis represent a failure of the nonlinear regression to provide a fit. Each instructed duration (450–1000 ms) was broken into 20 equal bins. Lines indicate a best fit of all nonzero points. F, Decoding time course peaks when data from all durations were combined (150 observations; 5 trials × 5 durations × 6 intervals).
Figure 10.
Figure 10.
Average serial-order MI and decoding time course widths as a function of duration. A, MI of each cell's firing rate and serial order were calculated at each bin, separately at each duration. Gaussian curves were fitted to each MI time course and their width parameters (in milliseconds) were averaged across cells (N = 99, 105, 110, 76, 77 curve widths for durations of 450, 550, 650, 850, and 1000 ms; these numbers vary because the nonlinear regression was not able to fit all time courses). B, The data from A are re-expressed as a fraction of an instructed interval duration. C, D, Time-resolved population decoding of serial order was performed separately at each duration, and Gaussian curves were fitted to the resulting time courses (N = 13, 16, 15, 17, 17 curve widths for durations 450–1000 ms). Average widths in milliseconds shown in C and widths normalized to intertap interval shown in D. E, F, The MI analysis was repeated for intervals that were split into those whose actual durations were above (red) and below (blue) the median for that instructed duration. All error bars ± SEM.
Figure 11.
Figure 11.
Correlation in baseline firing rate for pairs of cells. A, Serial-order cells. Points represent the percentage of simultaneously recorded cell pairs that had a significant (p < 0.05) correlation in baseline firing rate across trials, based on their assigned bin lags. Dashed line represents the average correlation across all nonsimultaneously recorded cells pairs, across all bin lags. As for all serial-order analyses, data are collapsed across serial order within trials. B, Baseline correlation of serial-order cells whose bin lags were assigned based on the cells' bins of peak firing rate, across the entire trial (all six intervals). Vertical lines indicate the tap events. Data beyond lag 55 are not shown because of high variability in the data (seen somewhat in lags 30–55). C, Baseline correlation of simultaneously recorded duration cells, as a function of bin lag. This analysis used intertap intervals broken into 10 bins (vs 20 used in other analyses) to reduce noise. The data go beyond one interval since the variable, duration, was constant across an entire trial. Vertical lines indicate the tap events. Data beyond lag 55 are not shown because of high variability in the data. All error bars = ±SE.

References

    1. Abeles M. Local cortical circuits: an electrophysiological study. Berlin: Springer; 1982.
    1. Averbeck BB, Crowe DA, Chafee MV, Georgopoulos AP. Neural activity in prefrontal cortex during copying geometrical shapes: II. Decoding shape segments from neural ensembles. Exp Brain Res. 2003;150:142–153. - PubMed
    1. Bartolo R, Prado L, Merchant H. Information processing in the primate basal ganglia during sensory guided and internally driven rhythmic tapping. J Neurosci. 2014;34:3910–3923. doi: 10.1523/JNEUROSCI.2679-13.2014. - DOI - PMC - PubMed
    1. Buonomano DV, Laje R. Population clocks: motor timing with neural dynamics. Trends Cogn Sci. 2010;14:520–527. doi: 10.1016/j.tics.2010.09.002. - DOI - PMC - PubMed
    1. Clower WT, Alexander GE. Movement sequence-related activity reflecting numerical order of components in supplementary and presupplementary motor areas. J Neurophysiol. 1998;80:1562–1566. - PubMed

Publication types

LinkOut - more resources