. 2014 Nov 1;20(21):5483-95.
doi: 10.1158/1078-0432.CCR-14-0902. Epub 2014 Sep 3.

Upregulation of IGF1R by mutant RAS in leukemia and potentiation of RAS signaling inhibitors by small-molecule inhibition of IGF1R

Affiliations

Upregulation of IGF1R by mutant RAS in leukemia and potentiation of RAS signaling inhibitors by small-molecule inhibition of IGF1R

Ellen Weisberg et al. Clin Cancer Res. .

Abstract

Purpose: Activating mutations in the RAS oncogene occur frequently in human leukemias. Direct targeting of RAS has proven to be challenging, although targeting of downstream RAS mediators, such as MEK, is currently being tested clinically. Given the complexity of RAS signaling, it is likely that combinations of targeted agents will be more effective than single agents.

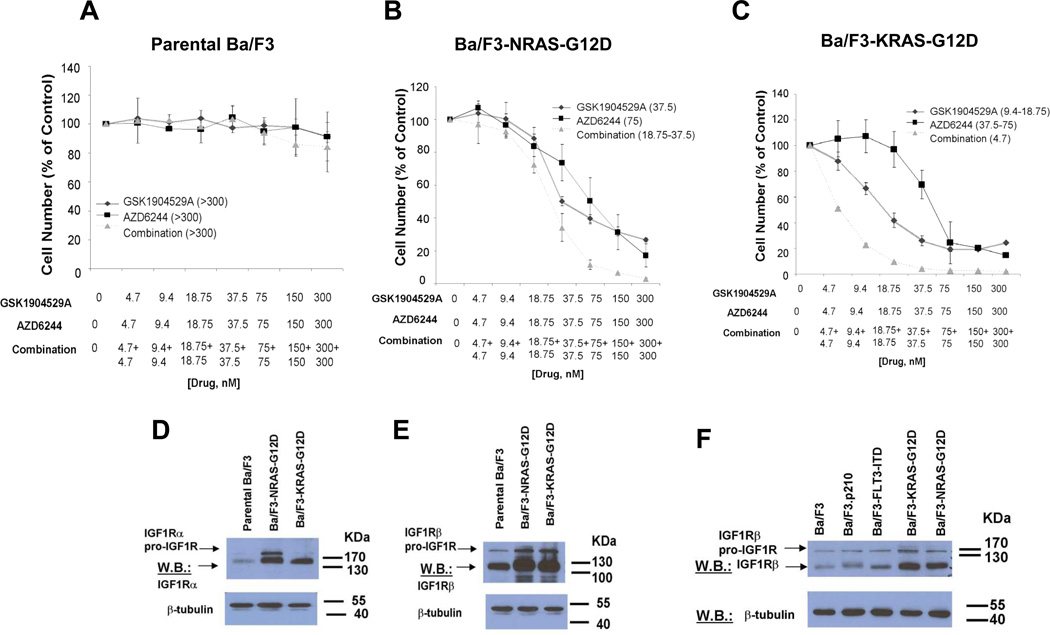
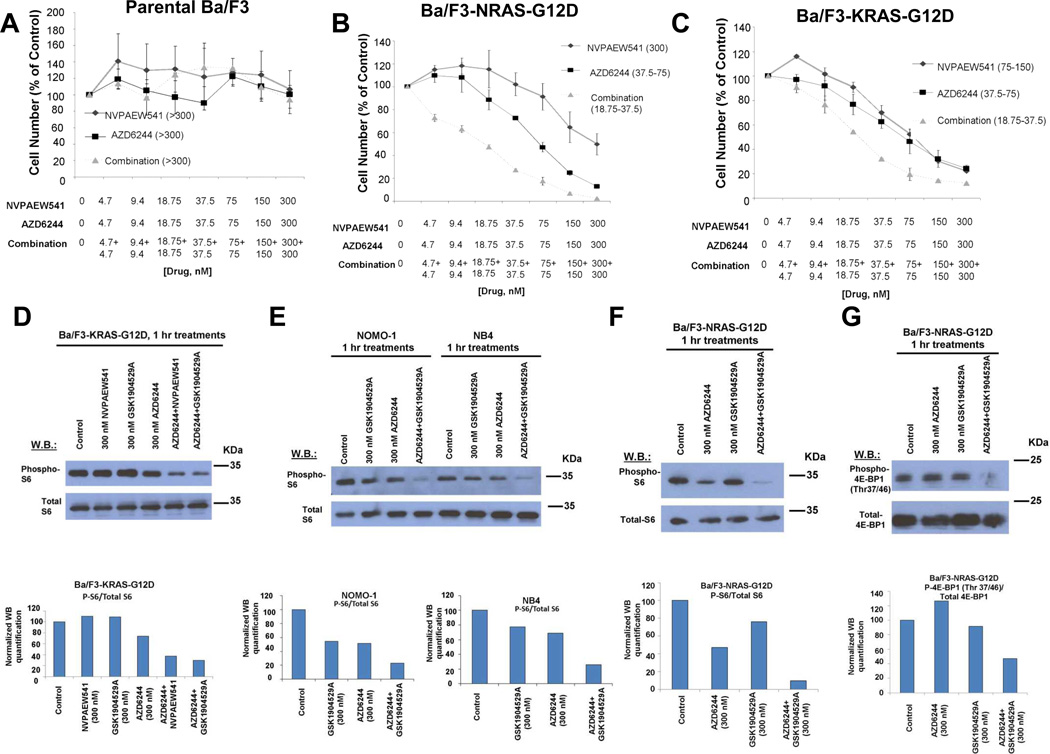
Experimental design: A chemical screen using RAS-dependent leukemia cells was developed to identify compounds with unanticipated activity in the presence of an MEK inhibitor and led to identification of inhibitors of IGF1R. Results were validated using cell-based proliferation, apoptosis, cell-cycle, and gene knockdown assays; immunoprecipitation and immunoblotting; and a noninvasive in vivo bioluminescence model of acute myeloid leukemia (AML).

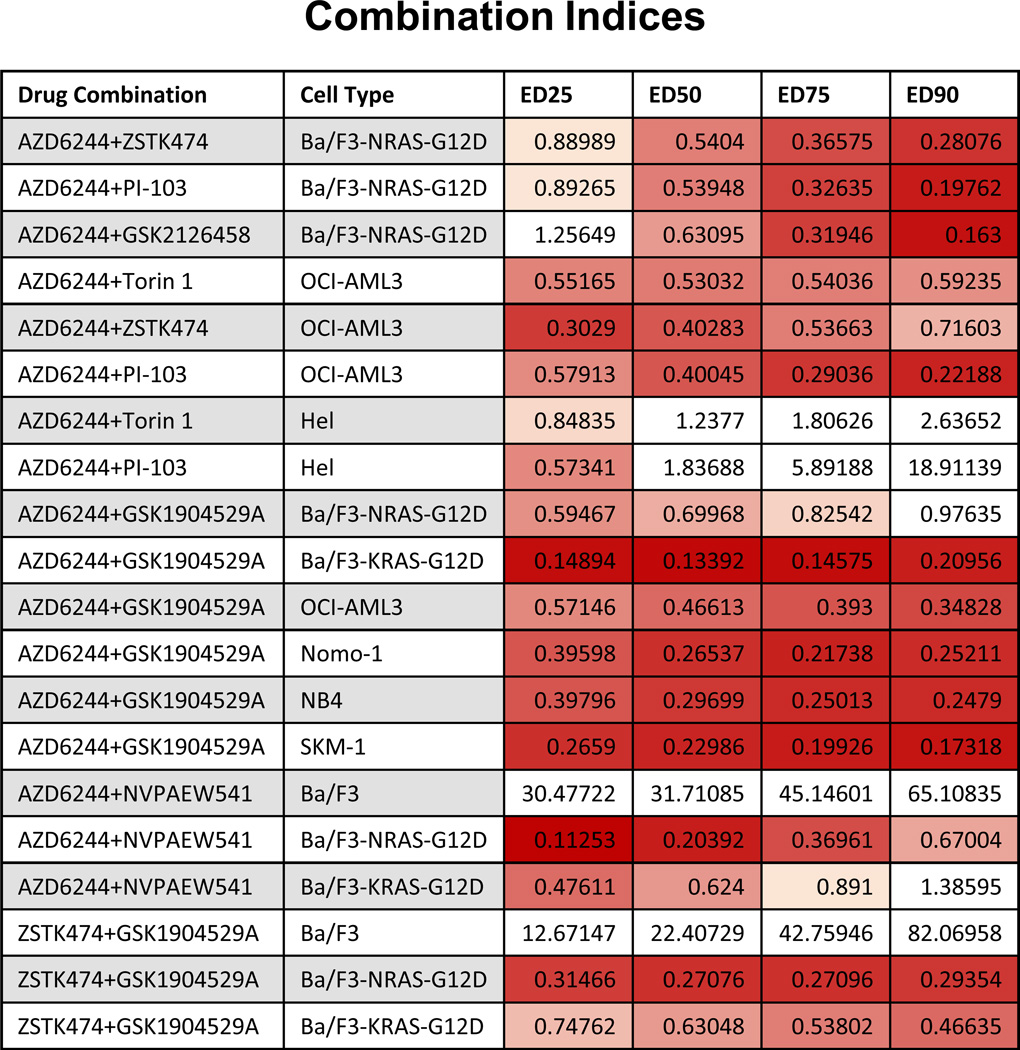
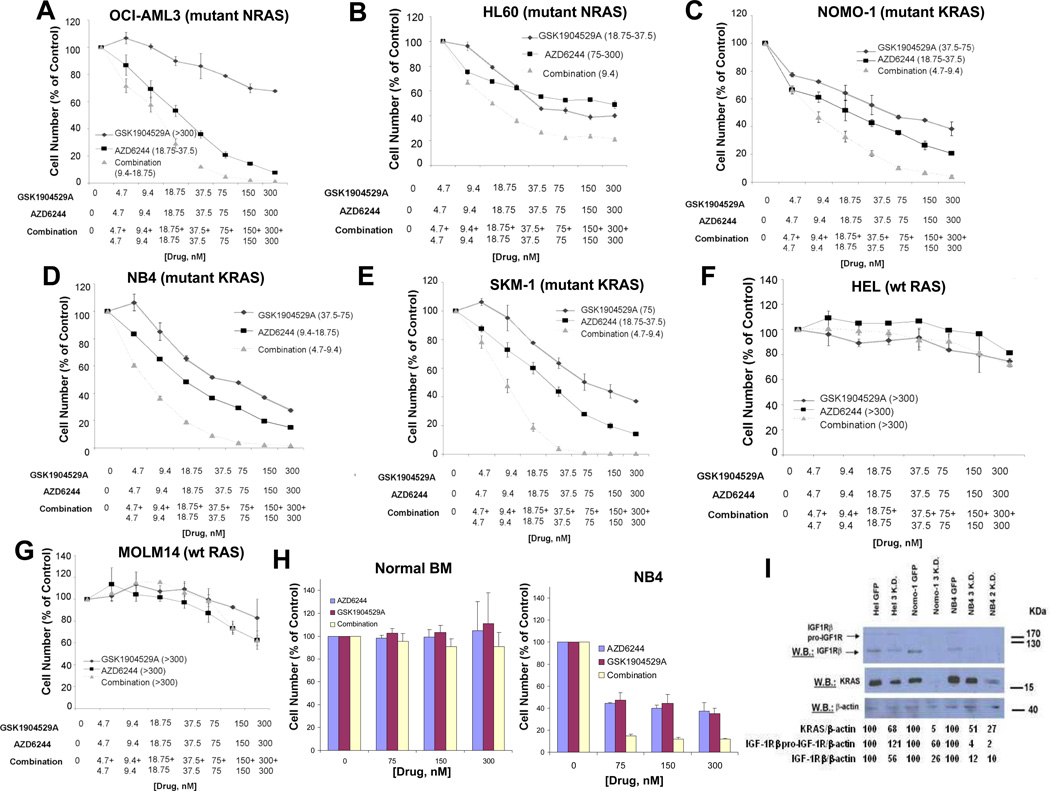
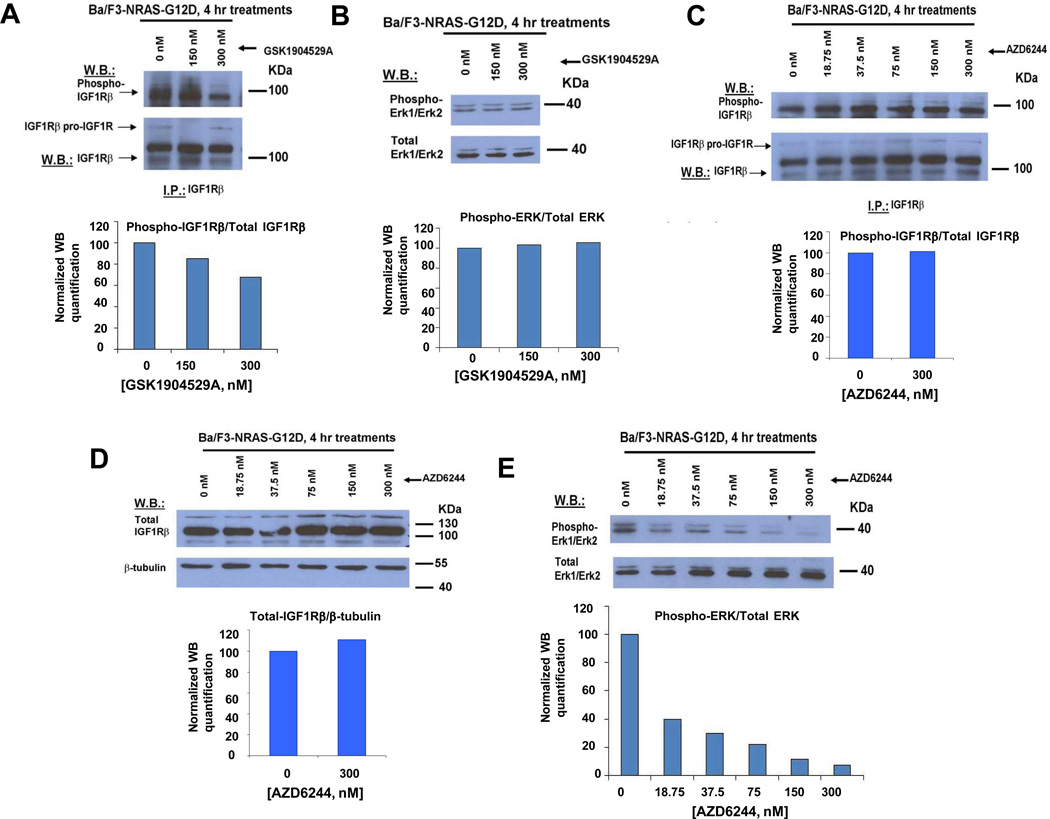
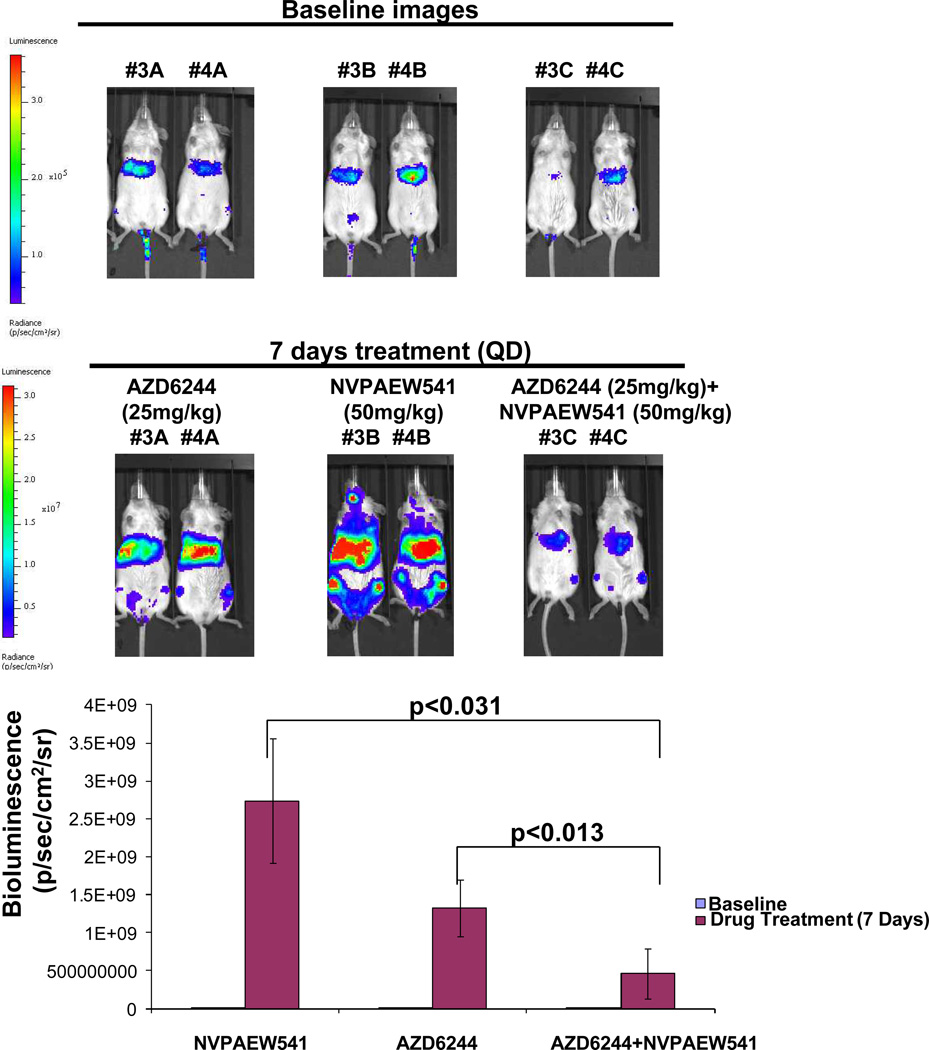
Results: Mechanistically, IGF1R protein expression/activity was substantially increased in mutant RAS-expressing cells, and suppression of RAS led to decreases in IGF1R. Synergy between MEK and IGF1R inhibitors correlated with induction of apoptosis, inhibition of cell-cycle progression, and decreased phospho-S6 and phospho-4E-BP1. In vivo, NSG mice tail veins injected with OCI-AML3-luc+ cells showed significantly lower tumor burden following 1 week of daily oral administration of 50 mg/kg NVP-AEW541 (IGF1R inhibitor) combined with 25 mg/kg AZD6244 (MEK inhibitor), as compared with mice treated with either agent alone. Drug combination effects observed in cell-based assays were generalized to additional mutant RAS-positive neoplasms.

Conclusions: The finding that downstream inhibitors of RAS signaling and IGF1R inhibitors have synergistic activity warrants further clinical investigation of IGF1R and RAS signaling inhibition as a potential treatment strategy for RAS-driven malignancies.


Conflict of interest statement

Conflict of Interest: None of the authors included in this manuscript have a financial conflict of interest.

Figures

Figure 1
Figure 1. Identification of Glaxo Smith Kline (GSK) IGF1R inhibitor, GSK1904529A, as able to potentiate the effects of MEK inhibition in mutant NRAS- and-KRAS-expressing cells; characterization of IGF1R protein expression in mutant NRAS and KRAS-expressing cells
(A–C) Approximately three-day proliferation studies performed with GSK1904529A and AZD6244 against Ba/F3-NRAS-G12D cells. AZD6244+GSK1904529A studies against Ba/F3 (n=3), Ba/F3-NRAS-G12D (n=6), and Ba/F3-KRAS-G12D cells (n=2). (D–E) IGF-1R expression in parental Ba/F3 versus Ba/F3-NRAS-G12D and Ba/F3-KRAS-G12D cells. (F) Comparison of IGF-1R expression in Ba/F3, Ba/F3.p210, Ba/F3-FLT3-ITD, and mutant RAS-expressing Ba/F3 cells. Shown in parentheses adjacent to figure legends are estimated IC50 values (nM) corresponding to individual drugs or drug combinations.
Figure 2
Figure 2. Combination indices corresponding to proliferation studies investigating effects of MEK inhibition combined with LINCS chemical library inhibitors against AML cell lines
Values less than 0.9 indicate synergy and are in shades of red (darker shades mean higher synergy). Values greater than 0.9 do not indicate synergy and are colored white. Values less than one indicate synergy, whereas values greater than one indicate antagonism. Calcusyn combination indices can be interpreted as follows: CI <0.1 indicate very strong synergism; values 0.1–0.3 indicate strong synergism; values 0.3–0.7 indicate synergism; values 0.7–0.85 indicate moderate synergism; values 0.85–0.90 indicate slight synergism; values 0.9–1.1 indicate nearly additive effects; values 1.10–1.20 indicate slight antagonism; values 1.20–1.45 indicate moderate antagonism; values 1.45–3.3 indicate antagonism; values 3.3–10 indicate strong antagonism; values >10 indicate very strong antagonism. Note: For some experiments, namely those in which there was no observed single agent activity, combination indices could not be reliably calculated using the Calcusyn software.
Figure 3
Figure 3. Combined effects of GSK1904529A and AZD6244 against human AML cells harboring wt or mutant RAS
(A) Approximately 72-hr representative proliferation study performed with GSK1904529A and AZD6244, against mutant NRAS-expressing OCI-AML3 (n=3). (B) Approximately 48-hr proliferation study performed with GSK1904529A and AZD6244 against mutant NRAS-expressing HL60. (C–E) Approximately 72-hr representative proliferation studies performed with GSK1904529A and AZD6244 against NOMO-1 (KRAS G13D) (n=4), NB4 (KRAS A18D) (n=2), or SKM-1 (KRAS K117N) (n=2) cells. (F–G) Approximately 72-hr representative proliferation studies performed with GSK1904529A and AZD6244, against wt Ras-expressing Hel (n=2) and Molm14 cells. Shown in parentheses adjacent to figure legends for all graphs (A–G) are estimated IC50 values (nM) corresponding to individual drugs or drug combinations. (H) Shown as a normal control are the effects of two days of treatment using GSK1904529A and AZD6244, alone and combined, against mononuclear cells derived from normal donors cultured in DMEM+ 10% FBS (n=3). NB4 cells were tested in parallel as a positive control for drug stock integrity. (I) Effect of knockdown of KRAS on IGF1R expression in wt and mutant KRAS-expressing AML cells. Hairpins “2” and “3” were used for knockdown experiments.
Figure 4
Figure 4. Effects of GSK1904529A and AZD6244 as single agents, respectively, on mediators of IGF-1R- and ERK1/ERK2-signaling pathways
(A–B) Effect of GSK1904529A on phosphorylation of IGF-1R (A) and Erk1/Erk2 (B). (C–E) Effect of AZD6244 on phosphorylation of IGF-1R (C), IGF-1R protein expression levels (D), and phosphorylation of Erk1/Erk2 (E).
Figure 5
Figure 5. Combined effects of Novartis IGF-1R inhibitor, NVPAEW541, and AZD6244 on mutant RAS-expressing cells; identification of S6 and 4E-BP1 as potential mediators of synergy between inhibitors of IGF-1R and MEK in mutant RAS-expressing cells
(A–C) Approximately 72-hr proliferation studies performed with NVPAEW541 and AZD6244, alone or combined, against parental Ba/F3 and Ba/F3-NRAS-G12D or Ba/F3-KRAS-G12D cells. Shown in parentheses adjacent to figure legends are estimated IC50 values (nM) corresponding to individual drugs or drug combinations. (D) Effects of IGF1R inhibition or MEK inhibition, alone or combined, on phospho-S6 expression in Ba/F3-KRAS-G12D cells. (E) Effects of IGF-1R inhibition or MEK inhibition, alone or combined, on phospho-S6 expression in active KRAS-expressing human AML lines, Nomo-1 and NB4. (F) Effects of IGF-1R inhibition, alone or combined, on phospho-S6 expression in Ba/F3-NRAS-G12D cells. (G) Effects of IGF-1R inhibition, alone or combined, on phospho-4E-BP1 (Thr 37/46) in Ba/F3-NRAS-G12D cells.
Figure 6
Figure 6. Combined effects of IGF-1R and MEK inhibition in an in vivo model of mutant NRAS-positive leukemia
In vivo effects of NVP-AEW541 and AZD6244, alone and combined, in a xenograft model of mutant NRAS-positive AML. Representative mouse images are shown comparing baseline images prior to drug treatment and following 7 days of treatment with NVP-AEW541 (50 mg/kg once per day), AZD6244 (25 mg/kg once per day), or a combination of the two agents. Corresponding bioluminescence values for NVP-AEW541-treated mice (n=3), AZD6244-treated mice (n=4), and combination-treated mice (n=4) are shown as a bar graph. P values indicating statistical significance are shown and were derived by Student's t test. Significance was defined as p<0.05.

References

    1. Ward AF, Braun BS, Shannon KM. Targeting oncogenic RAS signaling in hematologic malignancies. Blood. 2012;120:3397–3406. - PMC - PubMed
    1. Tyner JW, Erickson H, Deininger MWV, Willis SG, Eide CA, Levine RL, et al. High-throughput sequencing screen reveals novel, transforming RAS mutations in myeloid leukemia patients. Blood. 2009;113:1749–1755. - PMC - PubMed
    1. MacKenzie KL, Dobnikov A, Millington M, Shounan Y, Symonds G. Mutant N-ras induces myeloproliferative disorders and apoptosis in bone marrow repopulated mice. Blood. 1999;93:2043–2056. - PubMed
    1. Parikh C, Subrabmanyam R, Ren R. Oncogenic NRAS rapidly and efficiently induces CMML- and AML-like diseases in mice. Blood. 2006;108:2349–2357. - PMC - PubMed
    1. Parikh C, Subrahmanyam R, Ren R. Oncogenic NRAS, KRAS, and HRAS exhibit different leukemogenic potentials in mice. Cancer Res. 2007;67:7139–7146. - PMC - PubMed

Publication types

MeSH terms