. 2015 Apr;17(2):177-84.
doi: 10.1007/s11307-014-0784-6.

Measuring extracellular pH in a lung fibrosis model with acidoCEST MRI

Affiliations

Measuring extracellular pH in a lung fibrosis model with acidoCEST MRI

Kyle M Jones et al. Mol Imaging Biol. 2015 Apr.

Abstract

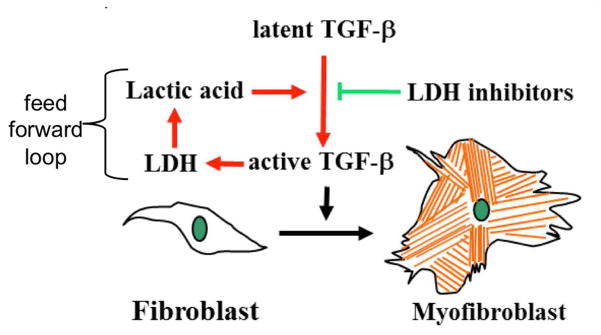
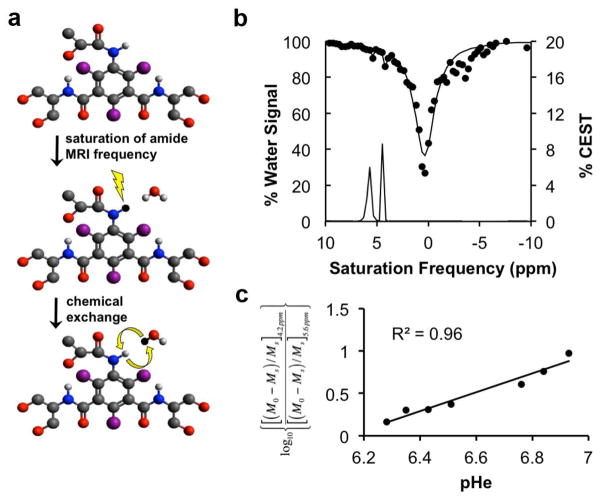
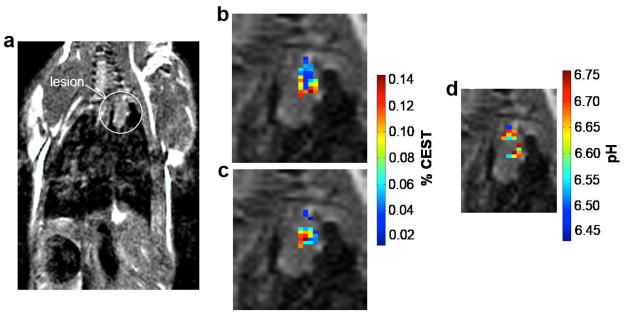
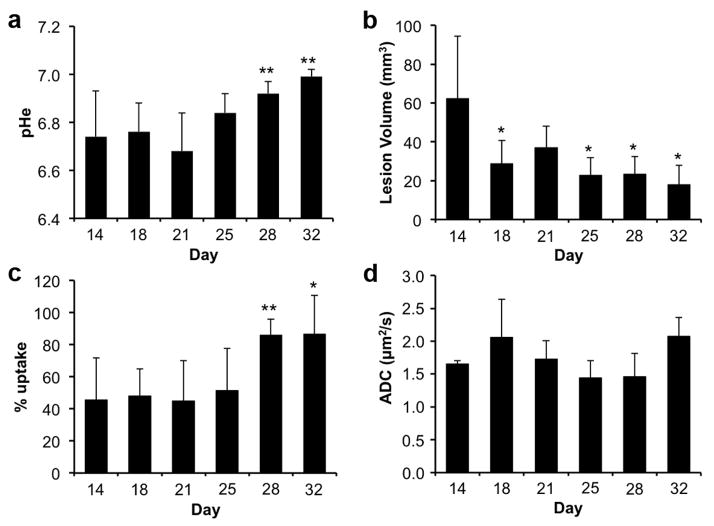
Purpose: A feed-forward loop involving lactic acid production may potentially occur during the formation of idiopathic pulmonary fibrosis. To provide evidence for this feed-forward loop, we used acidoCEST MRI to measure the extracellular pH (pHe), while also measuring percent uptake of the contrast agent, lesion size, and the apparent diffusion coefficient (ADC).

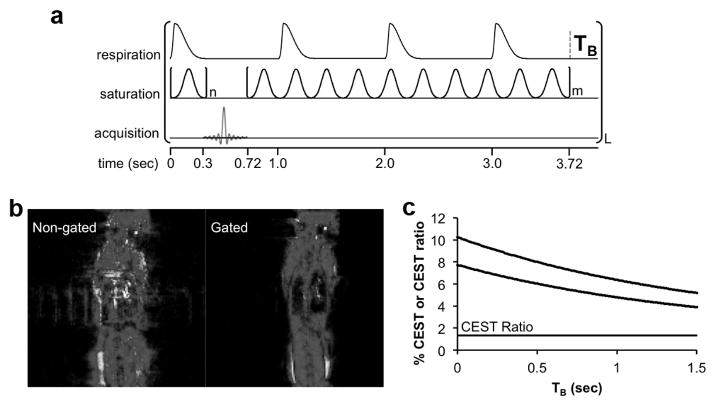
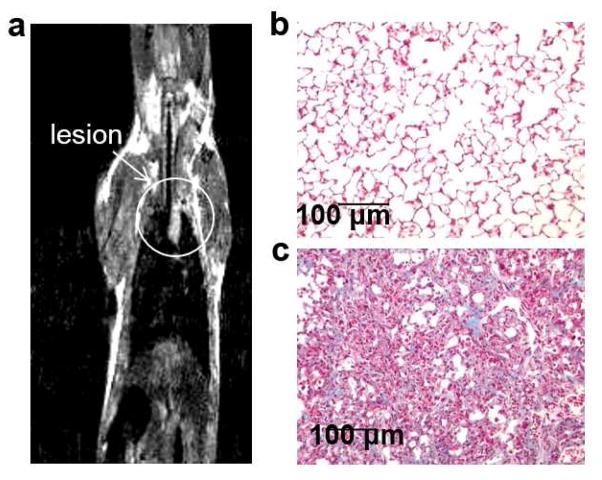
Procedures: We developed a respiration-gated version of acidoCEST MRI to improve the measurement of pHe and percent uptake in lesions. We also used T2-weighted MRI to measure lesion volumes and diffusion-weighted MRI to measure ADC.

Results: The longitudinal changes in average pHe and % uptake of the contrast agent were inversely related to reduction in lung lesion volume. The average ADC did not change during the time frame of the study.

Conclusions: The increase in pHe during the reduction in lesion volume indicates a role for lactic acid in the proposed feed-forward loop of IPF.


Conflict of interest statement

CONFLICT OF INTEREST STATEMENT:

The authors declare that they have no conflict of interest.

Figures

Figure 1
Figure 1
A schematic of a proposed feed-forward loop that may drive idiopathic pulmonary fibrosis.
Figure 2
Figure 2
Respiration-gated CEST-FISP MRI. a the respiration gated CEST-FISP MRI pulse sequence is triggered to start at initial inspiration. The initial CEST saturation period ends shortly after the end of expiration, followed by the FISP MR acquisition. An additional CEST saturation period at the next saturation frequency is then applied. A variable time TB occurs before the next inspiration triggers the start of the next pulse sequence. b Non-gated vs. gated Images show the improvement in image quality with gating. c Because respiration-gated CEST- FISP MRI has a variable time TB, a simulation of the two CEST effects was performed to show that the % CEST at 4.2 ppm (top line) and % CEST at 5.6 ppm (middle line) both decay during TB, but this decay does not affect the CEST ratio (bottom line) and therefore did not affect pH measurements.
Figure 3
Figure 3
CEST MRI of iopamidol. a Selective saturation of one amide proton of iopamidol causes a loss of coherent net magnetization from the proton (shown as a conversion of the proton from white to black). Subsequent chemical exchange of the proton from iopamidol to water transfers the saturation to the water. Only protons of the three amide groups and water are shown. b An in vivo CEST spectrum of iopamidol in the lung with Lorentzian line shapes fitted to the CEST spectrum. c A calibration plot of iopamidol correlating the a log10 ratio of the two CEST effects with pHe.
Figure 4
Figure 4
Collagen histopathology assay. a A MR image shows the location of the lesion. Histopathology images of b healthy control tissue and c bleomycin treated tissue show a difference in collagen staining.
Figure 5
Figure 5
A representative pHe map of a lung lesion. a A spin-echo MR image shows the location of the lung lesion. The % CEST b at 4.2 ppm and c at 5.5 ppm show that statistically significant CEST effects were detected in the lesion. d The ratio of the CEST effects were used to determine pHe.
Figure 6
Figure 6
Longitudinal assessments of lung lesions. a The average pHe, b average lesion volume, c average % uptake of the agent, and d average ADC value of each group of mice are shown for each day. Error bars represent the standard deviations of the average for each group. Statistically significant differences relative to a measurement on Day 14 are indicated with an asterisk (* p<0.05, ** p< 0.01).

References

    1. Nathan SD, Shlobin OA, Weir N, et al. Long-term course and prognosis of idiopathic pulmonary fibrosis in the new millennium. Chest. 2011;140:221–229. - PubMed
    1. Richeldi L. Assessing the treatment effect from multiple trials in idiopathic pulmonary fibrosis. Eur Respir Rev. 2012;21:147–151. - PMC - PubMed
    1. Ley B, Collard HR, King TE., Jr Clinical course and prediction of survival in idiopathic pulmonary fibrosis. Am J Respir Crit Care Med. 2011;183:431–440. - PubMed
    1. Sime PJ, Samstrand B, Xing Z, et al. Adenovirus-mediated gene transfer of the proteoglycan biglycan induces fibroblastic responses in the lung. Chest. 1997;111:137S. - PubMed
    1. Tarantal AF, Chen H, Shi TT, et al. Overexpression of transforming growth factor-beta1 in fetal monkey lung results in pulmonary fibrosis. Eur Respir J. 2010;36:907–914. - PMC - PubMed

Publication types

LinkOut - more resources