. 2015 Jan;64(1):158-71.
doi: 10.2337/db13-1639. Epub 2014 Sep 3.

Interleukin-10+ regulatory B cells arise within antigen-experienced CD40+ B cells to maintain tolerance to islet autoantigens

Affiliations

Interleukin-10+ regulatory B cells arise within antigen-experienced CD40+ B cells to maintain tolerance to islet autoantigens

Sonja Kleffel et al. Diabetes. 2015 Jan.

Abstract

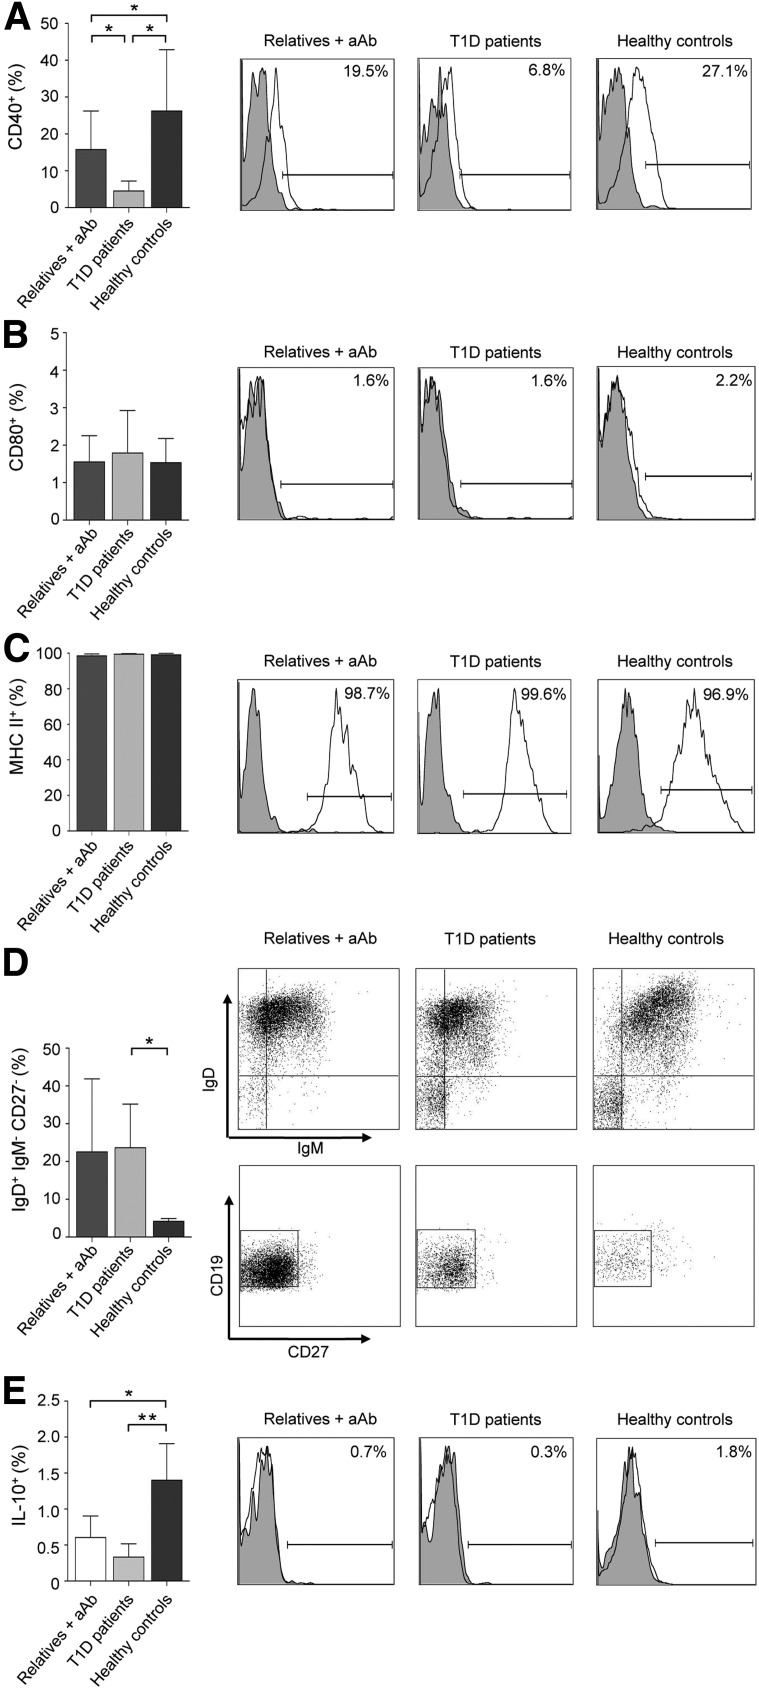
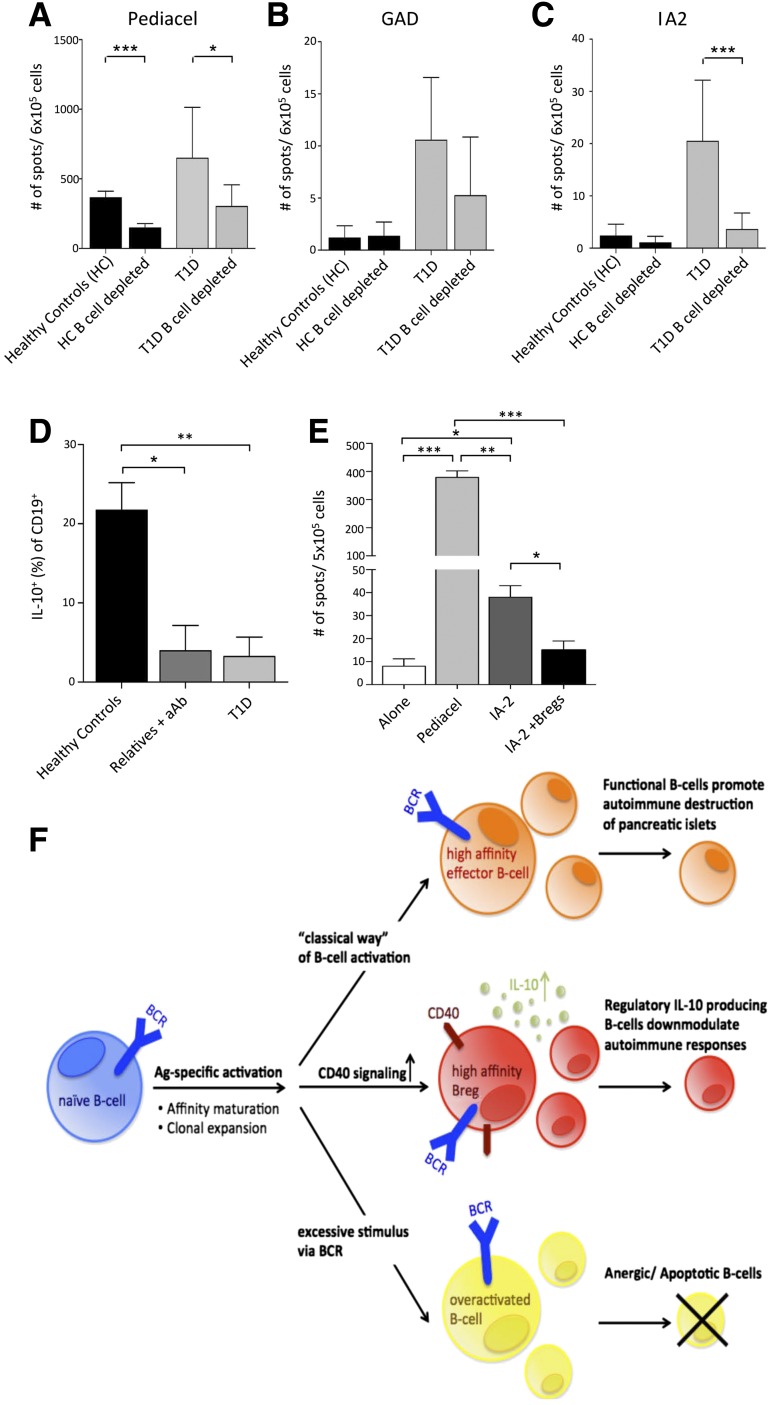
Impaired regulatory B cell (Breg) responses are associated with several autoimmune diseases in humans; however, the role of Bregs in type 1 diabetes (T1D) remains unclear. We hypothesized that naturally occurring, interleukin-10 (IL-10)-producing Bregs maintain tolerance to islet autoantigens, and that hyperglycemic nonobese diabetic (NOD) mice and T1D patients lack these potent negative regulators. IgVH transcriptome analysis revealed that islet-infiltrating B cells in long-term normoglycemic (Lnglc) NOD, which are naturally protected from diabetes, are more antigen-experienced and possess more diverse B-cell receptor repertoires compared to those of hyperglycemic (Hglc) mice. Importantly, increased levels of Breg-promoting CD40(+) B cells and IL-10-producing B cells were found within islets of Lnglc compared to Hglc NOD. Likewise, healthy individuals showed increased frequencies of both CD40(+) and IL-10(+) B cells compared to T1D patients. Rituximab-mediated B-cell depletion followed by adoptive transfer of B cells from Hglc mice induced hyperglycemia in Lnglc human CD20 transgenic NOD mouse models. Importantly, both murine and human IL-10(+) B cells significantly abrogated T-cell-mediated responses to self- or islet-specific peptides ex vivo. Together, our data suggest that antigen-matured Bregs may maintain tolerance to islet autoantigens by selectively suppressing autoreactive T-cell responses, and that Hglc mice and individuals with T1D lack this population of Bregs.


Figures

Figure 1
Figure 1
Characterization of pancreatic islets in NOD mice. A: Quantification of lymphoid infiltrate by insulitis scoring of H&E–stained pancreatic tissue sections. B: Representative H&E staining (1–5) and immunohistochemical (IHC) analysis of B220 (6–10), CD3 (11–15), insulin (16–20), TUNEL (21–25), and Ki-67 (26–30) expression in serial pancreatic islet tissue sections from NOD mice. C: Relative B220 mRNA expression within the pancreatic islet as determined by quantitative PCR amplification. D: Serum levels of IAA and (E) BAFF, as determined by radioassay analysis. F: Computer-aided quantification of B220 expression and TUNEL positivity of IHC-stained pancreatic tissue sections. G: Quantification of ectopic GCs in IHC-stained serial pancreatic tissue sections for B220, Bcl-6, PNA, CD3, and Ki-67. H: Representative IHC images of an ectopic GC within the pancreatic islets of a 10-week-old Nglc NOD mouse. Bars represent mean ± SEM. wks, weeks. *P ≤ 0.05; **P ≤ 0.01; ***P ≤ 0.001.
Figure 2
Figure 2
IgVH transcriptome analysis of islet-infiltrating B cells isolated from different groups of NOD mice. (A) Quantification of nucleotide mutations from the germline within the entire IgVH sequence and (B) summary of the average number of nucleotide mutations per group. (C) Quantification of amino acid replacement mutations from the germline within the entire IgVH sequences and (D) summary of the average number of amino acid mutations per group. (E) Distribution of amino acid mutations within the framework (FR) and the CDR of the IgVH region and (F) the average numbers of amino acid mutations within the CDR3 region. Bars represent mean ± SEM. wks, weeks. *P ≤ 0.05.
Figure 3
Figure 3
Molecular characterization of islet-infiltrating B cells obtained from different groups of NOD mice. A: Isotype-specific mRNA expression as determined by RT-PCR amplification and sequencing of isotype-specific Ig constant region domains of islet-infiltrating B cells. B: Representative agarose gel images. C: Quantification of B-cell clones within B-cell receptor libraries by analysis of their unique CDR3 sequences. D: Assessment of clonal variants by analysis of IgVH regions within clonal populations with identical CDR3 sequences. E: Quantification of intraclonal isotype switches as determined by isotype-specific constant region analysis of sequences with identical CDR3 regions. Bars represent means ± SEM. wks, weeks. *P ≤ 0.05; **P ≤ 0.01.
Figure 4
Figure 4
Phenotypic characterization of splenic and pancreatic murine B cells isolated from C57BL/6, NOR, and NOD mice, as indicated. Flow cytometric analysis for expression of CD40 by splenic (A) or pancreatic (B) B220+ B cells, CD80 by splenic (C) or pancreatic (D) B220+ B cells, and MHC II by splenic (E) or pancreatic (F) B220+ B cells. Assessment of anergic CD93+CD23+IgMlow splenic (G) or pancreatic B220+ (H) B cells, as determined by flow cytometry. IL-10 expression by splenic (I) vs. pancreatic (J) B220+ B cells as determined by intracellular flow cytometric staining. White peaks indicate antigen-specific staining, gray peaks show respective isotype control staining. Mean percentages ± SEM of marker expression (left) and representative flow cytometry plots (right), respectively. wks, weeks. *P ≤ 0.05; **P ≤ 0.01; ***P ≤ 0.001.
Figure 5
Figure 5
Antigen-presenting and immunoregulatory functions of B-cell populations in NOD mice. A: Quantification of IFN-γ–producing cells in an ex vivo ELISPOT assay of CD4+ T cells stimulated by the self-peptide BDC2.5 in the presence of total B cells to assess their Ag-presenting capacities. B: Quantification of IFN-γ–producing cells in an ex vivo ELISPOT assay of CD4+ T cells stimulated by BDC2.5 peptide in the presence of bone marrow–derived DCs to assess the immunosuppressive capacity of total B cells isolated from different experimental groups of NOD mice. C: Evaluation of diabetes onset after adoptive transfer of B and T cells isolated from Nglc, Hglc, and Lnglc NOD mice into NOD.Scid recipients (n = 5). Kaplan-Meier analysis was used to graph diabetes onset. D: Flow cytometry of IL-10+B220+ B cells pre- (bottom) and post- (top) enrichment. E: Quantification of IFN-γ–producing cells in an ex vivo ELISPOT assay of CD4+ T cells stimulated by BDC2.5 peptide in the presence of IL-10 or IL-10+ B220+ B cells and in the presence of anti–IL-10 Ab-mediated blockade (F) to assess the immunosuppressive capacity of IL-10+ vis-à-vis IL-10 B220+ B cells. G: Flow cytometric analysis of T-cell activation (CD44/CD62L) and differentiation (IL-2, -4, and -17 cytokine production) upon Breg coculture. H: Quantification of IFN-γ–producing cells in an ex vivo ELISPOT assay of CD4+ T cells stimulated by BDC2.5 peptide in the presence of bone marrow–derived DCs and IL-10 or IL-10+ B220+ B cells to assess the immunosuppressive capacity of IL-10+ vis-à-vis IL-10 B220+ B cells. I: Adoptive co-transfer of IL-10+B220+ or IL-10B220+ cells with diabetogenic CD4+ T cells obtained from Hglc NOD mice into NOD.Scid mice (n = 4). Kaplan-Meier analysis was used to graph diabetes onset. J: Representative flow cytometry of peripheral B cells in hCD20(+/+) NOD mice pre–B-cell depletion using rituximab (left), postdepletion (middle), and after adoptive transfer with murine Hglc CD19+ B cells (right), and evaluation of diabetes onset in untreated, rituximab-depleted, and untreated or rituximab-depleted mice that were adoptively transferred with B cells obtained from Hglc NOD mice in Lnglc hCD20(+/+) NOD mice (n = 3–7, respectively). Kaplan-Meier analysis was used to graph diabetes onset. Bars represent mean ± SEM. wks, weeks. *P ≤ 0.05; **P ≤ 0.01; ***P ≤ 0.001.
Figure 6
Figure 6
Phenotypic characterization of human peripheral B cells. Expression of the B-cell activation markers CD40 (A), CD80 (B), and MHC II (C) by CD19+ B cells isolated from PBMCs of healthy individuals, aAb+ relatives, and individuals with T1D. Frequencies of anergic IgD+IgMCD27CD19+ B cells (D) and of IL-10+ CD19+ B cells (E) isolated from PBMCs of healthy individuals, aAb+ relatives, and individuals with T1D as determined by flow cytometry. White peaks indicate antigen-specific staining, gray peaks show respective isotype control staining. Mean percentages of marker expression (left) and representative flow cytometric plots (right). Bars represent mean ± SEM.*P ≤ 0.05; **P ≤ 0.01.
Figure 7
Figure 7
Immunoregulatory properties of human B cells. A: Quantification of IFN-γ–producing cells within PBMCs or B-cell–depleted PBMCs stimulated ex vivo with Pediacel (positive control) (A) or the aAgs GAD (B)and IA-2 (C), as determined by ELISPOT assay. D: Quantification of ex vivo–generated IL-10+CD19+ B cells, as determined by flow cytometry. E: Quantification of IFN-γ–producing cells within PBMCs isolated from T1D patients stimulated ex vivo with IA-2 in the presence or absence of IL-10+CD19+ B cells, as determined by ELISPOT assay. F: Hypothesis summarizing the generation of autoreactive, anergic, or Bregs in the context of autoimmunity. Bars represent mean ± SEM. *P ≤ 0.05; **P ≤ 0.01; ***P ≤ 0.001.

References

    1. Bluestone JA, Pardoll D, Sharrow SO, Fowlkes BJ. Characterization of murine thymocytes with CD3-associated T-cell receptor structures. Nature 1987;326:82–84 - PubMed
    1. Noorchashm H, Noorchashm N, Kern J, Rostami SY, Barker CF, Naji A. B-cells are required for the initiation of insulitis and sialitis in nonobese diabetic mice. Diabetes 1997;46:941–946 - PubMed
    1. Fiorina P, Vergani A, Dada S, et al. Targeting CD22 reprograms B-cells and reverses autoimmune diabetes. Diabetes 2008;57:3013–3024 - PMC - PubMed
    1. Serreze DV, Chapman HD, Varnum DS, et al. B lymphocytes are essential for the initiation of T cell-mediated autoimmune diabetes: analysis of a new "speed congenic" stock of NOD.Ig mu null mice. J Exp Med 1996;184:2049–2053 - PMC - PubMed
    1. Lanzavecchia A. Antigen-specific interaction between T and B cells. Nature 1985;314:537–539 - PubMed

Publication types

MeSH terms