Adiponectin regulates bone marrow mesenchymal stem cell niche through a unique signal transduction pathway: an approach for treating bone disease in diabetes
- PMID: 25187480
- PMCID: PMC4681406
- DOI: 10.1002/stem.1844
Adiponectin regulates bone marrow mesenchymal stem cell niche through a unique signal transduction pathway: an approach for treating bone disease in diabetes
Abstract
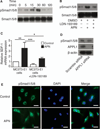
Adiponectin (APN) is an adipocyte-secreted adipokine that exerts well-characterized antidiabetic properties. Patients with type 2 diabetes (T2D) are characterized by reduced APN levels in circulation and impaired stem cell and progenitor cell mobilization from the bone marrow for tissue repair and remodeling. In this study, we found that APN regulates the mobilization and recruitment of bone marrow-derived mesenchymal stem cells (BMSCs) to participate in tissue repair and regeneration. APN facilitated BMSCs migrating from the bone marrow into the circulation to regenerate bone by regulating stromal cell-derived factor (SDF)-1 in a mouse bone defect model. More importantly, we found that systemic APN infusion ameliorated diabetic mobilopathy of BMSCs, lowered glucose concentration, and promoted bone regeneration in diet-induced obesity mice. In vitro studies allowed us to identify Smad1/5/8 as a novel signaling mediator of APN receptor (AdipoR)-1 in BMSCs and osteoblasts. APN stimulation of MC3T3-E1 osteoblastic cells led to Smad1/5/8 phosphorylation and nuclear localization and increased SDF-1 mRNA expression. Although APN-mediated phosphorylation of Smad1/5/8 occurred independently from adaptor protein, phosphotyrosine interaction, pleckstrin homology domain, and leucine zipper containing 1, it correlated with the disassembly of protein kinase casein kinase 2 and AdipoR1 in immunoprecipitation experiments. Taken together, this study identified APN as a regulator of BMSCs migration in response to bone injury. Therefore, our findings suggest APN signaling could be a potential therapeutic target to improve bone regeneration and homeostasis, especially in obese and T2D patients.
Keywords: Adiponectin; Bone regeneration; Cell mobilization; Mesenchymal stem cells.
© 2014 AlphaMed Press.
Conflict of interest statement
The authors have no potential conflicts of interest.
Figures


Similar articles
-
Stromal cell-derived factor-1 receptor CXCR4-overexpressing bone marrow mesenchymal stem cells accelerate wound healing by migrating into skin injury areas.Cell Reprogram. 2013 Jun;15(3):206-15. doi: 10.1089/cell.2012.0046. Cell Reprogram. 2013. PMID: 23713431 Free PMC article.
-
Stromal cell-derived factor-1β mediates cell survival through enhancing autophagy in bone marrow-derived mesenchymal stem cells.PLoS One. 2013;8(3):e58207. doi: 10.1371/journal.pone.0058207. Epub 2013 Mar 5. PLoS One. 2013. PMID: 23472159 Free PMC article.
-
Stromal cell-derived factor-1β potentiates bone morphogenetic protein-2-stimulated osteoinduction of genetically engineered bone marrow-derived mesenchymal stem cells in vitro.Tissue Eng Part A. 2013 Jan;19(1-2):1-13. doi: 10.1089/ten.TEA.2012.0085. Epub 2012 Aug 21. Tissue Eng Part A. 2013. PMID: 22779446 Free PMC article.
-
Adiponectin Resistance in Obesity: Adiponectin Leptin/Insulin Interaction.Adv Exp Med Biol. 2024;1460:431-462. doi: 10.1007/978-3-031-63657-8_15. Adv Exp Med Biol. 2024. PMID: 39287861 Review.
-
A Mini-Review: The Therapeutic Potential of Bone Marrow Mesenchymal Stem Cells and Relevant Signaling Cascades.Curr Stem Cell Res Ther. 2019;14(3):214-218. doi: 10.2174/1574888X13666180912141228. Curr Stem Cell Res Ther. 2019. PMID: 30207242 Review.
Cited by
-
Recent progress in bone-repair strategies in diabetic conditions.Mater Today Bio. 2023 Oct 20;23:100835. doi: 10.1016/j.mtbio.2023.100835. eCollection 2023 Dec. Mater Today Bio. 2023. PMID: 37928253 Free PMC article. Review.
-
Adiponectin enhances bone marrow mesenchymal stem cell resistance to flow shear stress through AMP-activated protein kinase signaling.Sci Rep. 2016 Jul 15;6:28752. doi: 10.1038/srep28752. Sci Rep. 2016. PMID: 27418435 Free PMC article.
-
Overexpression of MiR-335-5p Promotes Bone Formation and Regeneration in Mice.J Bone Miner Res. 2017 Dec;32(12):2466-2475. doi: 10.1002/jbmr.3230. Epub 2017 Aug 28. J Bone Miner Res. 2017. PMID: 28846804 Free PMC article.
-
Obesity prolongs the pro-inflammatory response and attenuates bone healing on titanium implants.Acta Biomater. 2025 Jan 15;192:473-486. doi: 10.1016/j.actbio.2024.11.040. Epub 2024 Nov 23. Acta Biomater. 2025. PMID: 39586347
-
Vaspin regulates the osteogenic differentiation of MC3T3-E1 through the PI3K-Akt/miR-34c loop.Sci Rep. 2016 May 9;6:25578. doi: 10.1038/srep25578. Sci Rep. 2016. PMID: 27156573 Free PMC article.
References
Publication types
MeSH terms
Substances
Grants and funding
LinkOut - more resources
Full Text Sources
Other Literature Sources
Medical
Molecular Biology Databases
Miscellaneous

