. 2014 Nov;88(22):13149-60.
doi: 10.1128/JVI.01884-14. Epub 2014 Sep 3.

Mitogen-activated protein kinase-interacting kinase regulates mTOR/AKT signaling and controls the serine/arginine-rich protein kinase-responsive type 1 internal ribosome entry site-mediated translation and viral oncolysis

Affiliations

Mitogen-activated protein kinase-interacting kinase regulates mTOR/AKT signaling and controls the serine/arginine-rich protein kinase-responsive type 1 internal ribosome entry site-mediated translation and viral oncolysis

Michael C Brown et al. J Virol. 2014 Nov.

Abstract

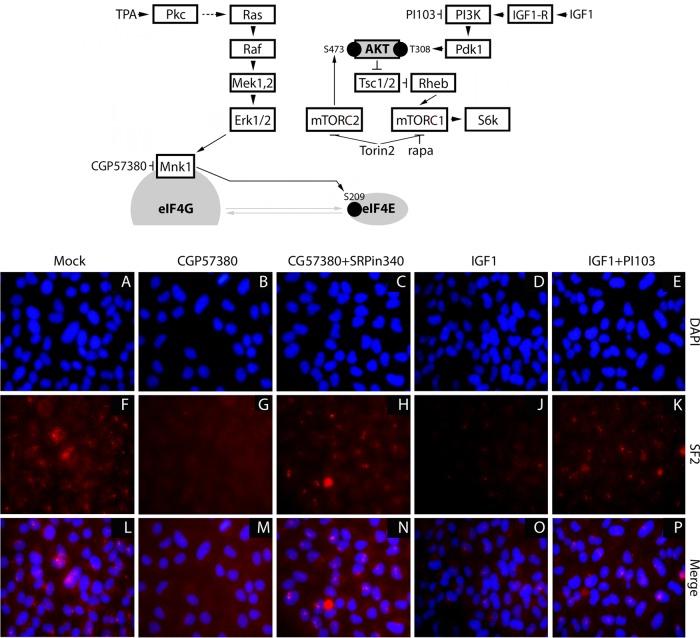
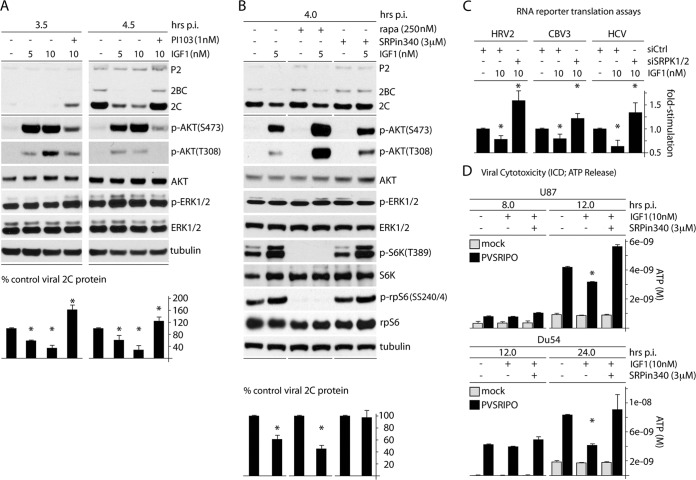
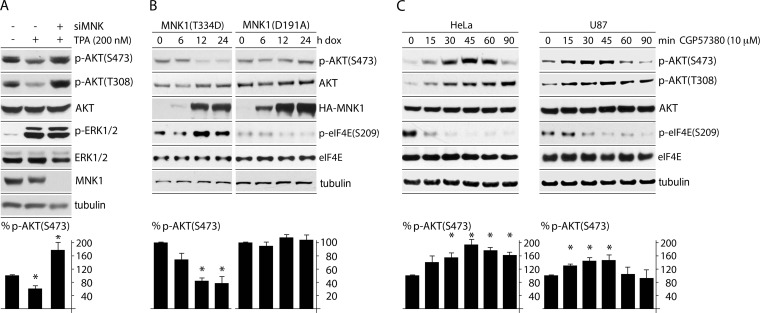
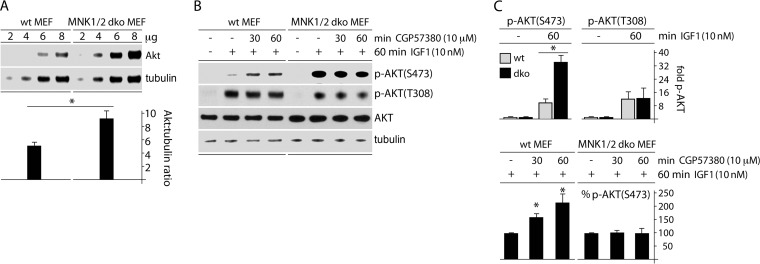
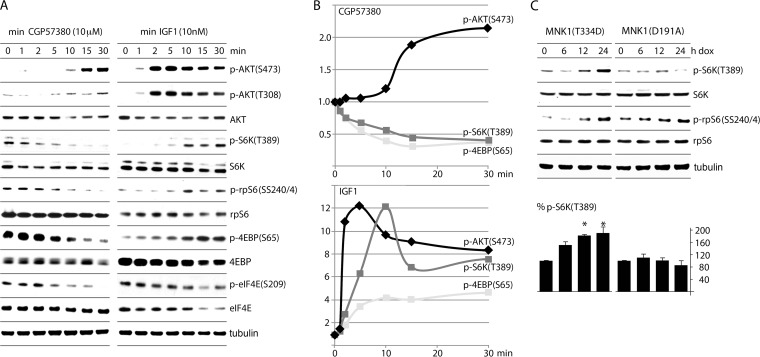
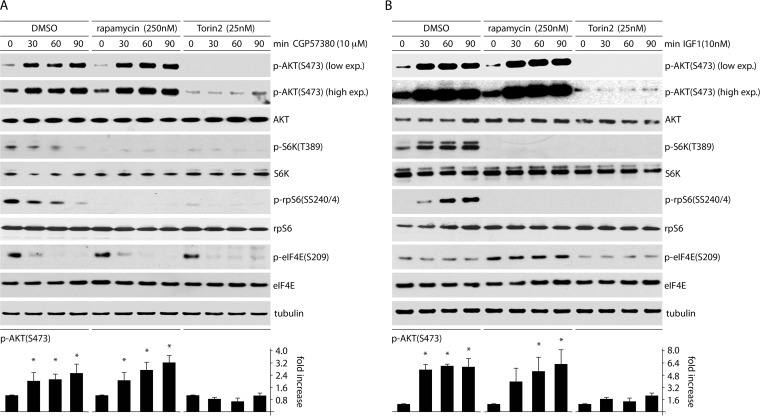
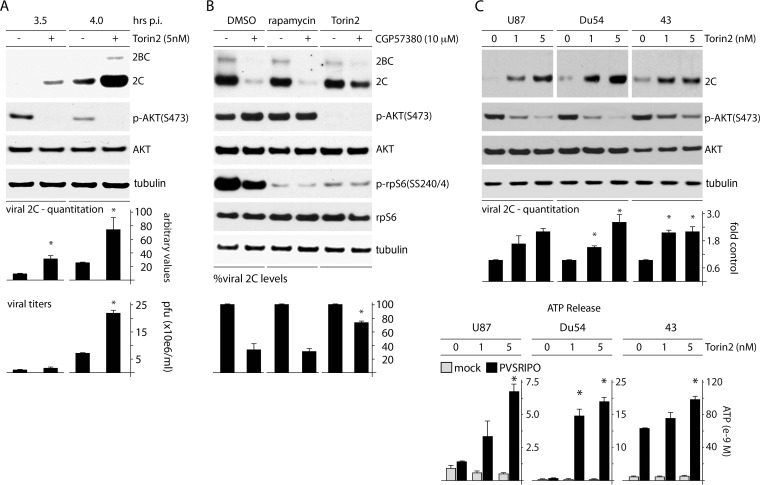
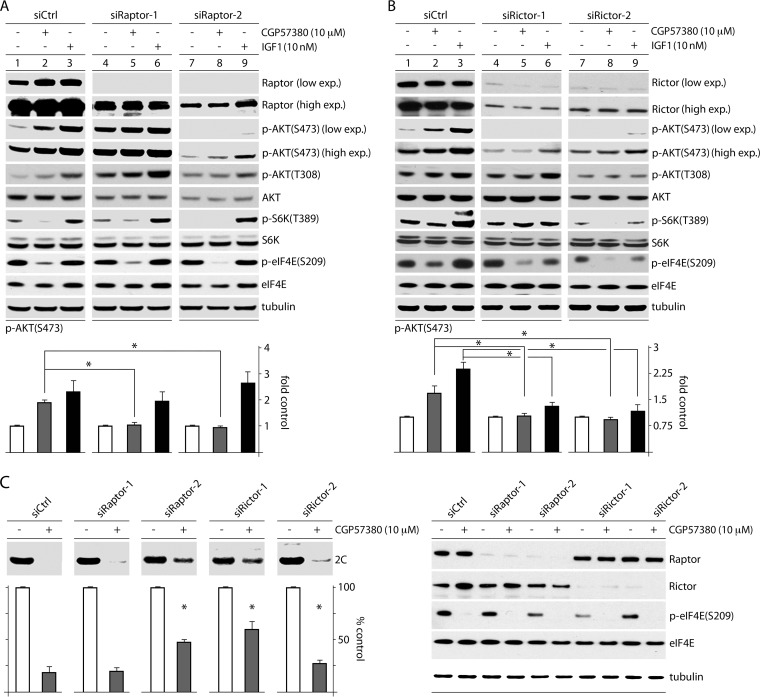
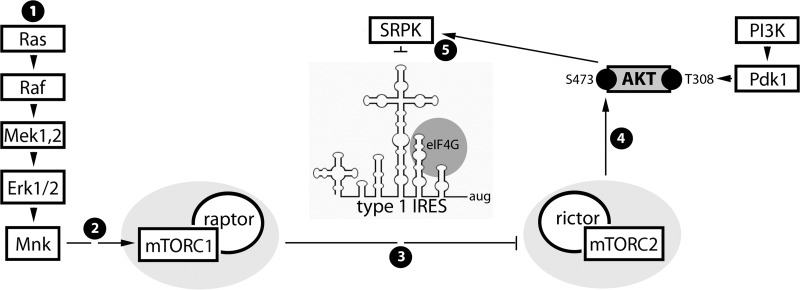
Translation machinery is a major recipient of the principal mitogenic signaling networks involving Raf-ERK1/2 and phosphoinositol 3-kinase (PI3K)-mechanistic target of rapamycin (mTOR). Picornavirus internal ribosomal entry site (IRES)-mediated translation and cytopathogenic effects are susceptible to the status of such signaling cascades in host cells. We determined that tumor-specific cytotoxicity of the poliovirus/rhinovirus chimera PVSRIPO is facilitated by Raf-ERK1/2 signals to the mitogen-activated protein kinase (MAPK)-interacting kinase (MNK) and its effects on the partitioning/activity of the Ser/Arg (SR)-rich protein kinase (SRPK) (M. C. Brown, J. D. Bryant, E. Y. Dobrikova, M. Shveygert, S. S. Bradrick, V. Chandramohan, D. D. Bigner, and M, Gromeier, J. Virol. 22:13135-13148, 2014, doi:http://dx.doi.org/10.1128/JVI.01883-14). Here, we show that MNK regulates SRPK via mTOR and AKT. Our investigations revealed a MNK-controlled mechanism acting on mTORC2-AKT. The resulting suppression of AKT signaling attenuates SRPK activity to enhance picornavirus type 1 IRES translation and favor PVSRIPO tumor cell toxicity and killing.

Importance: Oncolytic immunotherapy with PVSRIPO, the type 1 live-attenuated poliovirus (PV) (Sabin) vaccine containing a human rhinovirus type 2 (HRV2) IRES, is demonstrating early promise in clinical trials with intratumoral infusion in recurrent glioblastoma (GBM). Our investigations demonstrate that the core mechanistic principle of PVSRIPO, tumor-selective translation and cytotoxicity, relies on constitutive ERK1/2-MNK signals that counteract the deleterious effects of runaway AKT-SRPK activity in malignancy.


Figures

FIG 1
FIG 1
Activation of PI3K-AKT has effects on SRPK similar to those of MNK inhibition. (Top) Signaling scheme and inhibitors used. (Bottom) IF of the nuclear-speckle marker and SRPK substrate SF2 in HeLa cells treated with DMSO (A, F, and L), CGP57380 (10 μM) (B, G, and M), CGP57380 plus SRPin340 (10 μM and 3 μM, respectively) (C, H, and N), IGF1 (10 nM) (D, J, and O), and IGF1 plus PI103 (10 nM and 1 μM, respectively) (E, K, and P) for 2 h.
FIG 2
FIG 2
AKT signals negatively affect PVSRIPO translation and cytotoxicity through SRPK. (A) Cells were treated with IGF1 (5 or 10 nM) and PI103 (1 nM) as shown 1 h prior to infection and throughout the assay. Cells were harvested at 3.5 and 4.5 h p.i. and analyzed by immunoblotting. Viral protein 2C was quantitated for 3 experiments and normalized by setting the IGF1 (−) control to 100%. (B) Cells were pretreated with IGF1 (5 nM) or mock pretreated in the presence of DMSO, rapa (250 nM), or SRPin340 (3 μM) 1 h before infection and throughout the assay. Quantitation of viral protein 2C was determined from 3 assays and normalized by setting the IGF1 (−) control for each condition to 100%. The asterisks indicate Student's t test comparing IGF-treated lanes to DMSO-treated controls for each pretreatment (P < 0.05). (C) Cells were treated with siCtrl or siSRPK1/2 (72 h), pretreated with IGF1 (10 nM; 1 h), and then cotransfected with fluc and rluc reporters. IGF1 stimulation was maintained after transfection, and cells were harvested at 4 h for fluc/rluc measurements. The assay was performed in duplicate for 3 tests, and the average fold stimulation values were determined and normalized by setting siCtrl (without IGF1) to 1. (D) Glioma cells were mock treated or treated with IGF1 in the presence of DMSO or SRPin340 (3 μM) and mock infected or infected with virus, and the supernatants were collected at the designated intervals and tested for ATP release. (A, C, and D) The asterisks represent ANOVA-protected t tests (P < 0.05). The error bars indicate SEM.
FIG 3
FIG 3
MNK1 activation leads to depression of AKT phosphorylation. (A) HeLa cells treated with siCtrl (with or without TPA) or siMNK (plus TPA) were lysed and tested by immunoblotting for p-AKT(S473/T308), and the percent phosphorylation was calculated from the average of 3 tests, setting siCtrl (without TPA) to 100%. (B) Constitutively active MNK1(T334D) or kinase-dead MNK1(D191A) expression was Dox induced at the designated time points. p-AKT(S473) was quantitated from 3 independent assays, setting the 0-h (plus-Dox) time point to 100%. (C) HeLa and U87 glioma cells were treated with CGP57380 (10 μM) for the indicated intervals and analyzed by immunoblotting. p-AKT(S473) was quantitated and averaged between 3 experiments. Quantitation between experiments was normalized by setting the 0-min CGP57380 value to 100%. The error bars represent SEM, and the asterisks represent ANOVA-protected t tests (P < 0.05).
FIG 4
FIG 4
MNK1 activation leads to depression of AKT phosphorylation in mouse MEFs. (A) Wt or MNK1/2 dko MEF lysates were compared by immunoblotting for total AKT versus tubulin contents. Quantitation is shown below, representing the AKT/tubulin ratio to correct for loading anomalies; the asterisk represents Student's t test (P < 0.05). (B) Wt or dko MEFs were mock treated or IGF1 treated (60 min) in the presence of DMSO (60 min) or CGP57380 (10 μM; 30 or 60 min, as indicated) and analyzed for p-AKT(S473) and p-AKT(T308) by immunoblotting. (C) (Top) Quantitation of p-AKT(S473) and p-AKT(T308) in wt and dko MEFs after treatment with IGF1 (10 nM; 60 min). The values were normalized by setting samples without IGF1 to 1. (Bottom) Quantitation of p-AKT(S473) from the experiment in panel B. Values were normalized between experiments by setting IGF1 plus DMSO (B, lanes 2 and 6 from left) to 100%. The error bars represent SEM, the asterisks directly over bars represent ANOVA-protected t tests (P < 0.05), and the asterisks over lines represent Student t tests (P < 0.05).
FIG 5
FIG 5
CGP57380 and IGF1 treatments induce AKT(S473) phosphorylation but have the opposite effect on substrates without mTORC1. (A) HeLa cells treated with 10 μM CGP57380 (left) or 10 nM IGF1 (right) were harvested at the designated time points for immunoblotting. (B) Quantitation of p-AKT(S473)/AKT, p-S6K(T389)/S6K, and p-4EBP(S65)/4EBP ratios for CGP57380 (top) and IGF1 (bottom). (C) Lysates from cells expressing Dox-inducible MNK1(T334D) or MNK1(D191A) (Fig. 3B) were tested for phosphorylation of S6K(T389); the averages of 3 independent assays with SEM are represented for p-S6K(T389), corrected by dividing by total S6K values. The asterisks denote ANOVA-protected t tests (P < 0.05) comparing Dox induction to a no-Dox control.
FIG 6
FIG 6
CGP57380- and IGF1-mediated effects on p-AKT(S473) occur through mTORC2. HeLa cells were pretreated with DMSO, rapa (250 nM), or torin2 (25 nM) (2 h). CGP57380 (10 μM) (A) or IGF1 (10 nM) (B) was added 0, 30, 60, or 90 min prior to cell lysis and analysis by immunoblotting. p-AKT(S473) was quantitated for 3 experiments for each time point, and the fold increase was determined by setting the zero time point for each group to 1. The error bars represent SEM, and the asterisks represent ANOVA-protected t tests comparing samples treated with CGP57380 or IGF1 to untreated controls.
FIG 7
FIG 7
mTORC1/2 coinhibition synergizes with PVSRIPO oncolysis and prevents effects of MNK inhibition on PVSRIPO translation. (A) HeLa cells were infected with PVSRIPO and treated with either DMSO or torin2 (5 nM; 1 h p.i.). Cells were harvested (3.5 and 4 h p.i.) and analyzed for viral protein by immunoblotting. Quantitation from 3 assays is shown below; control values were normalized to one experiment for each time point. Viral titers were determined from supernatants of cells. The experiment was repeated twice, and control values were used to normalize between the assays. The error bars represent SEM; the asterisks denote Student's t test (P < 0.05). (B) HeLa cells were pretreated with DMSO, rapa (250 nM), or torin2 (25 nM) 1 h prior to treatment with DMSO or CGP57380 (10 μM) and infection with PVSRIPO. Inhibitors and DMSO were maintained during infection. Cells were harvested 3.5 h p.i. and analyzed by immunoblotting for viral protein and relevant controls. Quantitation is shown below from 3 assays normalized by setting control values (DMSO treated for each inhibitor group) to 100%. The statistics were done by comparing groups to the DMSO-plus-CGP57380-treated lane in an ANOVA-protected t test (P < 0.05). (C) (Top) GBM cells were infected and treated with DMSO (mock) or torin2 (1 or 5 nM) at the time of infection. Lysates were prepared 6 h p.i. and analyzed for viral protein by immunoblotting. Viral 2C protein was quantitated for 3 tests. (Bottom) GBM cells were infected with PVSRIPO and mock or torin2 (1 or 5 nM) treated 4 h p.i. The supernatants were collected 12 h p.i. and analyzed for ATP concentrations in 2 assays. The error bars represent SEM, and the asterisks indicate ANOVA-protected t tests (P < 0.05).
FIG 8
FIG 8
MNK inhibition affects AKT phosphorylation and PVSRIPO translation through mTORC1-mediated inhibition of mTORC2. HeLa cells were treated with siCtrl or one of two siRNAs targeting raptor (A) or rictor (B), followed by treatment with DMSO, CGP57380, or IGF1 (60 min). Cells were harvested and analyzed by immunoblotting for AKT phosphorylation. p-AKT(S473) levels were quantitated as shown for 4 tests each, normalizing between experiments by setting DMSO-treated samples to 1. The asterisks denote ANOVA-protected t tests (P < 0.05), and the error bars represent SEM. (C) HeLa cells were transfected with siCtrl or one of two different siRNAs targeting raptor or rictor as in panels A and B, treated with CGP57380 (30 min), infected with PVSRIPO, and harvested (3.5 h p.i.). The lysates were assessed for viral protein (2C), which is quantitated below for 4 assays, normalizing between experiments by setting the DMSO control for each siRNA to 1 (see Materials and Methods). The asterisks indicate significant ANOVA-protected t tests compared to the siCtrl-plus-CGP57380 values. The error bars represent SEM.
FIG 9
FIG 9
Proposed signal and functional relationships emerging from the present study and the companion report (13). (Step 1) Constitutive Raf-MEK-ERK1/2 signals in GBM cause MNK activation. (Step 2) MNK modulates mTORC1, possibly by intercepting inhibitory PRAS40-raptor binding (36). (Step 3) Our data suggest that MNK-mediated mTORC1 activation represses mTORC2. (Step 4) Inhibition of mTORC2 prevents phosphorylation of AKT(S473) and reduces mTORC2-AKT signaling to SRPK. (Step 5) SRPK-mediated regulation of viral cap-independent translation may occur via SR proteins, e.g., SRp20, a proposed PV ITAF (10). Phosphorylation of SR proteins by SRPK enhances their nuclear import (42) and decreases their affinity for RNA (43). Thus, MNK stimulation of viral m7G cap-independent translation may be due to SRPK inhibition, favoring SR protein cytoplasmic retention and viral RNA binding.

References

    1. Pelletier J, Sonenberg N. 1988. Internal initiation of translation of eukaryotic mRNA directed by a sequence derived from poliovirus RNA. Nature 334:320–325. 10.1038/334320a0. - DOI - PubMed
    1. Jang SK, Krausslich HG, Nicklin MJ, Duke GM, Palmenberg AC, Wimmer E. 1988. A segment of the 5′ nontranslated region of encephalomyocarditis virus RNA directs internal entry of ribosomes during in vitro translation. J. Virol. 62:2636–2643. - PMC - PubMed
    1. Spahn CM, Kieft JS, Grassucci RA, Penczek PA, Zhou K, Doudna JA, Frank J. 2001. Hepatitis C virus IRES RNA-induced changes in the conformation of the 40S ribosomal subunit. Science 291:1959–1962. 10.1126/science.1058409. - DOI - PubMed
    1. Sweeney TR, Abaeva IS, Pestova TV, Hellen CU. 2014. The mechanism of translation initiation on type 1 picornavirus IRESs. EMBO J. 33:76–92. 10.1002/embj.201386124. - DOI - PMC - PubMed
    1. Yu Y, Abaeva IS, Marintchev A, Pestova TV, Hellen CU. 2011. Common conformational changes induced in type 2 picornavirus IRESs by cognate trans-acting factors. Nucleic Acids Res. 39:4851–4865. 10.1093/nar/gkr045. - DOI - PMC - PubMed

Publication types

MeSH terms

Substances

LinkOut - more resources