. 2014 Nov;88(22):13086-98.
doi: 10.1128/JVI.02156-14. Epub 2014 Sep 3.

Chemical induction of unfolded protein response enhances cancer cell killing through lytic virus infection

Affiliations

Chemical induction of unfolded protein response enhances cancer cell killing through lytic virus infection

Vibhu Prasad et al. J Virol. 2014 Nov.

Abstract

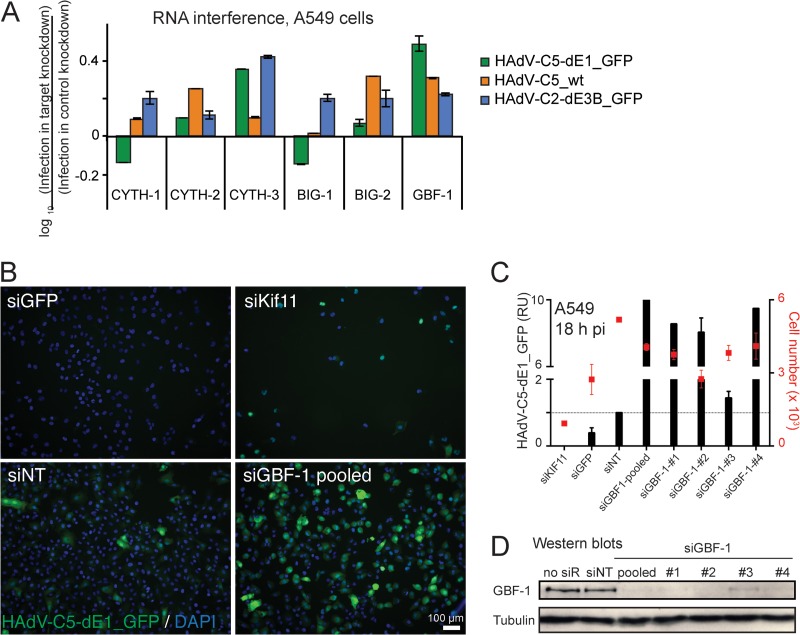
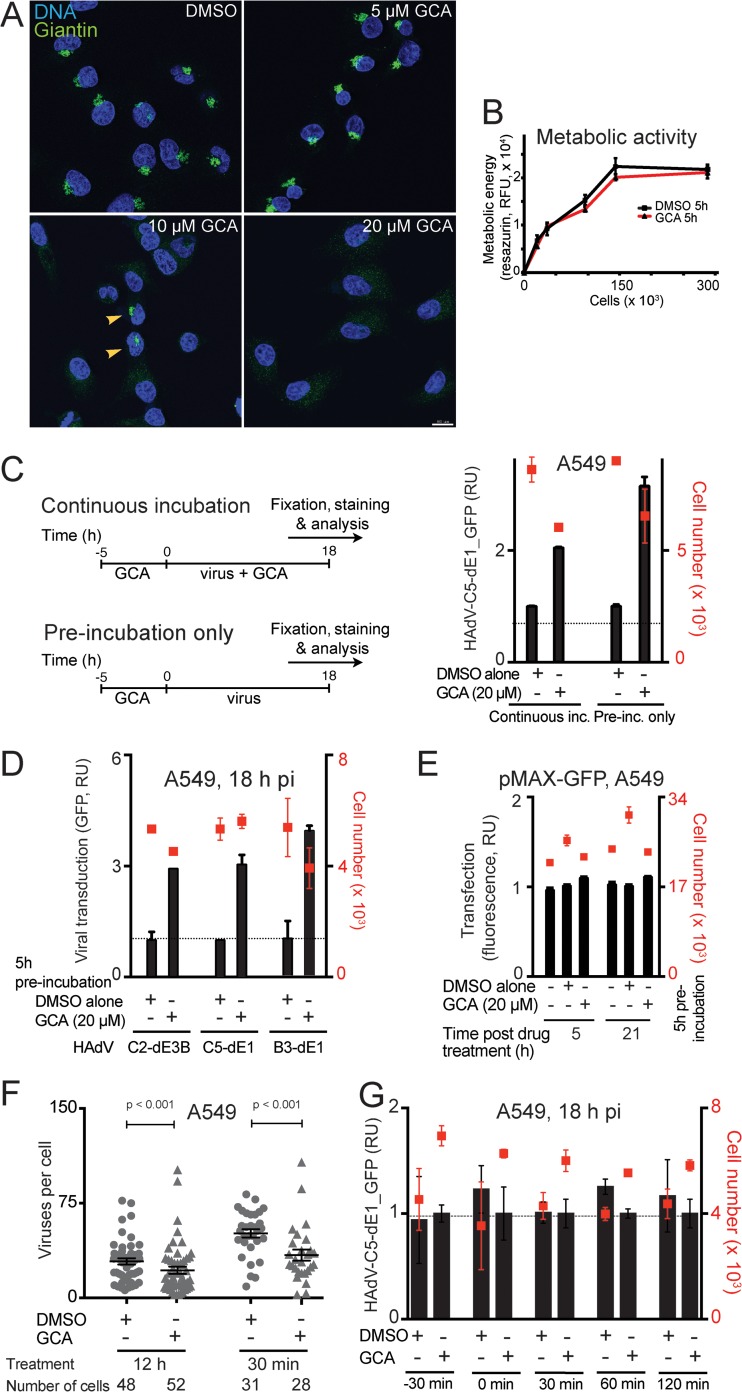
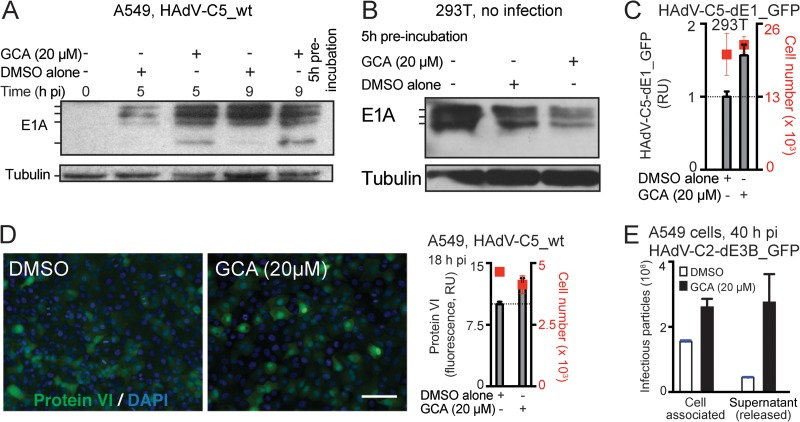
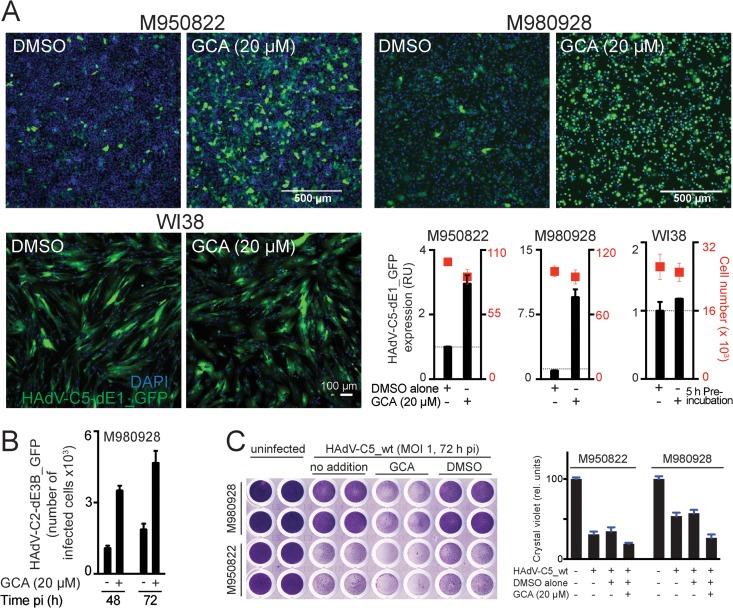
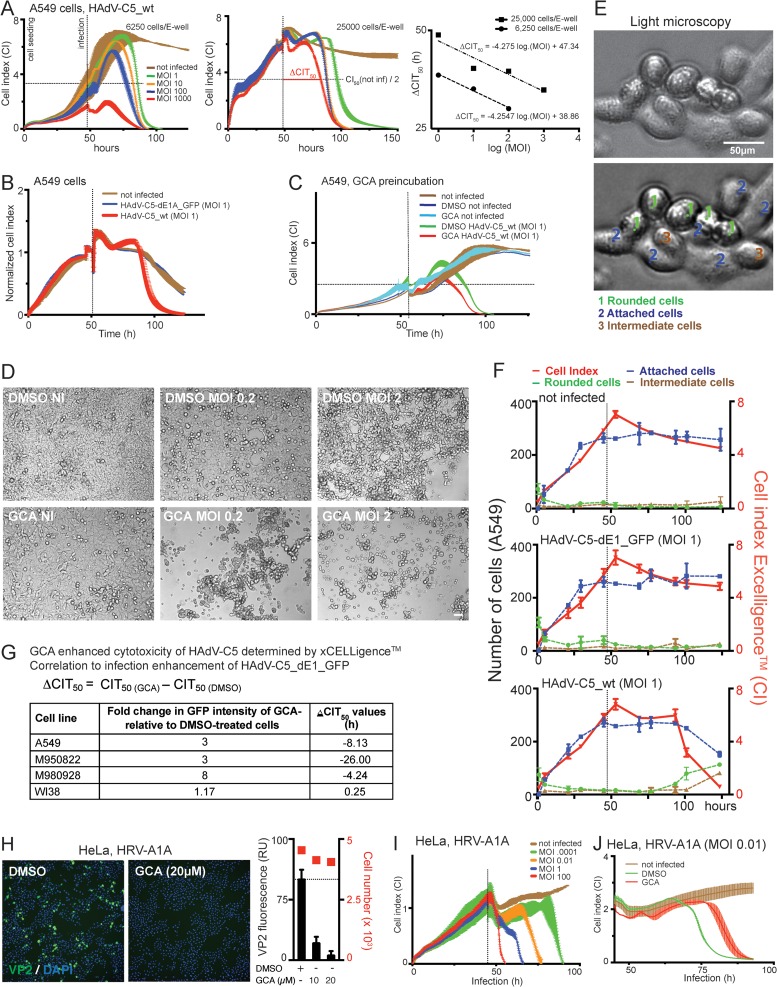
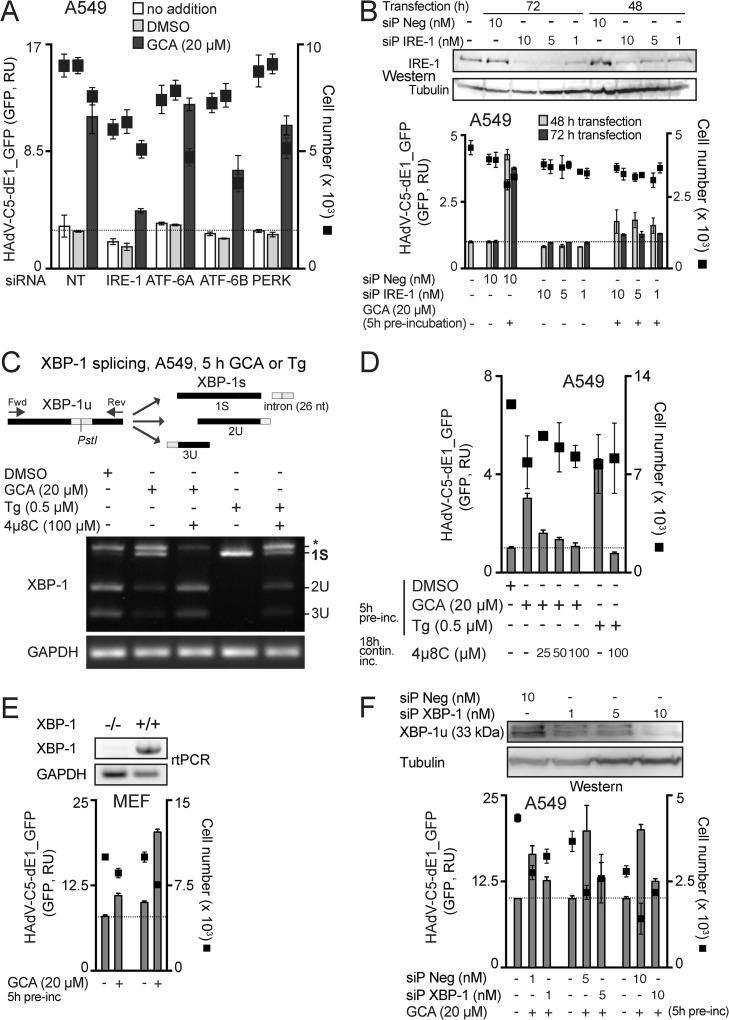
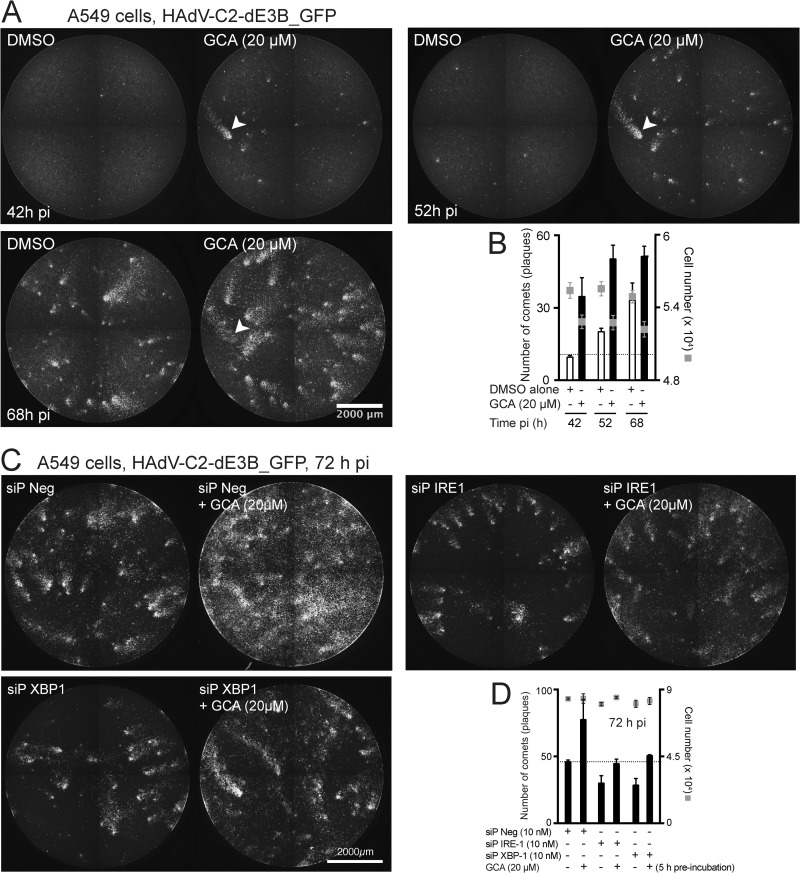
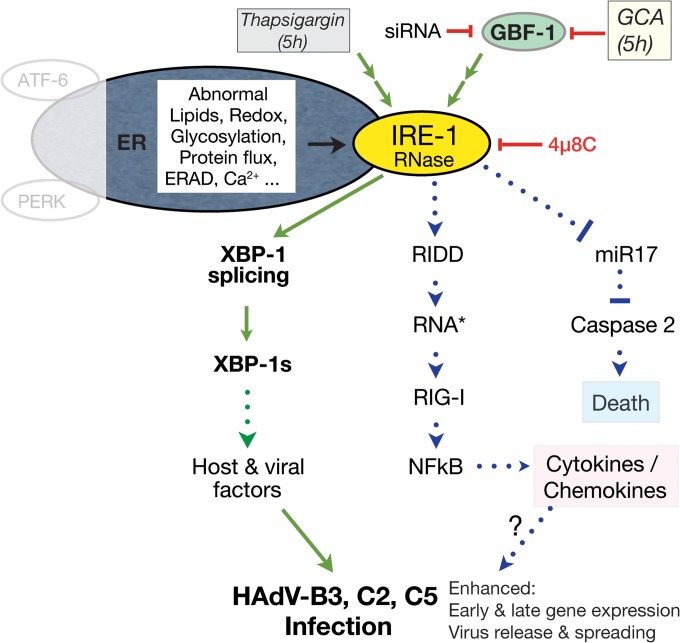
Cancer cells are susceptible to oncolytic viruses, albeit variably. Human adenoviruses (HAdVs) are widely used oncolytic agents that have been engineered to produce progeny within the tumor and elicit bystander effects. We searched for host factors enhancing bystander effects and conducted a targeted RNA interference screen against guanine nucleotide exchange factors (GEFs) of small GTPases. We show that the unfolded protein response (UPR), which is readily inducible in aggressive tumor cells, enhances melanoma or epithelial cancer cell killing upon HAdV infection. UPR was triggered by knockdown of Golgi-specific brefeldin A-resistant guanine nucleotide exchange factor 1 (GBF-1) or the GBF-1 inhibitor golgicide A (GCA) and stimulated HAdV infection. GBF-1 is a GEF for ADP ribosylation factors (Arfs) regulating endoplasmic reticulum (ER)-to-Golgi apparatus and intra-Golgi apparatus membrane transport. Cells treated with GCA enhanced HAdV-induced cytopathic effects in epithelial and melanoma cancer cells but not normal cells, if the drug was applied several hours prior to HAdV inoculation. This was shown by real-time label-free impedance measurements using the xCELLigence system. GCA-treated cells contained fewer incoming HAdVs than control cells, but GCA treatment boosted HAdV titers and spreading in cancer cells. GCA enhanced viral gene expression or transgene expression from the cytomegalovirus promoter of B- or C-species HAdVs but did not enhance viral early region 1A (E1A) expression in uninfected cell lines or cells transfected with plasmid reporter DNA. The UPR-enhanced cell killing required the nuclease activity of the UPR sensor inositol-requiring enzyme 1 (IRE-1) and X box binding protein 1 (XBP-1), which alleviate ER stress. The collective results show that chemical UPR induction and viruses boost tumor cell killing by enhancing oncolytic viral efficacy.

Importance: Cancer is difficult to combat. A wide range of oncolytic viruses show promise for killing cancer cells, yet the efficacy of oncolytic killing is low. We searched for host factors enhancing adenovirus cancer cell killing and found that the knockdown of Golgi-specific brefeldin A-resistant guanine nucleotide exchange factor 1 (GBF-1) or chemical inhibition of GBF-1 enhanced adenovirus infection by triggering the IRE-1/XBP-1 branch of the unfolded protein response (UPR). IRE-1/XBP-1 promote cell survival and enhanced the levels of the adenoviral immediate early gene product E1A, virus spreading, and killing of cancer cells. Aggressive tumor cells depend on a readily inducible UPR and, hence, present prime targets for a combined strategy involving adenoviruses and small chemicals inducing UPR.


Figures

FIG 1
FIG 1
Knockdown of GBF-1 enhances HAdV infections. (A) RNA interference miniscreen against Arf GEFs identifies GBF-1 knockdown as an enhancer of HAdV-C5-dE1_GFP, HAdV-C5_wt, and HAdV-C2-dE3B_GFP infections. Cells were reverse transfected with pooled siRNAs (1 pmol/well) against cytohesin 1 (CYTH-1), CYTH-2, CYTH-3, brefeldin A-inhibited guanine nucleotide exchange protein 1 (BIG-1), BIG-2, or GBF-1 for 48 h, infected as indicated, fixed at 18 h p.i., and analyzed for infection. Results are expressed as the log10 ratio of the mean nuclear intensity of GFP in infected cells normalized to that in control cells transfected with nontargeting siRNA. (B to D) Knockdown of GBF-1 siRNA (siGBF-1) enhances HAdV-C5-dE1_GFP infection in A549 cells. Single or pooled GBF-1 siRNAs, along with control nontargeting siRNA (siNT), kinesin family member protein 11 siRNA (siKif11), and GFP siRNA (siGFP), were reverse transfected into A549 cells, and cells were infected at 48 h posttransfection. At 18 h postinfection, the cells were fixed, stained with DAPI, and analyzed for infection. (B) Representative images. (C) Quantification of the GFP signal in cells transfected with the indicated siRNAs. RU, relative units, representing the mean nuclear GFP signal from three parallel samples ± SDs. The cell toxicity of the siRNAs was measured by use of the cell number shown on the secondary x axis. (D) Western blots. no siR, no siRNA.
FIG 2
FIG 2
Prolonged inhibition of GBF-1 enhances HAdV infection in A549 cells but not virus binding to cells. (A) Dispersal of the Golgi apparatus upon treatment of A549 cells with the GBF-1 inhibitor GCA for 30 min. Cells were fixed and immunostained with antibodies directed against the Golgi apparatus-associated protein giantin (green), and nuclei (blue) were stained with DAPI. Samples were imaged by confocal fluorescence microscopy. Images show maximum projections of confocal sections. Note that control DMSO-treated cells showed normal perinuclear Golgi apparatus staining. Five micromolar GCA had no effect, 10 μM caused incomplete disruption of the Golgi apparatus, and 20 μM induced efficient disruption of the Golgi apparatus in all cells. Bar, 20 μm. (B) Minor effect of GCA on metabolic activity of A549 cells. Cells were treated with GCA or control DMSO for 5 h, and the metabolic activity in cells was measured by resazurin fluorescence assay (RFU, relative fluorescence units). (C) A 5-h preincubation with GCA is sufficient to enhance HAdV-C5-dE1_GFP infection of A549 cells. Cells were preincubated with GCA or DMSO for 5 h and inoculated with HAdV-C5-dE1_GFP, and infection was carried out in the presence or absence of GCA. Cells were fixed at 18 h p.i., and the mean nuclear intensity of GFP was used to score infection efficiency. (Left) Graphical representation of the experiment; (right) experimental results with mean values from three parallel experiments ± SD. inc., incubation. (D) A 5-h preincubation with GCA enhances HAdV-C5-dE1_GFP, HAdV-C2_dE3B_GFP, and HAdV-B3-dE1_GFP infection in A549 cells. (E) GCA has no effect on a plasmid-mediated CMV promoter-driven GFP expression. A549 cells were transfected with plasmid pMAX-GFP, at 24 h posttransfection were treated with GCA for 5 h, and were analyzed for GFP expression at 5 or 21 h after drug removal. (F) Decrease in atto565-labeled HAdV-C5 attachment to A549 cells upon GCA treatment. Cells were treated with GCA for 12 or 0.5 h, followed by inoculation with atto565-labeled HAdV-C5_wt in the cold for 30 min, washing, and a 5-min pulse at 37°C. The number of virus particles in individual cells was determined from maximum-intensity projections of confocal stacks using a custom-made Matlab script. Each symbol represents one cell. Error bars represent the means ± SEMs, and P values were calculated using the Mann-Whitney test for statistics. (G) Acute inhibition of GBF-1 upon virus addition does not enhance HAdV-C5-dE1_GFP infection in A549 cells. GCA or DMSO was added to the cells at 30 min prior to virus infection or at the indicated times postinfection, and incubation was continued until 18 h p.i., when the cells were analyzed.
FIG 3
FIG 3
Inhibition of GBF-1 by GCA enhances HAdV-C early and late gene expression, as well as virus production in A549 cells. (A) A 5-h preincubation with GCA accelerates E1A expression from HAdV-C5_wt in A549 cells, as indicated by Western blotting of infected cell lysates. (Top) E1A forms encoded by the differentially spliced E1A transcripts are indicated. (Bottom) Results for the β-tubulin loading control. (B) GCA does not increase E1A levels in uninfected HEK293T cells, which express E1A from a chromosomal copy. Cell extracts were prepared after 5 h of incubation with DMSO or GCA, and E1A levels were determined by immunoblotting using β-tubulin as a loading control. (C) GCA boosts HAdV-C5-dE1_GFP infection in HEK293T cells. Cells were preincubated with GCA for 5 h, inoculated with virus, and analyzed for GFP expression 18 h p.i. (D) GBF-1 inhibition enhances expression of the late protein protein VI in A549 cells. Cells were preincubated with GCA for 5 h, infected with HAdV-C5_wt, and analyzed for protein VI expression at 18 h p.i. (Left) Representative images. Green, protein VI signal; blue, DAPI signal. Bar, 100 μm. (Right) Quantification of average nuclear protein VI signal. (E) Inhibition of GBF-1 accelerates the production and release of HAdV-C2-dE3B_GFP in A549 cells 40 h p.i. Cells were preincubated with DMSO or GCA for 5 h and inoculated with the virus (MOI, 0.008), and at 40 h p.i., progeny particles were collected from the cells and culture supernatants. Titers of the cell-associated and supernatant fractions were determined on HeLa-ATCC cells by counting the number of GFP-positive cells at 18 h p.i.
FIG 4
FIG 4
GBF-1 inhibition enhances adenovirus infection of melanoma cells. (A) Inhibition of GBF-1 by GCA enhances HAdV-C5-dE1_GFP infection of M950822 and M980928 melanoma cells but not normal human WI38 fibroblasts. Cells were preincubated with DMSO or GCA for 5 h, inoculated with the virus, and analyzed at 18 h p.i. Shown are representative images and quantification of the mean nuclear GFP signal. (B) Inhibition of GBF-1 enhances HAdV-C2-dE3B_GFP spreading in melanoma-derived M980928 cells. The cells were preincubated with DMSO or GCA for 5 h and inoculated with the virus (MOI, ∼0.00016). The data are from a live experiment in which recordings were made every 4 h to 5 h. Shown is the number of GFP-positive cells at 48 h and 72 h p.i. (C) Inhibition of GBF-1 enhances HAdV-C5_wt-induced killing of M950822 and M980928 cells. The cells were preincubated with DMSO or GCA for 5 h, inoculated with HAdV-C5_wt (MOI, 1), and stained with crystal violet at 72 h p.i. (left). (Right) Quantification of crystal violet staining, which is proportional to cell numbers. rel. units, relative units.
FIG 5
FIG 5
Inhibition of GBF-1 enhances HAdV-induced cytopathic effects but blocks rhinovirus infection. (A) CI profiles from impedance measurements of A549 cells infected with HAdV-C5_wt indicate cytopathic effects. Impedance was recorded every 15 min using an xCELLigence system. Each point represents the average value from two replicates with SDs. The times on the x axis indicate the times after cell seeding. Vertical lines show the time of infection, and horizontal lines refer to 50% of the maximum CI of noninfected cells. (Right) Regression fit of ΔCIT50 values, where each point represents a single ΔCIT50 value. Note that the CI profile of HAdV-C5_wt infection is MOI dependent but not cell density dependent. (B) A549 cells infected with HAdV-C5_wt (red) or replication-deficient HAdV-C5-dE1_GFP (blue) yield significantly different CI profiles. The profile of HAdV-C5-dE1_GFP-infected cells is similar to that of noninfected control cells (brown). (C) A 5-h preincubation with GCA enhanced HAdV-C5_wt-induced cytotoxicity in A549 cells. Data points represent the means from two samples per condition ± SDs. (D) DIC images of control and GCA-treated (5 h preincubation) uninfected and HAdV-C5_wt-infected A549 cells at 72 h p.i. Bar, 50 μm. (E, F) Comparison of CI values with cell appearance in DIC images. (E) Representative DIC images of A549 cells classified as rounded (1, green), attached (2, blue), or in an intermediate state (3, brown). The upper image is unprocessed, whereas the lower image shows an example of images that were filtered through a band-pass filter and contrast enhanced using ImageJ software. The latter images were used for cell classification. (F) Comparison of the CI profiles of uninfected, HAdV-C5-dE1_GFP-infected (MOI, 1), and HAdV-C5_wt-infected (MOI, 1) A549 cells with the number of rounded, attached, and intermediate cells in DIC images of corresponding parallel samples. (G) Summary of GCA-mediated infection enhancement for HAdV-C5-dE1_GFP and ΔCIT50 values (h) for HAdV-C5_wt. Negative values in the ΔCIT50 column indicate that the CI of GCA-treated cells reached 50% of the maximum CI of noninfected cells earlier than control DMSO-treated cells. (H) GCA inhibits HRV-A1A infection of HeLa-Ohio cells, as indicated by anti-VP2 immunostaining. Cells were infected with HRV-A1A (MOI, 0.01) in the presence of 20 μM GCA and analyzed for VP2 expression at 7 h p.i. (Left) Representative images (green, VP2; blue, DAPI); (right) quantification of the cytoplasmic VP2 signal. (I) CI profile of HeLa-Ohio cells infected with HRV-A1A at different MOIs. Values are the averages, including SDs, from two replicates. (J) The GBF-1 inhibitor GCA reduced the HRV-A1A-induced cytopathic effect in HeLa-Ohio cells. Cells were infected with HRV-A1A (MOI, 0.01) in the presence of 20 μM GCA. Data represent the means ± SDs for 2 samples per condition.
FIG 6
FIG 6
GCA enhances adenovirus infection through IRE-1 and XBP-1. (A) Effect of knockdown of ER stress sensors on GCA-mediated infection boost. A549 cells were reverse transfected with control nontargeting siRNAs (NT) or pooled siRNAs against ER stress sensors ATF-6A, ATF-6B, PERK, and IRE-1alpha. At 43 h posttransfection, cells were preincubated with DMSO or GCA for 5 h (no addition indicates no pretreatment) and inoculated with HAdV-C5-dE1_GFP, and the average nuclear GFP signal was analyzed at 18 h p.i. (B) IRE-1 knockdown by siP RNAs reduces the HAdV-C5-dE1_GFP infection boost in GCA-treated A549 cells. siP Neg, nontargeting negative-control siP RNAs. Intracellular IRE-1 levels were determined by Western blotting using β-tubulin as a loading control. (C) GBF-1 inhibition by GCA induces ER stress and activates IRE-1 nuclease and splicing of XBP-1 mRNA. A549 cells were treated with GCA or the ER stress activator thapsigargin (Tg) for 5 h, and IRE-1 activation was analyzed by PstI digestion of XBP1 cDNA amplicons. The spliced XBP-1 cDNA amplicon lacks a PstI site (1S), whereas the unspliced one retains the site and is cleaved into two fragments (2U and 3U) upon PstI digestion. The uppermost band (*) is a spliced/unspliced XBP-1 hybrid amplicon (69). XBP-1 splicing was inhibited by the IRE-1 nuclease inhibitor 4μ8C in GCA- and thapsigargin-treated cells. GAPDH (glyceraldehyde-3-phosphate dehydrogenase) cDNA amplicons were used as a loading control. Fwd, forward; Rev, reverse; nt, nucleotides. (D) GCA-induced HAdV-C5-dE1_GFP infection boost in A549 cells requires IRE-1 endonuclease activation. Cells were preincubated with GCA or thapsigargin for 5 h with or without 4μ8C, inoculated with HAdV-C5-dE1_GFP, and analyzed for GFP expression at 18 h p.i. contin. inc., continuous incubation. (E) Reduced GCA infection boost in XBP-1−/− mouse embryo fibroblasts. XBP-1+/+ or XBP-1−/− MEFs were preincubated with GCA, inoculated with HAdV-C5-dE1_GFP, and analyzed for GFP expression at 18 h p.i. (F) XBP-1 knockdown by siP RNAs reduces the HAdV-C5-dE1_GFP infection boost in GCA-treated A549 cells. Cells were reverse transfected with siP RNAs against XBP-1 or nontargeting negative-control siP RNA (siP Neg), at 72 h posttransfection preincubated with GCA or DMSO for 5 h, inoculated with HAdV-C5-dE1_GFP, and analyzed for GFP expression at 18 h p.i. Levels of knockdown of the unspliced XBP-1 protein (XBP-1u) were controlled by Western blotting using β-tubulin as a loading control.
FIG 7
FIG 7
Inhibition of GBF-1 by GCA enhances spreading of virus infection via IRE-1 and XBP-1. (A, B) Confluent A549 cells were preincubated with GCA for 5 h and infected with replication-competent HAdV-C2-dE3B_GFP (MOI, 0.00016), and spreading of infection was analyzed by time-lapse fluorescence microscopy. (A) Spreading of infection is manifested by the typical comet phenotypes of infected GFP-positive cells. Arrowhead, one of the many comets which increase in size as infection proceeds. (B) Quantification of the number of comets. The data are from two parallel experiments. (C, D) A549 cells were reverse transfected with the negative-control siP RNA (siP Neg) or siP RNA against IRE-1 or XBP-1. At 72 h posttransfection, cells were preincubated with GCA or DMSO for 5 h and inoculated with HAdV-C2-dE3B_GFP (MOI, 0.008) and spreading of infection was analyzed by time-lapse fluorescence microscopy. (C) Images from the recordings obtained at 72 h p.i. (D) Quantification of the comets at 72 h p.i. The data in panel D were from two parallel experiments.
FIG 8
FIG 8
Model for the UPR-induced HAdV infection boost by GCA. ER stress can be induced by abnormal ER-associated lipids, redox potential, glycosylation, or protein flux through the secretory pathway or by the depletion of calcium ions, for example, by the Ca2+ ATPase inhibitor thapsigargin (70). Cells sense ER stress by three major pathways, the activating transcription factor 6 (ATF-6), the PKR-like ER kinase (PERK), and the inositol-requiring enzyme 1 (IRE-1) pathways. Here we show that the small compound golgicide A (GCA), which blocks the guanine nucleotide exchange factor GBF-1 of Arf GTPases, implicated in ER-Golgi apparatus membrane transport, induces the IRE-1/X-box binding protein 1 (XBP-1) branch of the UPR (green arrows). GCA and, in some cases, the knockdown of GBF-1 by siRNA enhance infection of cancer cells with both replicating and nonreplicating HAdV of the C and B species. This requires the RNase activity of IRE-1 and leads to the splicing of the XBP-1 mRNA in the cytoplasm, yielding an mRNA which encodes the active XBP-1 transcription factor (also dubbed XBP-1s). XBP-1 splicing can be blocked by the IRE-1 RNase inhibitor 4μ8C (57). XBP-1s may enhance the transcription of both host and viral genes and thereby boost early and late viral gene expression, virus release from infected cells, and viral spreading. Besides the XBP-1 branch, IRE-1 also signals through regulated IRE-1-dependent decay (RIDD), generating double-stranded RNA (RNA*) and leading to the activation of retinoic acid-inducible gene 1 (RIG-I), the nuclear factor kappa light chain enhancer of activated B cells (NF-κB), and downstream cytokines and chemokines, which may boost HAdV infection (31, 71–73). A third output from IRE-1 signaling is the degradation of microRNA 17 (miR17), an inhibitor of the apoptotic caspase 2 (74). If this pathway is triggered by GCA, it may enhance HAdV-induced cell killing. Green arrows, the GCA pathway activating the IRE-1/XBP-1 branch of the UPR and leading to HAdV infection boost, as shown in this work; green dotted arrow, possible activations downstream of GCA-induced UPR; blue dotted arrows, pathways relating to work previously published depicting two signaling branches downstream of IRE-1 that could contribute to the enhancement of HAdV infection or cancer cell killing.

References

    1. Chen DS, Mellman I. 2013. Oncology meets immunology: the cancer-immunity cycle. Immunity 39:1–10. 10.1016/j.immuni.2013.07.012. - DOI - PubMed
    1. Hanahan D, Weinberg RA. 2011. Hallmarks of cancer: the next generation. Cell 144:646–674. 10.1016/j.cell.2011.02.013. - DOI - PubMed
    1. Bell J, McFadden G. 2014. Viruses for tumor therapy. Cell Host Microbe 15:260–265. 10.1016/j.chom.2014.01.002. - DOI - PMC - PubMed
    1. Russell SJ, Peng KW, Bell JC. 2012. Oncolytic virotherapy. Nat. Biotechnol. 30:658–670. 10.1038/nbt.2287. - DOI - PMC - PubMed
    1. Ginn SL, Alexander IE, Edelstein ML, Abedi MR, Wixon J. 2013. Gene therapy clinical trials worldwide to 2012—an update. J. Gene Med. 15:65–77. 10.1002/jgm.2698. - DOI - PubMed

Publication types