. 2014 Sep 4;10(9):e1004593.
doi: 10.1371/journal.pgen.1004593. eCollection 2014 Sep.

The olfactory transcriptomes of mice

Affiliations

The olfactory transcriptomes of mice

Ximena Ibarra-Soria et al. PLoS Genet. .

Abstract

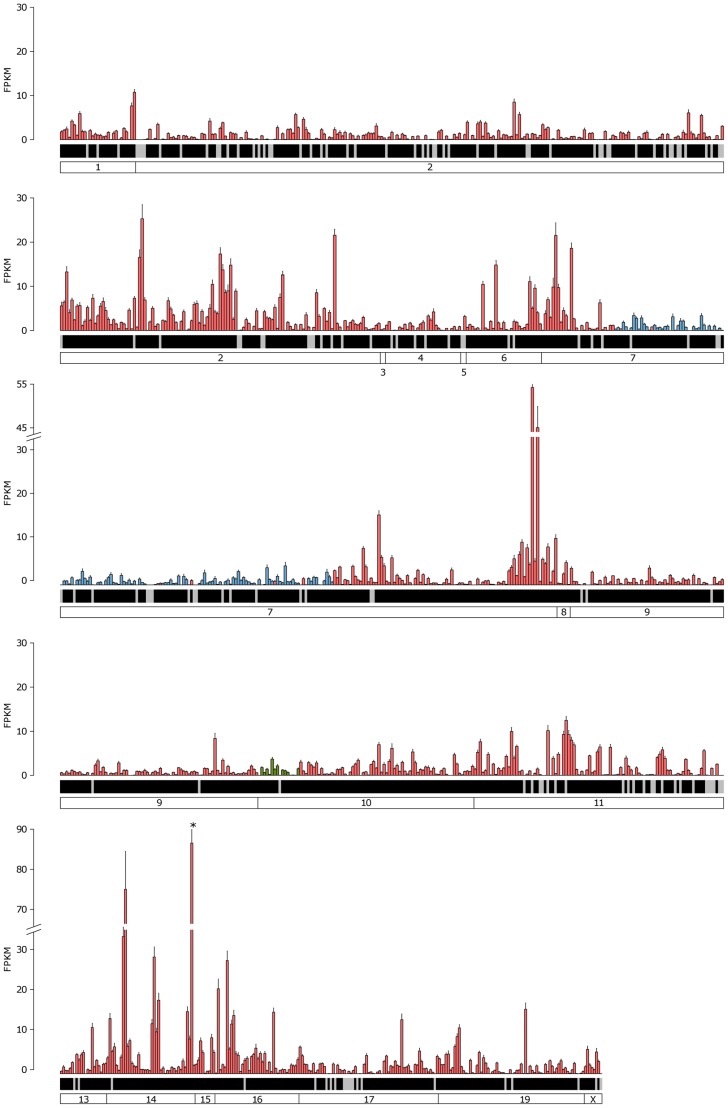
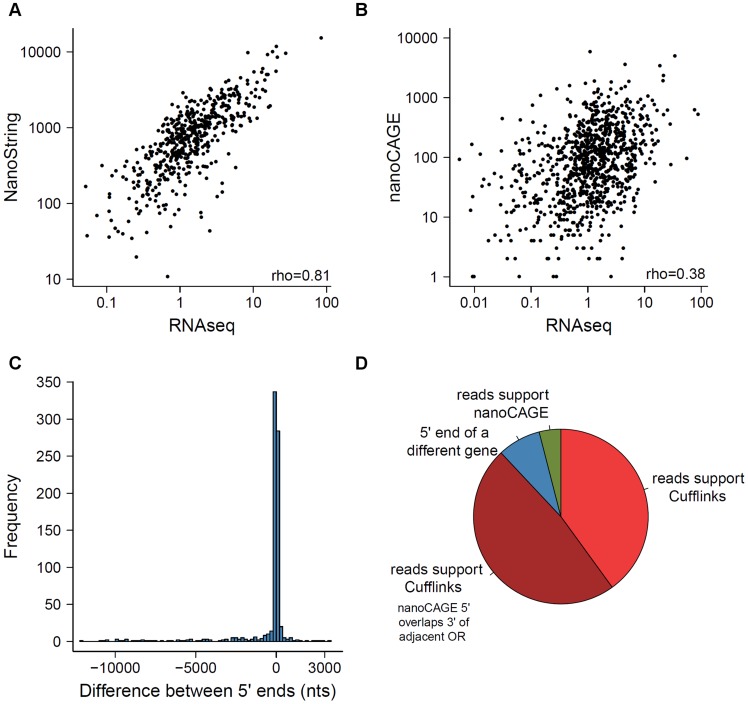
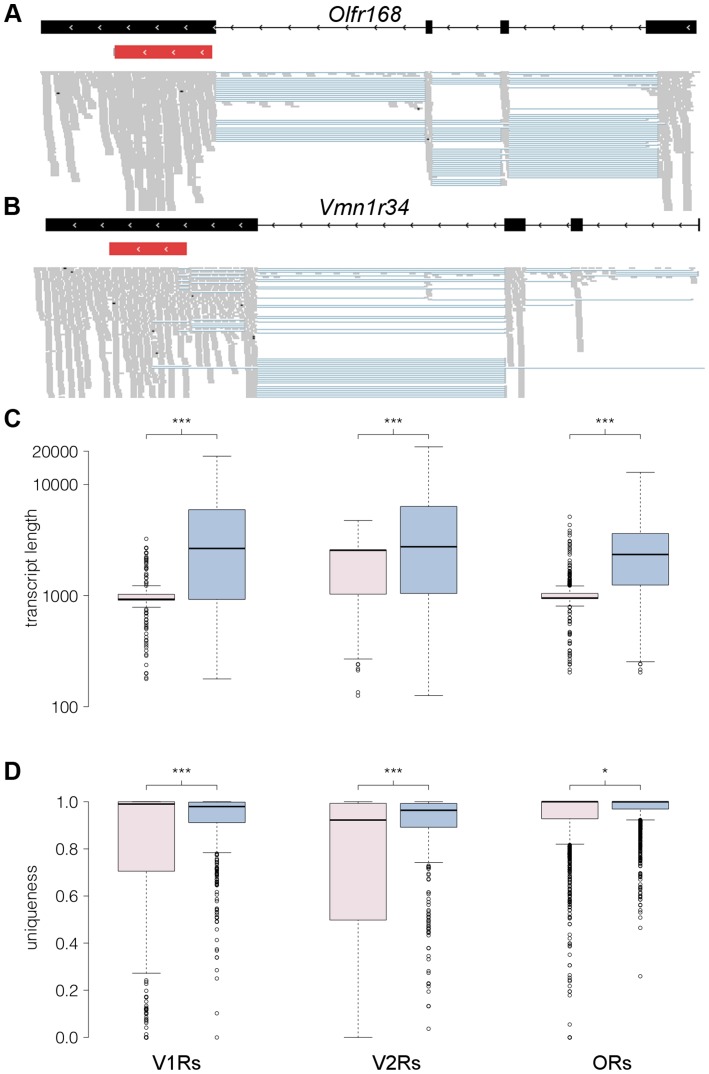
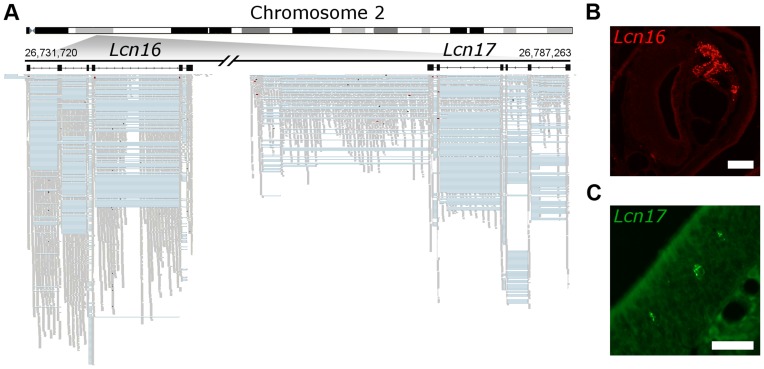
The olfactory (OR) and vomeronasal receptor (VR) repertoires are collectively encoded by 1700 genes and pseudogenes in the mouse genome. Most OR and VR genes were identified by comparative genomic techniques and therefore, in many of those cases, only their protein coding sequences are defined. Some also lack experimental support, due in part to the similarity between them and their monogenic, cell-specific expression in olfactory tissues. Here we use deep RNA sequencing, expression microarray and quantitative RT-PCR in both the vomeronasal organ and whole olfactory mucosa to quantify their full transcriptomes in multiple male and female mice. We find evidence of expression for all VR, and almost all OR genes that are annotated as functional in the reference genome, and use the data to generate over 1100 new, multi-exonic, significantly extended receptor gene annotations. We find that OR and VR genes are neither equally nor randomly expressed, but have reproducible distributions of abundance in both tissues. The olfactory transcriptomes are only minimally different between males and females, suggesting altered gene expression at the periphery is unlikely to underpin the striking sexual dimorphism in olfactory-mediated behavior. Finally, we present evidence that hundreds of novel, putatively protein-coding genes are expressed in these highly specialized olfactory tissues, and carry out a proof-of-principle validation. Taken together, these data provide a comprehensive, quantitative catalog of the genes that mediate olfactory perception and pheromone-evoked behavior at the periphery.


Conflict of interest statement

The authors have declared that no competing interests exist.

Figures

Figure 1
Figure 1. The transcriptomes of the VNO and OM.
(A–B) Representative scatter plots of the log10 FPKM values for all genes in two biological replicates for the VNO (A) and OM (B). Spearman correlations were computed and the rho values are indicated (see Figure S1 for all pairwise comparisons). (C) The VNO and OM transcriptomes show a bimodal distribution. Density curves were computed for the mean log10 FPKM expression values of males (dotted blue) and females (red); 0.0001 FPKM was added to avoid computing log10(0). The VNO is shown in the x-axis and the OM in the y-axis. The shaded region indicates genes that have a 0.25 or higher probability of being in the highly-expressed distribution. The scatter plot in the center depicts the expression levels of all genes in the VNO versus the OM. House-keeping genes (orange) tend to be expressed at high and similar levels in both tissues; OR (green) and VR genes (purple) are specifically expressed in their cognate tissue.
Figure 2
Figure 2. Comparison of RNAseq data to microarrays and qRT-PCR.
(A–B) The log10 FPKM expression values obtained from RNAseq are plotted against the normalized expression estimates from an Illumina microarray chip for the VNO (A) and OM (B), 1 was added to avoid computing log10(0). (C–F) For a subset of genes (Table S1), the log10 normalized intensity values obtained from the microarrays (C–D) and from RNAseq in FPKM (E–F) are plotted against the log10 RQ values from TaqMan qRT-PCR assays. The Pearson correlation values are indicated and a linear least squares regression is fitted (red).
Figure 3
Figure 3. Limited sexual dimorphism in the olfactory system.
The mean gene expression is plotted against their log2 fold change between male and female samples for the VNO (A) and OM (B). Genes with ±infinite fold changes were assigned to ±13 to ease visualization. Triangles depict genes located on the sex chromosomes. Genes significantly differentially expressed in one tissue (FDR 5%) are red while the 11 genes that are significantly differentially expressed in both tissues are blue. The genes in the VNO plotted in green are eight lipocalins that are highly variable between replicates. Dotted lines indicate a log2 fold change of ±2.
Figure 4
Figure 4. Expression of the complete VR repertoire in the VNO.
The mean FPKM expression values are shown for all the VR and formyl peptide receptor (FPR) genes in the VNO. Genes are ordered by their chromosomal location and chromosomes are annotated in the boxes at the bottom. V1R genes are blue, V2R genes are red and FPR genes are green. Black shading below each bar indicates the gene is annotated as a functional receptor, and grey indicates an annotated pseudogene. Error bars represent the standard error of the mean from the six biological replicates. Vmn2r89 is the highest VR gene expressed and is indicated with an asterisk.
Figure 5
Figure 5. Expression of the complete OR repertoire in the OM.
The mean FPKM expression values for all OR and trace amine-associated receptors (TAAR) genes in the OM. Genes are ordered by their chromosomal location and chromosomes are annotated in the boxes at the bottom. Class I OR genes are blue, class II OR genes are red and TAAR genes are green. Black shading below each bar indicates the gene is annotated as a functional receptor, and grey indicates an annotated pseudogene. Error bars represent the standard error of the mean from the six biological replicates. Olfr1507 is the highest expressed OR gene and is indicated with an asterisk.
Figure 6
Figure 6. Comparison of methods measuring OR gene expression.
A comparison of the expression levels obtained from the RNAseq data to those previously reported using (A) NanoString nCounter and (B) nanoCAGE , . The Spearman correlation values are indicated. (C) Comparison of the 5′ of OR transcripts obtained with Cufflinks here, with data estimated by nanoCAGE . The difference in nucleotides between the two ends was calculated; a negative value indicates the 5′ end reported by nanoCAGE is upstream of the one reported by Cufflinks. (D) The receptor genes with most dissimilar 5′ end coordinates can be explained by one of four scenarios; the proportions of each are shown in the pie chart, for the 25 genes with the biggest differences.
Figure 7
Figure 7. RNAseq provides comprehensive gene models for ORs and VRs.
(A–B) An example of new gene models generated for Olfr168 (A) and Vmn1r34 (B) are shown in black. Boxes correspond to exons and arrowheads indicate the direction of the gene. The existing Ensembl annotations for the genes are shown in red with their UTRs in grey. New 5′ exons and extended 3′UTRs were identified for both. The mapped RNAseq reads that support the models are below. Each read is drawn in grey and blue lines join read fragments that span exon junctions. Black segments within the reads indicate indels. (C) Boxplots of the transcript length as annotated in Ensembl (pink) or as obtained from the reconstructed models from our RNAseq data (blue) for the V1R, V2R and OR genes. The increase in transcript length is highly significant (*** P<0.0001, two-tailed Mann-Whitney test). (D) As above, but quantifying the proportion of unique sequence for probe design (*** P<0.0001 and *P<0.01, two-tailed Mann-Whitney test). The uniqueness corresponds to the proportion of all 100 nucleotide long windows within the transcript that map uniquely to the genome. In all boxplots, outliers are defined as data points that fall outside 1.5 of the inter-quartile range, and are plotted as open circles.
Figure 8
Figure 8. Novel genes are expressed in olfactory organs.
(A) Chromosome 2 is schematized on the top and the locus where two previously unidentified genes were found is amplified below. In black are Lcn16 and Lcn17 gene models, where boxes correspond to the exons. The mapped RNAseq reads are below: each read is drawn in grey and blue lines join read fragments that span exon junctions. Black segments within the reads indicate indels. (B) In situ hybridization reveals Lcn16 is expressed in glandular tissue of the VNO and (C) Lcn17 is expressed in cells within the main olfactory epithelium. Scale bars: (B) 100 µm, (C) 50 µm.

References

    1. Dulac C, Torello AT (2003) Molecular detection of pheromone signals in mammals: from genes to behaviour. Nat Rev Neurosci 4: 551–562. - PubMed
    1. Chamero P, Marton TF, Logan DW, Flanagan K, Cruz JR, et al. (2007) Identification of protein pheromones that promote aggressive behaviour. Nature 450: 899–902. - PubMed
    1. Roberts SA, Simpson DM, Armstrong SD, Davidson AJ, Robertson DH, et al. (2010) Darcin: a male pheromone that stimulates female memory and sexual attraction to an individual male's odour. BMC Biol 8: 75. - PMC - PubMed
    1. Haga S, Hattori T, Sato T, Sato K, Matsuda S, et al. (2010) The male mouse pheromone ESP1 enhances female sexual receptive behaviour through a specific vomeronasal receptor. Nature 466: 118–122. - PubMed
    1. Papes F, Logan DW, Stowers L (2010) The vomeronasal organ mediates interspecies defensive behaviors through detection of protein pheromone homologs. Cell 141: 692–703. - PMC - PubMed

Publication types

Substances

LinkOut - more resources