Comparative Study
. 2014 Nov;121(5):978-89.
doi: 10.1097/ALN.0000000000000419.

A comparison of propofol- and dexmedetomidine-induced electroencephalogram dynamics using spectral and coherence analysis

Affiliations
Comparative Study

A comparison of propofol- and dexmedetomidine-induced electroencephalogram dynamics using spectral and coherence analysis

Oluwaseun Akeju et al. Anesthesiology. 2014 Nov.

Erratum in

  • Anesthesiology. 2015 Apr;122(4):958. Lei, Gao [corrected to Gao, Lei]

Abstract

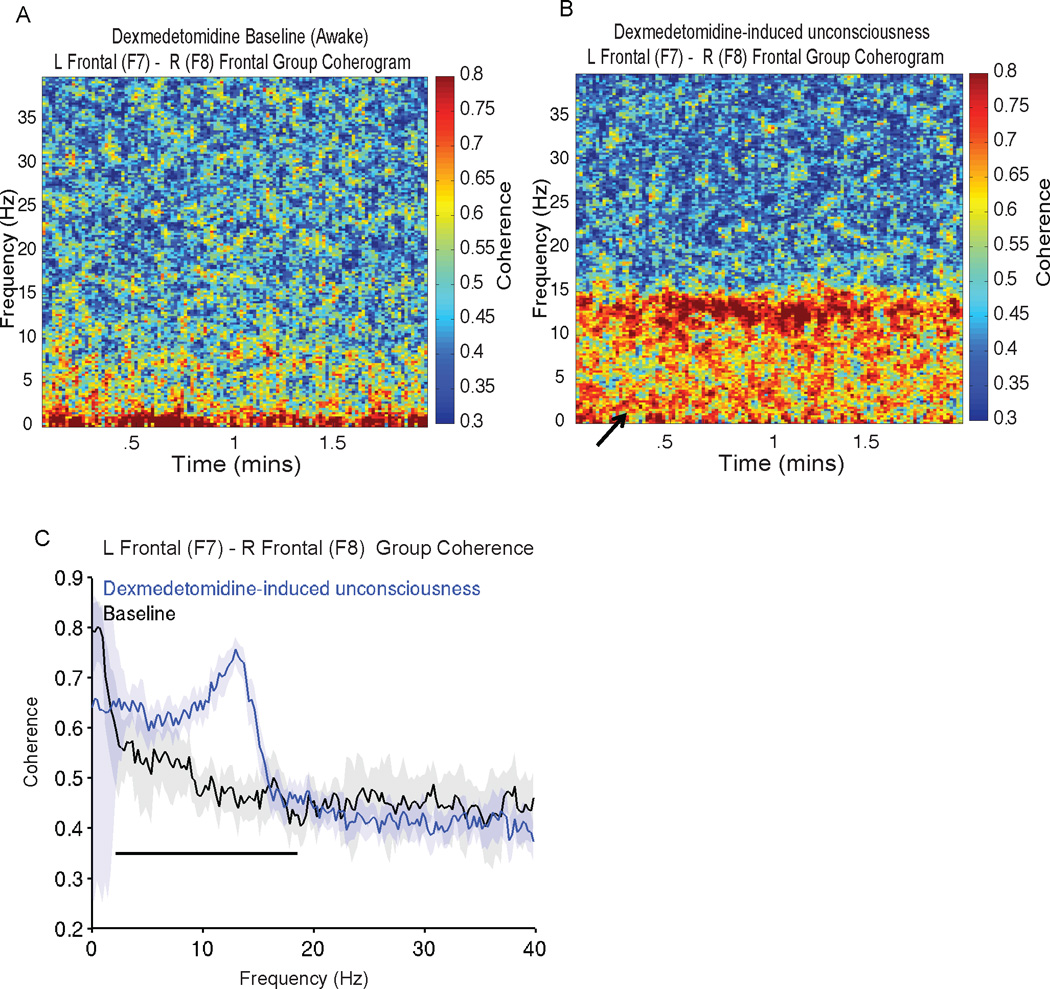
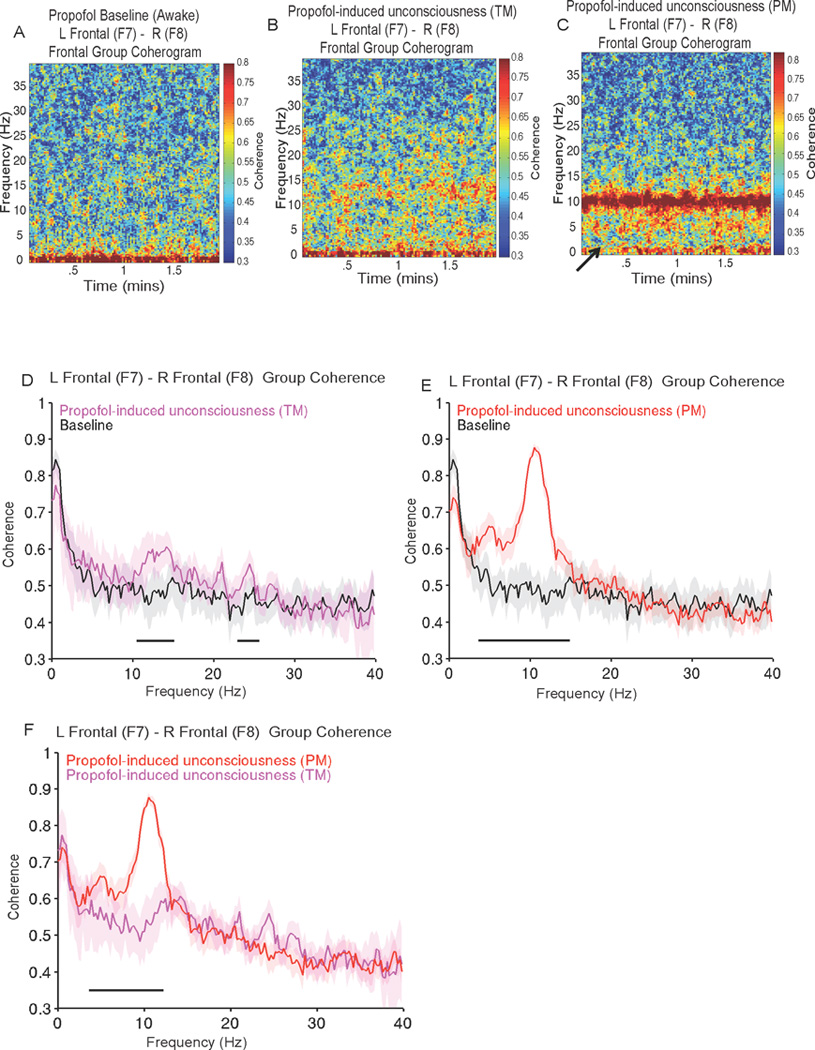
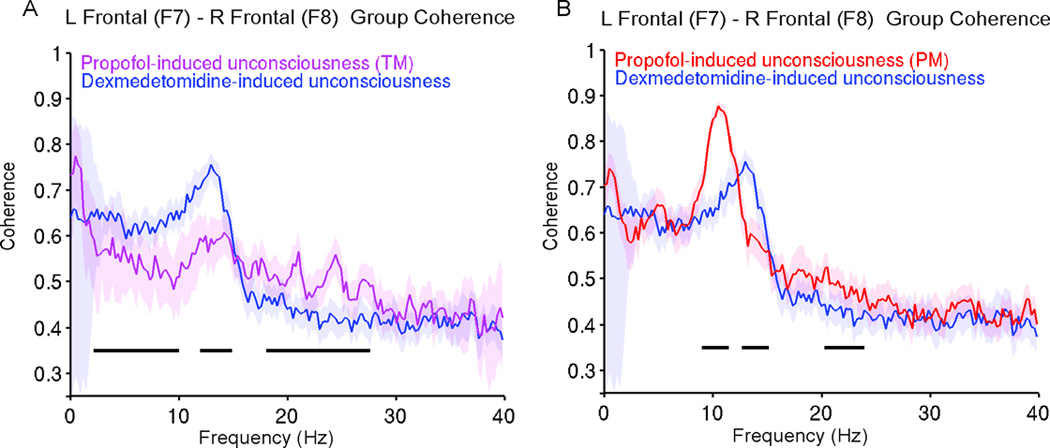
Background: Electroencephalogram patterns observed during sedation with dexmedetomidine appear similar to those observed during general anesthesia with propofol. This is evident with the occurrence of slow (0.1 to 1 Hz), delta (1 to 4 Hz), propofol-induced alpha (8 to 12 Hz), and dexmedetomidine-induced spindle (12 to 16 Hz) oscillations. However, these drugs have different molecular mechanisms and behavioral properties and are likely accompanied by distinguishing neural circuit dynamics.

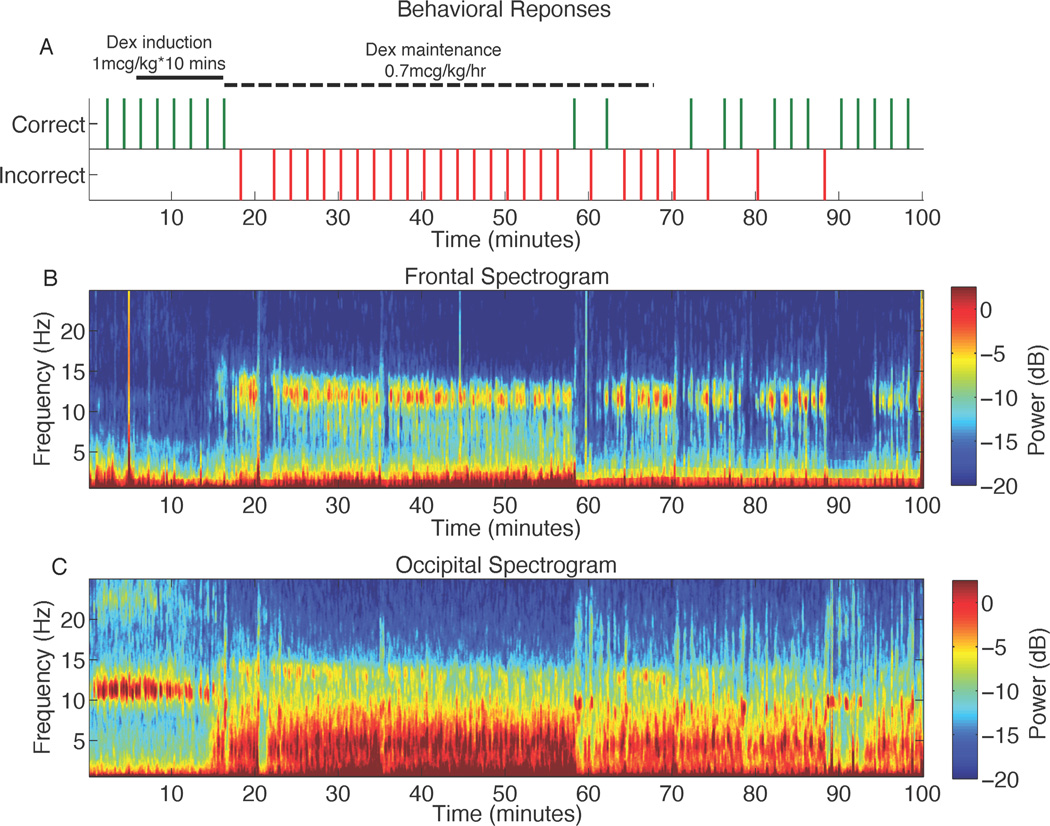
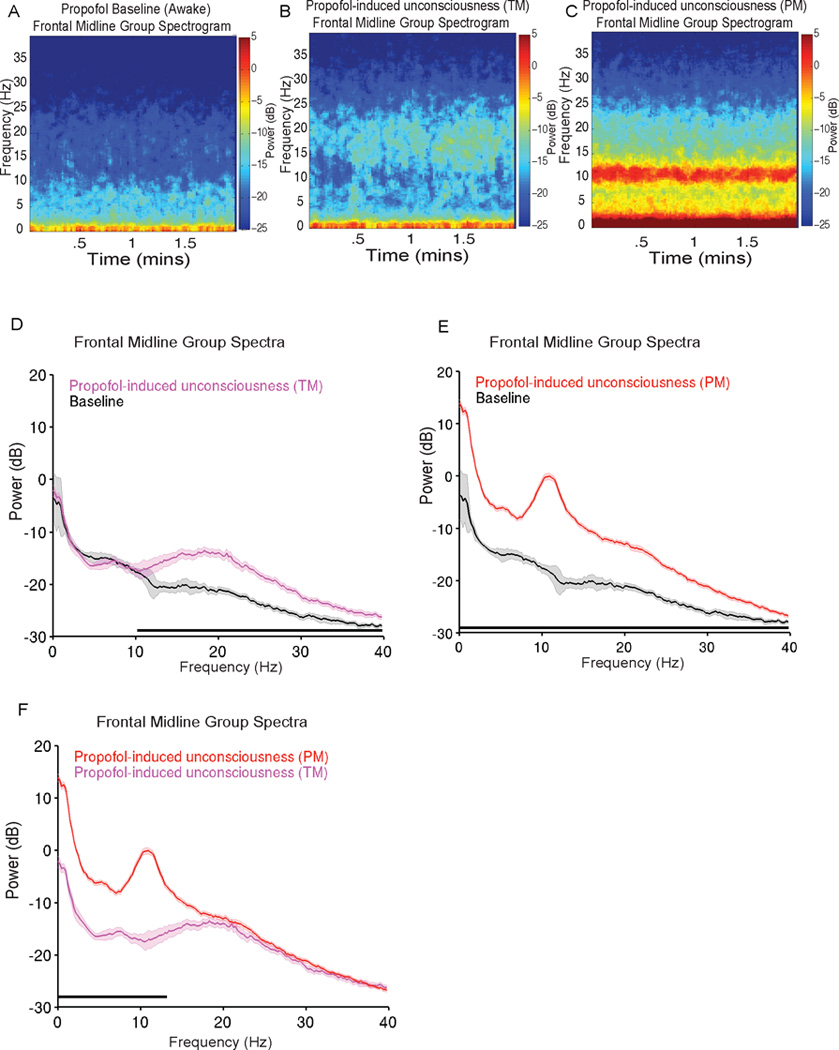
Methods: The authors measured 64-channel electroencephalogram under dexmedetomidine (n = 9) and propofol (n = 8) in healthy volunteers, 18 to 36 yr of age. The authors administered dexmedetomidine with a 1-µg/kg loading bolus over 10 min, followed by a 0.7 µg kg h infusion. For propofol, the authors used a computer-controlled infusion to target the effect-site concentration gradually from 0 to 5 μg/ml. Volunteers listened to auditory stimuli and responded by button press to determine unconsciousness. The authors analyzed the electroencephalogram using multitaper spectral and coherence analysis.

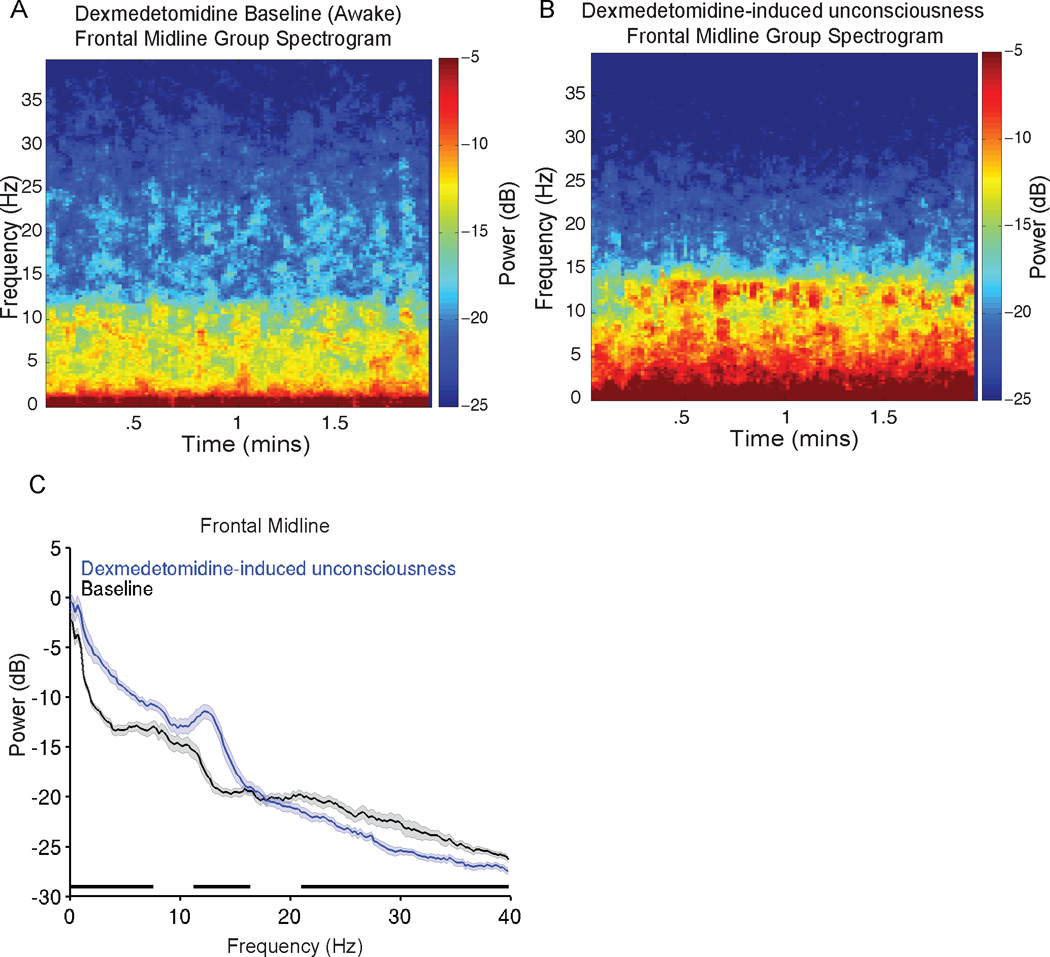
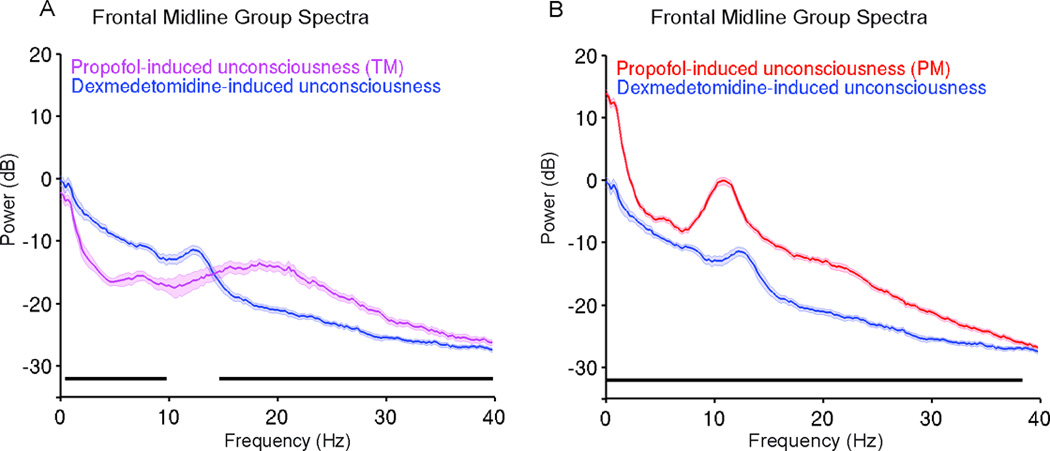
Results: Dexmedetomidine was characterized by spindles with maximum power and coherence at approximately 13 Hz (mean ± SD; power, -10.8 ± 3.6 dB; coherence, 0.8 ± 0.08), whereas propofol was characterized with frontal alpha oscillations with peak frequency at approximately 11 Hz (power, 1.1 ± 4.5 dB; coherence, 0.9 ± 0.05). Notably, slow oscillation power during a general anesthetic state under propofol (power, 13.2 ± 2.4 dB) was much larger than during sedative states under both propofol (power, -2.5 ± 3.5 dB) and dexmedetomidine (power, -0.4 ± 3.1 dB).

Conclusion: The results indicate that dexmedetomidine and propofol place patients into different brain states and suggest that propofol enables a deeper state of unconsciousness by inducing large-amplitude slow oscillations that produce prolonged states of neuronal silence.


Conflict of interest statement

All other authors have no conflict of interest.

Figures

Figure 1
Figure 1. Representative behavioral response, along with frontal and occipital spectrograms during the dexmedetomidine study
A. The volunteer was presented with an auditory stimulus at 2-min intervals during the study and asked to respond by button presses to assess the level of conscious behavior. Missing behavioral responses are indicated by an absence of tick marks. B. Frontal spectrogram of the volunteer in panel A above. The spectrogram displays the frequency content of signals as they change over time. Frequency is plotted on the y-axis, time is plotted on the x-axis, and the amount of energy or power in the signal is indicated in color. The onset of incorrect responses to the auditory stimuli parallels increased spindle power at ~13 Hz. C. Occipital spectrogram of the volunteer in panel A above. The onset of incorrect responses to the auditory stimuli parallels the loss of the awake-eyes closed alpha, and increased power in slow (0.1–1Hz), delta (1–4Hz), and theta (4–8Hz) frequency bands. db: decibel Dex: dexmedetomine Hz: hertz
Figure 2
Figure 2. Group level spectrograms, and spectral analysis comparing dexmedetomidine baseline to dexmedetomidine-induced unconsciousness
A. Group level spectrogram of dexmedetomidine baseline showing absence of power in the spindle frequency band. B. Group level spectrogram of dexmedetomidine-induced unconsciousness, showing increased power in the delta (1–4 Hz), theta (4–8 Hz) and alpha/spindle frequency bands (8–16 Hz). C. Power spectra of dexmedetomidine baseline vs. dexmedetomidine-induced unconsciousness. Electroencephalogram power was larger during dexmedetomidine-induced unconsciousness at 0–7.8Hz, and 11.5–16.6 Hz (P < 0.001, TGTS). Electroencephalogram power was lower during dexmedetomidine-induced unconsciousness at 21.2–40 Hz (P < 0.05, TGTS). Median spectra presented with 95% jackknife confidence intervals. Horizontal solid black line(s) represent frequency ranges at which significant difference existed. dB: decibel Hz: hertz TGTS: two group test spectrum
Figure 3
Figure 3. Group level spectrograms, and spectral analyses comparing propofol baseline, propofol-induced unconsciousness (TM), and propofol-induced unconsciousness (PM)
A. Group level spectrogram of propofol baseline showing absence of power in the alpha frequency band. B. Group level spectrogram of propofol-induced unconsciousness (TM), showing increased power in alpha-beta frequency bands. C. Group level spectrogram of propofol-induced unconsciousness (PM), showing increased power in slow (0.1–1Hz), delta (1–4 Hz) and alpha (8–13 Hz) frequency bands. D. Power spectra of propofol baseline vs. propofol-induced unconsciousness (TM). Electroencephalogram power was significantly larger than baseline across a broad frequency range at 10.5–40 Hz (P < 0.0003, TGTS). E. Power spectra of propofol baseline vs. propofol-induced unconsciousness (PM). Electroencephalogram power was significantly larger than baseline at 0.1–40 Hz (P < 0.0003, TGTS). F. Power spectra of propofol-induced unconsciousness (TM) vs. propofol-induced unconsciousness (PM). Electroencephalogram power was significantly larger during propofol-induced unconsciousness (PM) at 0.1–13.4 Hz (P < 0.0003, TGTS). Median spectra presented with 95% jackknife confidence intervals. Horizontal solid black line(s) represent frequency ranges at which significant difference existed. dB: decibel Hz: hertz PM: peak max TGTS: two group test spectrum TM: trough max
Figure 4
Figure 4. Group level spectral analyses comparing dexmedetomidine-induced unconsciousness to propofol-induced unconsciousness (TM) and propofol-induced unconsciousness (PM)
A. Power spectra of dexmedetomidine-induced unconsciousness vs. propofol-induced unconsciousness (TM). Electroencephalogram power was larger during propofol-induced unconsciousness (TM) compared to dexmedetomidine-induced unconsciousness at 14.9–40Hz (P < .0005, TGTS). Electroencephalogram power was larger during dexmedetomidine-induced unconsciousness at 0.7–10 Hz (P < .0005, TGTS). B. Power spectra of dexmedetomidine-induced unconsciousness vs. propofol-induced unconsciousness (PM). Electroencephalogram power was significantly larger than dexmedetomidine-induced unconsciousness at 0.1–40Hz (P < 0.0005, TGTS). Median spectra presented with 95% jackknife confidence intervals. Horizontal solid black line(s) represent frequency ranges at which significant difference existed. dB: decibel Hz: hertz PM: peak max TGTS: two group test spectrum TM: trough max
Figure 5
Figure 5. Group level coherograms, and coherence analysis comparing dexmedetomidine baseline to dexmedetomidine-induced unconsciousness
A. Group level coherogram of dexmedetomidine baseline showing relative absence of coherence in the spindle frequency band. B. Group level coherogram of dexmedetomidine-induced unconsciousness, showing increased coherence in the delta, theta and alpha frequency bands and decreased coherence in the slow wave frequency band (solid arrow). C. Coherence of dexmedetomidine baseline vs. dexmedetomidine-induced unconsciousness. Coherence was larger during dexmedetomidine-induced unconsciousness at 2.4–18.8 Hz (P < 0.001, TGTC). Median coherence presented with 95% jackknife confidence intervals. Horizontal solid black line(s) represent frequency ranges at which significant difference existed. Hz: hertz TGTC: two group test coherence
Figure 6
Figure 6. Group level coherograms, and coherence analyses of propofol baseline and propofol-induced unconsciousness (TM and PM)
A. Group level coherogram of propofol baseline showing relative absence of coherence in the delta, theta, alpha and beta frequency bands. B. Group level coherogram of propofol-induced unconsciousness (TM), showing increased coherence in alpha/beta frequency bands. C. Group level coherogram of propofol-induced unconsciousness (PM), showing increased coherence in slow, delta and alpha frequency bands and a decrease in slow oscillation coherence (solid arrow). D. Coherence of propofol baseline vs. propofol-induced unconsciousness (TM). Coherence was larger for propofol-induced unconsciousness (TM) in a broad beta/gamma range at 3.9–15.1 Hz, and 17.3–25.9 Hz (P < 0.0003, TGTC). E. Coherence of propofol baseline vs. propofol-induced unconsciousness (PM). Coherence was larger for propofol-induced unconsciousness (PM) 3.9–15.1 Hz (P < 0.0003, TGTC). F. Coherence of propofol-induced unconsciousness (TM) vs. propofol-induced unconsciousness (PM). Coherence was larger for propofol-induced unconsciousness (PM) at 3.9–12.5 Hz (P < 0.0003, TGTC). Median coherence presented with 95% jackknife confidence intervals. Horizontal solid black line(s) represent frequency ranges at which significant difference existed. Hz: hertz PM: peak max TGTC: two group test coherence TM: trough max
Figure 7
Figure 7. Group level coherence analyses comparing dexmedetomidine-induced unconsciousness to propofol-induced unconsciousness (TM) and propofol-induced unconsciousness (PM)
A. Coherence of dexmedetomidine-induced unconsciousness vs. propofol-induced unconsciousness (TM). Dexmedetomidine-induced unconsciousness coherence was larger at 2.4–10.3 Hz, 12.2–15.3Hz (P < 0.0005, TGTC). Coherence was larger during propofol-induced unconsciousness (TM) compared to dexmedetomidine-induced unconsciousness at 17.3–25.9 Hz (P < 0.0005, TGTC). B. Coherence of dexmedetomidine-induced unconsciousness vs. propofol-induced unconsciousness (PM). Propofol-induced unconsciousness (PM) coherence was larger than dexmedetomidine-induced unconsciousness in frequencies surrounding the alpha oscillation peak and at a narrow gamma band, 9.3–11.7 Hz and 19.5–26.9 Hz (P < .0005, TGTC). Dexmedetomidine-induced unconsciousness coherence was larger in frequencies surrounding the dex-spindle peak, 12.9–15.4 Hz (P < .0005, TGTC). Median coherence presented with 95% jackknife confidence intervals. Horizontal solid black line(s) represent frequency ranges at which significant difference existed. Hz: hertz PM: peak max TGTC: two group test coherence TM: trough max

Comment in

  • Propofol-induced electroencephalogram dynamics: a missing piece.
    Saraiva AP, Lobo FA. Saraiva AP, et al. Anesthesiology. 2015 Sep;123(3):723-5. doi: 10.1097/ALN.0000000000000793. Anesthesiology. 2015. PMID: 26284862 No abstract available.
  • In reply.
    Purdon PL, Zhou DW, Akeju O, Brown EN. Purdon PL, et al. Anesthesiology. 2015 Sep;123(3):725-8. doi: 10.1097/ALN.0000000000000794. Anesthesiology. 2015. PMID: 26284863 Free PMC article. No abstract available.

References

    1. Gibbs FA, Gibbs EL, Lennox WG. Effect on the electroencephalogram of certain drugs which influence nervous activity. Arch Intern Med. 1937;60:154–169.
    1. Kiersey DK, Bickford RG, Faulconer A., Jr Electro-encephalographic patterns produced by thiopental sodium during surgical operations; description and classification. BJA. 1951;23:141–152. - PubMed
    1. Faulconer A. Correlation of concentrations of ether in arterial blood with electroencephalographic patterns occurring during ether-oxygen and during nitrous oxide, oxygen and ether anesthesia of human surgical patients. Anesthesiology. 1952;13:361–369. - PubMed
    1. Palanca BJ, Mashour GA, Avidan MS. Processed electroencephalogram in depth of anesthesia monitoring. Curr Opin Anaesthesiol. 2009;22:553–559. - PubMed
    1. Rampil IJ. A primer for EEG signal processing in anesthesia. Anesthesiology. 1998;89:980–1002. - PubMed

Publication types