. 2014 Sep 4;10(9):e1004331.
doi: 10.1371/journal.ppat.1004331. eCollection 2014 Sep.

The secreted peptide PIP1 amplifies immunity through receptor-like kinase 7

Affiliations

The secreted peptide PIP1 amplifies immunity through receptor-like kinase 7

Shuguo Hou et al. PLoS Pathog. .

Erratum in

Abstract

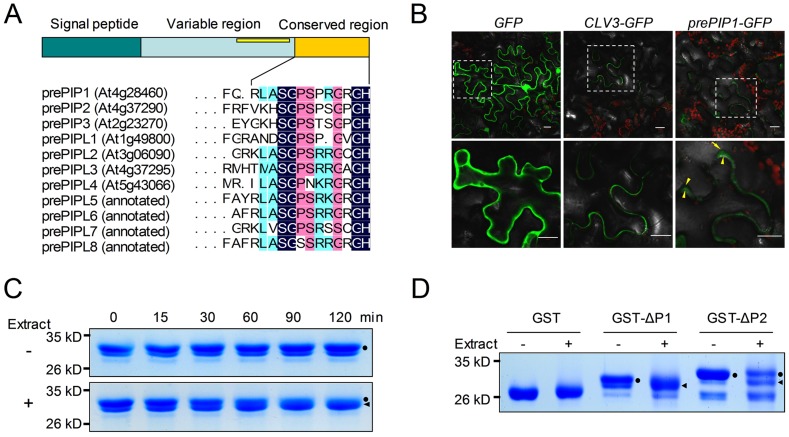
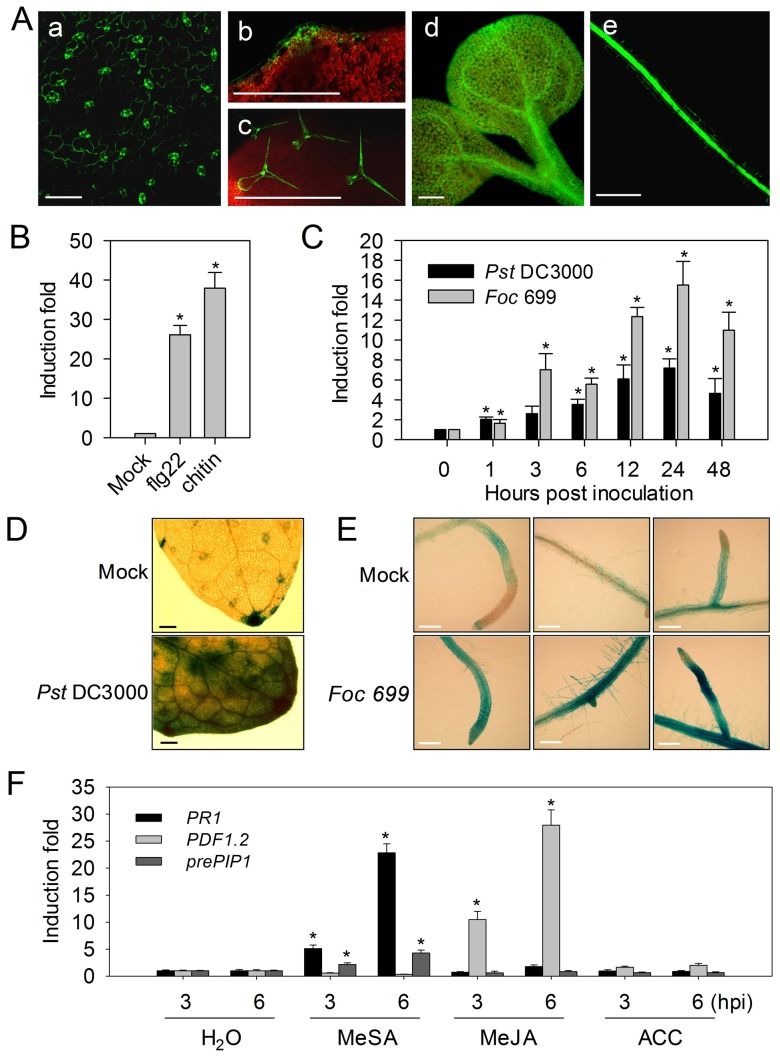
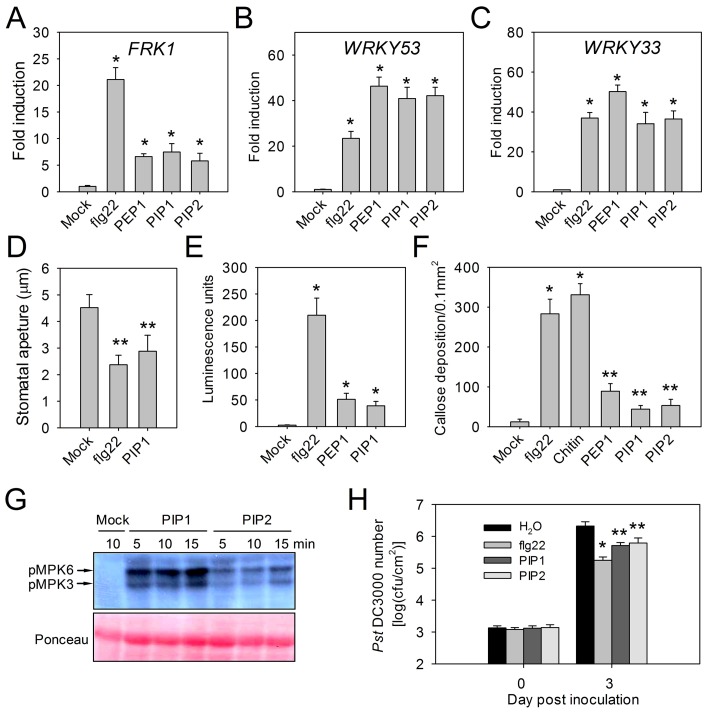
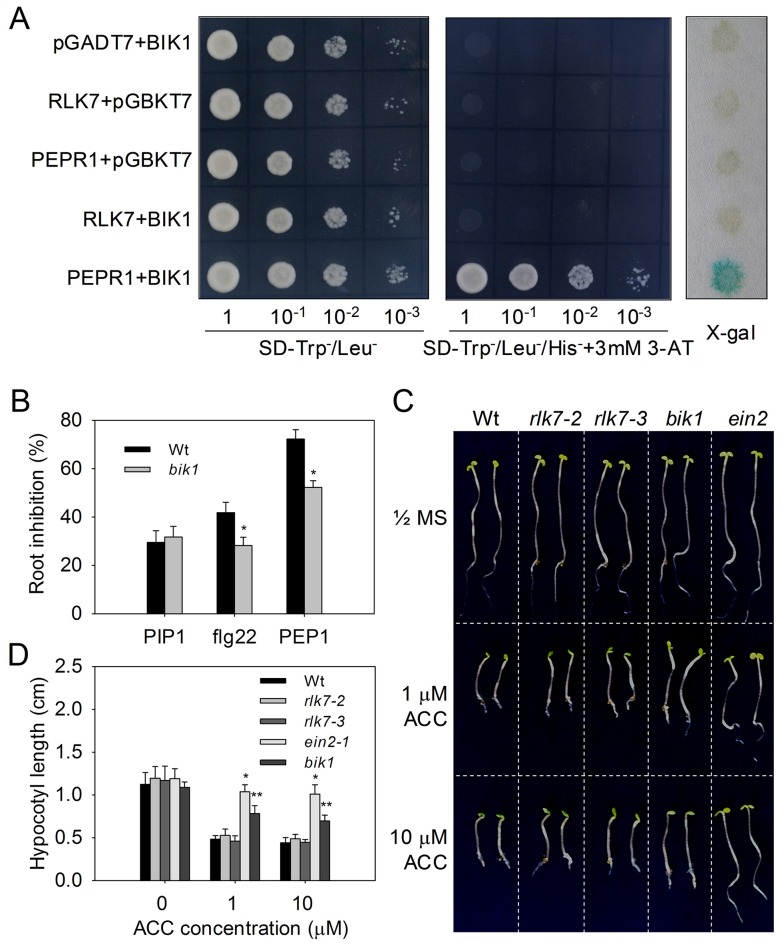
In plants, innate immune responses are initiated by plasma membrane-located pattern recognition receptors (PRRs) upon recognition of elicitors, including exogenous pathogen-associated molecular patterns (PAMPs) and endogenous damage-associated molecular patterns (DAMPs). Arabidopsis thaliana produces more than 1000 secreted peptide candidates, but it has yet to be established whether any of these act as elicitors. Here we identified an A. thaliana gene family encoding precursors of PAMP-induced secreted peptides (prePIPs) through an in-silico approach. The expression of some members of the family, including prePIP1 and prePIP2, is induced by a variety of pathogens and elicitors. Subcellular localization and proteolytic processing analyses demonstrated that the prePIP1 product is secreted into extracellular spaces where it is cleaved at the C-terminus. Overexpression of prePIP1 and prePIP2, or exogenous application of PIP1 and PIP2 synthetic peptides corresponding to the C-terminal conserved regions in prePIP1 and prePIP2, enhanced immune responses and pathogen resistance in A. thaliana. Genetic and biochemical analyses suggested that the receptor-like kinase 7 (RLK7) functions as a receptor of PIP1. Once perceived by RLK7, PIP1 initiates overlapping and distinct immune signaling responses together with the DAMP PEP1. PIP1 and PEP1 cooperate in amplifying the immune responses triggered by the PAMP flagellin. Collectively, these studies provide significant insights into immune modulation by Arabidopsis endogenous secreted peptides.


Conflict of interest statement

The authors have declared that no competing interests exist.

Figures

Figure 1
Figure 1. Identification of PIP peptides.
(A) Schematic presentation of prePIP homologs in A. thaliana. (B) Sub-cellular distribution of prePIP1-GFP in tobacco leaf cells. Tobacco leaves were transformed with Agrobacterium GV3101 harboring a construct containing GFP, prePIP1-GFP or CLV3-GFP, respectively. The yellow arrows point the plasma member. Scale bar = 20 µm. (C) Time-course of GST-ΔP1 proteolytic processing. (D) Proteolytic cleavage of GST-ΔP1 and GST-ΔP2 by total protein extract from A. thaliana. (C–D) SDS-PAGE separation of protein products. Dots mark intact GST-ΔP1 or GST-ΔP2; triangles mark processed GST-ΔP1 or GST-ΔP2. At least three replicates were performed with similar results.
Figure 2
Figure 2. Expression of prePIP1.
(A) Transgenic A. thaliana expressing GFP driven by the prePIP1 promoter in (a) the guard cell, (b) the hydathode, (c) the epidermal trichome, (d) the leaf vascular tissue and (e) the root vascular tissue. (B) RT-qPCR-based transcriptional profiling of prePIP1 in A. thaliana following treatment with flg22 or chitin. (C) RT-qPCR-based transcriptional profiling of prePIP1 in A. thaliana following inoculation with Pst DC3000 or Foc 699. GUS staining of prePIP1p-GUS transgenic A. thaliana seedlings after a 24 h exposure to Pst DC3000 (D), and Foc 699 (E). Scale bar = 200 µm. (F) RT-qPCR-based transcriptional profiling of prePIP1, PR1, and PDF1.2 in A. thaliana following exposure to MeSA, MeJA, and ACC. Error bars represent ± standard error (SE) of the mean (n = 3). *: difference significant at p<0.01 (t-test). Three replicates were performed with similar results.
Figure 3
Figure 3. Root growth is inhibited by PIP1 and PIP2.
(A) RT-PCR-based detection of prePIP1 and prePIP2 transcripts in transgenic A. thaliana. (B) Morphology and (C) root length of eight day old WT, 35S::prePIP1 and 35S::prePIP2 transgenic seedlings. (D) Effect of the concentration of PIP1 derivatives on A. thaliana root growth inhibition. (E) Effect of pH on PIP1-induced root growth inhibition. (F) A. thaliana root growth is inhibited by PIP1 and PIP2. Error bars represent the SE of the mean (n>30), *, **: differences significant at p<0.01, 0.001 (t-test). Three replicates were performed with similar results.
Figure 4
Figure 4. The FRK1 promoter is activated by PIP1 and PIP2.
(A) Schematic presentation of the constructs containing prePIP1 and truncated prePIP1 sequences. (B) FRK1 promoter activation in protoplasts following co-transfection with FRK1p-LUC and prePIP1 or truncated prePIP1. (C) FRK1 promoter activation by PIP1, PIP2, flg22, and PEP1. Protoplasts transfected with FRK1p-LUC were exposed to 1 µM of each peptide for 4 h. (B–C) Error bars represent the SE of the mean (n = 5), *: significantly different from control at p<0.01 (t-test), ns: non significant difference. Three replicates were performed with similar results.
Figure 5
Figure 5. Immune response activation by PIP1 and PIP2.
Transcription of (A) FRK1, (B) WRKY53, (C) WRKY33 in A. thaliana seedlings treated with flg22, PEP1, PIP1, and PIP2. Error bars represent the SE of the mean (n = 3). At least three replicates were performed with similar results. (D) Stomatal closure induced by PIP1 and flg22. Error bars represent the SE of the mean (n>100). Three replicates were performed with similar results. (E) Relative ROS production in adult leaves upon treatments with PIP1, PEP1, and flg22. Error bars represent the SE of the mean (n = 5). Two replicates were performed with similar results. (F) Callose deposition in leaves upon induction with different peptides or chitin. Error bars represent the SE of the mean (n = 5). Two replicates were performed with similar results. (G) MAPK activation induced by PIP1 and PIP2. Ten day old seedlings were exposed to 1 µM peptides for 5, 10 or 15 min. Western blot analysis was performed with the phospho-p44/42 MAPK antibody. Two replicates were performed with similar results. (H) Pst DC3000 growth in A. thaliana leaves. Error bars represent the SE of the mean (n = 6). *, **: significantly different from mock treatment at p<0.001 and <0.01 (t-test). Three replicates were performed with similar results.
Figure 6
Figure 6. Immune response activation in roots by PIP1 and PIP2.
(A) MYB51p::GUS expression (top panel) and callose deposition (lower panel) in A. thaliana seedlings exposed to peptide elicitors. Two replicates were performed with similar results. (B) Foc 699-GFP infection in WT, 35S::prePIP1 and 35S::prePIP2 seedlings. Top and center: GFP signal in roots of A. thaliana seedlings after 12–24 hour' infection with Foc 699-GFP (scale bar = 0.5 mm). Bottom: representative plants 21 days post infection. Three replicates were performed with similar results. (C) Quantification of fungal biomass in 35S::prePIP1 and 35S::prePIP2 transgenic seedlings 12 h after infection with Foc 699-GFP. (D) Survival of plants 21 days after infection with Foc 699-GFP. (C–D) Error bars represent the SE of three replicates that contained 30 to 40 plants or seedlings each. *: significantly different from control at p<0.01 (t-test).
Figure 7
Figure 7. RLK7 is required for the PIP1 and PIP2 response and for PIP1 binding.
(A) Root length of WT and rlk7 seedlings grown with or without 1 µM PIP1 or 1 µM PIP2. (B) Root length of rlk7 and rlk7×35S::prePIP seedlings. (A–B) Error bars represent the SE of the mean (n>30). Means marked by “a” differed significantly (p<0.001) from those marked “b” (t-test). (C) Transcription of WRKY33 in WT and rlk7 seedlings exposed to 1 µM PIP1 or 1 µM PIP2. Error bars represent the SE of the three replicates. Means marked by “a” differed significantly (p<0.001) from those marked “b” (t-test). (D) MAPK activation by PIP1 in WT and rlk7-3 seedlings. Ten day old seedlings were exposed to 1 µM peptide for 5 and 10 min. Western blot analysis was performed with the phospho-p44/42 MAPK antibody. Two replicates were performed with similar results. (E) Growth of Pst DC3000 in WT and rlk7-3 plants with or without treatment with 1 µM PIP1. Error bars represent the SE of the mean (n = 6). Three replicates were performed with similar results. Means marked by “a” differed significantly (p<0.01) from those marked “b” (t-test). (F) Survival rate of plants 21 days post infection with Foc 699-GFP. Error bars represent SE from three replicates that contained 30 to 40 plants each. Statistically significant (p<0.05) differences are indicated by different letters (t-test). (G) Detection of biotinylated PIP1 binding to RLK7-HA using a pull-down assay. Membrane proteins extracted from rlk7 or rlk7/35S::RLK7-HA leaves incubated with PIP1-biotin bound to streptavidin beads in the presence (+) or absence (−) of unlabeled PIP1 or IDA. RLK7-HA bound to the beads was detected with an anti-HA antibody. (H) Detection of RLK7-HA by chemical cross-linking of PIP1-biotin. Cross-linking of PIP1-biotin to proteins from 35S::RLK7-HA and rlk7-3 plants in the presence (+) or absence (−) of excess unlabeled PIP1. Bands were detected with anti-biotin antibody. (I) 125I-Y-PIP1 binding activity of plasma membrane fragments from tobacco leaves expressing RLK7-HA or GFP. Error bars represent the SE of the mean (n = 5). Means marked by “a” differed significantly (p<0.01) from those marked “b” (t-test). (G–I) At least two repeats were performed with similar results.
Figure 8
Figure 8. Full PIP1 response requires BAK1.
(A) PIP1-induced ROS production in bak1-4 leaves. ROS production was measured after elicitation with 1 µM peptides. Error bars represent the SE of the mean (n = 5). (B) PIP1-induced root growth inhibition. Error bars represent the SE of the mean (n>30). *, **: significantly different from mock treatment at p<0.001 and <0.01 (t-test). Three repeats were performed with similar results.
Figure 9
Figure 9. PIP1-RLK7 signaling is BIK1 independent.
(A) Interaction between PEPR1 or the RLK7 kinase domain and BIK1 in the yeast two-hybrid assay. Yeast cells containing the indicated plasmids were analyzed for His and LacZ reporter activities. PEPR1KD, pGADT7 containing PEPR1 kinase domain; RLK7KD, pGADT7 containing RLK7 kinase domain; BIK1, pGBKT7 containing BIK1. (B) Root length of 8-day old WT and bik1 seedlings grown in the presence of 1 µM flg22, PIP1, or PEP1. Triple response phenotype (C) and hypocotyl length (D) of A. thaliana seedlings grown in the presence or absence of ACC. Error bars represent the SE of the mean (n>30). *, **: significantly different from mock treatment at p<0.001 and <0.01 (t-test). At least two repeats were performed for all experiments with similar results.
Figure 10
Figure 10. PIP1-RLK7 and PEP1-PEPR1 cooperatively amplify FLS2 signaling.
(A) Fluorescence microscopy imaging and (B) quantification of flg22-induced callose deposition in leaves of WT and prePIP over-expression lines. Error bars represent the SE of the mean (n>10). Statistically significant (p<0.01) differences indicated by different letters (t-test). Two repeats were performed with similar results. (C) Fluorescence microscopy imaging of chitin-induced callose deposition in roots of WT and prePIP over-expression lines. Two repeats were performed with similar results. (D) Pst DC3000 growth in A. thaliana leaves pretreated with flg22, PIP1 or a combination of flg22 and PIP1. Error bars represent the SE of the mean (n = 8). Three repeats were performed with similar results. (E) RT-qPCR analysis of WRKY33 transcript abundance after 30 min treatment with H2O or 1 µM peptide. Error bars represent the SE of the three repeats. (F) RT-qPCR analysis of PR1 transcript abundance after 24 h treatment with H2O or 1 µM peptide. Error bars represent the SE of the mean (n = 3). Two repeats were performed with similar results. (D–F) Statistically significant (p<0.01) differences were indicated by different letters (t-test). (G) Pst DC3118 growth in leaves of WT and rlk7 plants treated with water (mock) or 100 nM flg22. Error bars represent the SE of the mean (n = 8). Statistically significant (p<0.01) differences were indicated by different letters (ANOVA). Three repeats were performed with similar results. (H) Fold induction of FLS2 expression by treatment with PIP1 and PEP1. (I) Fold induction of prePIP1 and RLK7 by PIP1. (J) Fold induction of proPEP1 and PEPR1 by PIP1. (K) Fold induction of proPEP1 and PEPR1 by PEP1. (L) Fold induction of prePIP1 and RLK7 by PEP1. (H–L) A. thaliana seedlings were treated with 1 µM PIP1 or PEP1 for 0.5 hours, and gene expression was measured by RT-qPCR analysis. Error bars represent the SE of the mean (n = 3). *: significantly different from mock treatment at p<0.01 (t-test). Two repeats were performed with similar results.
Figure 11
Figure 11. Proposed model of the roles of PIP1-RLK7 and PEP1-PEPR1 in PTI signal amplification.
(A) flg22 perception by FLS2 primes immunity and activates transcription of FLS2, PEPR1, RLK7, proPEP1 and prePIP1. (B) PEP1 and PIP1 peptides are generated from their precursor proteins and released into the apoplast to trigger PTI responses after recognition by the cognate receptors. Moreover, they act in a positive feedback loop by activating expression of genes encoding their own precursors and receptors, as well as FLS2. (C) Finally, the level of immunity is maximized by the combined effect of FLS2, PEPR1 and RLK7.

References

    1. Jones JD, Dangl JL (2006) The plant immune system. Nature 444: 323–329. - PubMed
    1. Boller T, Felix G (2009) A renaissance of elicitors: perception of microbe-associated molecular patterns and danger signals by pattern-recognition receptors. Annu Rev Plant Biol 60: 379–406. - PubMed
    1. Huffaker A, Pearce G, Ryan CA (2006) An endogenous peptide signal in Arabidopsis activates components of the innate immune response. Proc Natl Acad Sci USA 103: 10098–10103. - PMC - PubMed
    1. Sanabria N, Goring D, Nurnberger T, Dubery I (2008) Self/nonself perception and recognition mechanisms in plants: a comparison of self-incompatibility and innate immunity. New Phytol 178: 503–514. - PubMed
    1. Shiu SH, Bleecker AB (2001) Receptor-like kinases from Arabidopsis form a monophyletic gene family related to animal receptor kinases. Proc Natl Acad Sci USA 98: 10763–10768. - PMC - PubMed

Publication types

MeSH terms