. 2014 Sep 4;10(9):e1004583.
doi: 10.1371/journal.pgen.1004583. eCollection 2014 Sep.

Eliminating both canonical and short-patch mismatch repair in Drosophila melanogaster suggests a new meiotic recombination model

Affiliations

Eliminating both canonical and short-patch mismatch repair in Drosophila melanogaster suggests a new meiotic recombination model

K Nicole Crown et al. PLoS Genet. .

Abstract

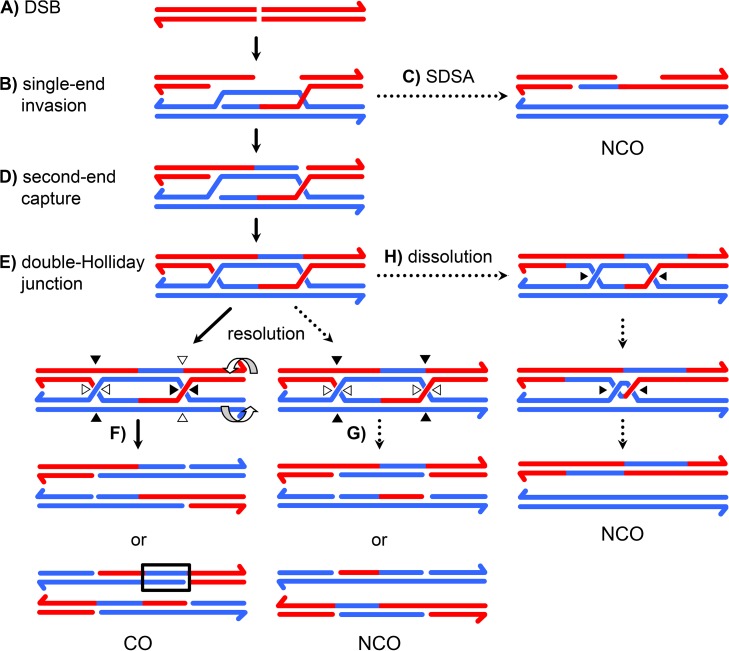
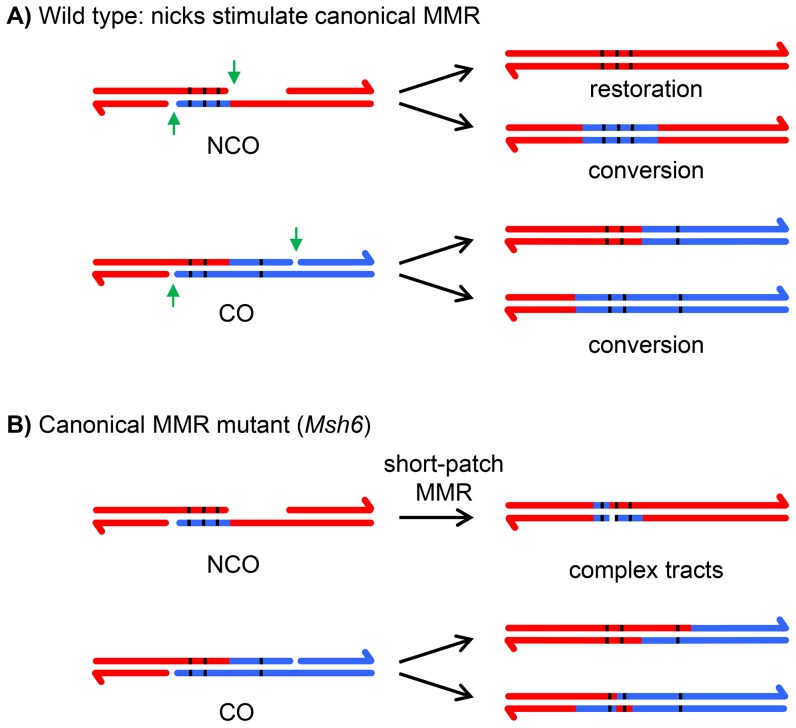
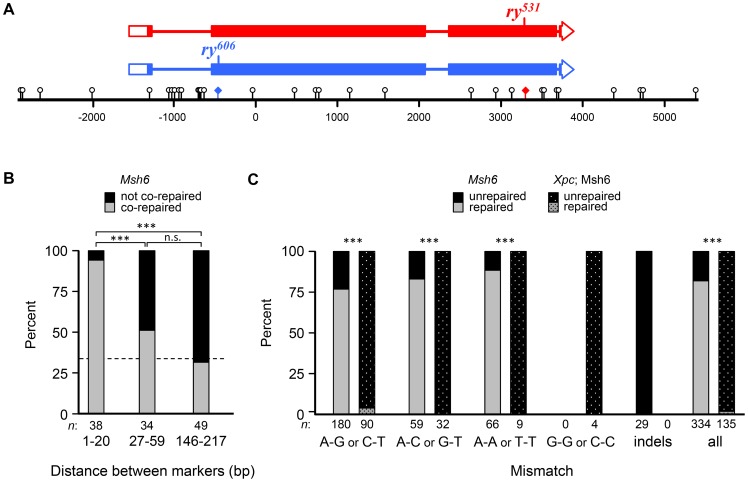
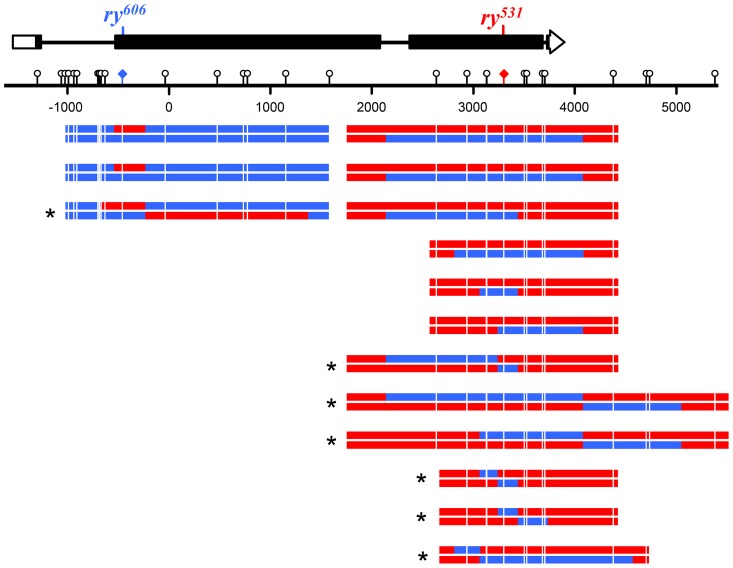
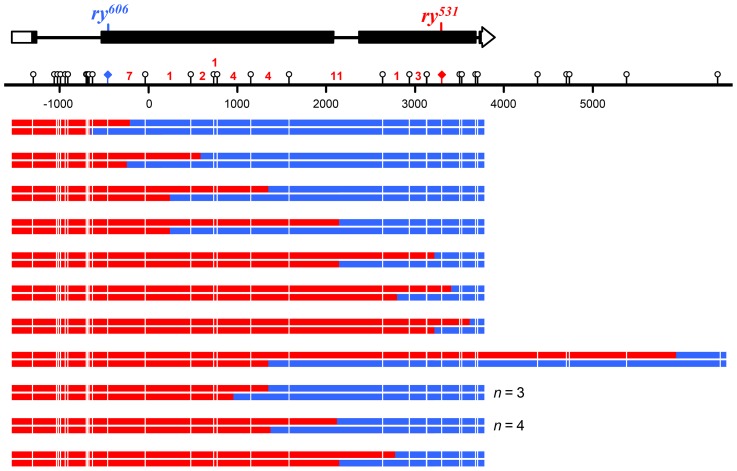
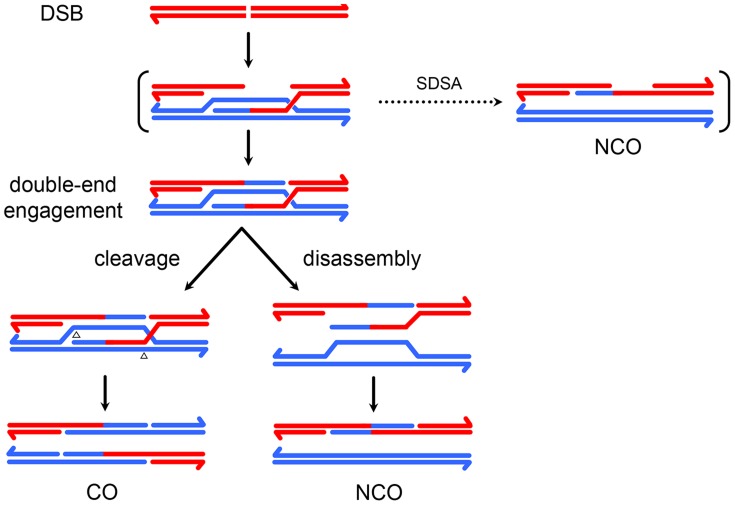
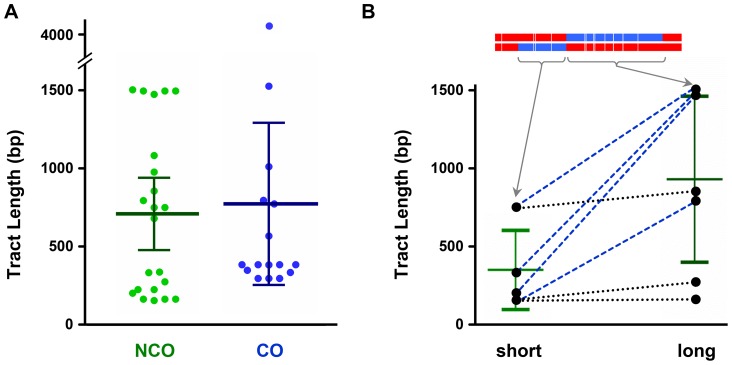
In most meiotic systems, recombination is essential to form connections between homologs that ensure their accurate segregation from one another. Meiotic recombination is initiated by DNA double-strand breaks that are repaired using the homologous chromosome as a template. Studies of recombination in budding yeast have led to a model in which most early repair intermediates are disassembled to produce noncrossovers. Selected repair events are stabilized so they can proceed to form double-Holliday junction (dHJ) intermediates, which are subsequently resolved into crossovers. This model is supported in yeast by physical isolation of recombination intermediates, but the extent to which it pertains to animals is unknown. We sought to test this model in Drosophila melanogaster by analyzing patterns of heteroduplex DNA (hDNA) in recombination products. Previous attempts to do this have relied on knocking out the canonical mismatch repair (MMR) pathway, but in both yeast and Drosophila the resulting recombination products are complex and difficult to interpret. We show that, in Drosophila, this complexity results from a secondary, short-patch MMR pathway that requires nucleotide excision repair. Knocking out both canonical and short-patch MMR reveals hDNA patterns that reveal that many noncrossovers arise after both ends of the break have engaged with the homolog. Patterns of hDNA in crossovers could be explained by biased resolution of a dHJ; however, considering the noncrossover and crossover results together suggests a model in which a two-end engagement intermediate with unligated HJs can be disassembled by a helicase to a produce noncrossover or nicked by a nuclease to produce a crossover. While some aspects of this model are similar to the model from budding yeast, production of both noncrossovers and crossovers from a single, late intermediate is a fundamental difference that has important implications for crossover control.


Conflict of interest statement

The authors have declared that no competing interests exist.

Figures

Figure 1
Figure 1. A current model of meiotic recombination.
(A) A double-strand break (DSB) is processed to form 3′ single strand overhangs. (B) One of the single strands invades the homologous chromosome, forming a single-end invasion intermediate. (C) After synthesis, this intermediate may be disassembled, allowing the newly synthesized DNA to anneal to the other resected end. This process, called synthesis dependent strand annealing (SDSA), generates NCOs only. This NCO is drawn with hDNA intact, but the nicks in the product would likely stimulate mismatch repair, possibly leading to a single tract of gene conversion to one side of the DSB. (D) In the absence of SDSA, the second end of the DSB may be captured by annealing to the displaced strand of the D-loop, priming synthesis. (E) This structure is ligated to form a double Holliday junction (dHJ). The HJs are cleaved in a process called resolution. (F) Cleaving different strands at each junction (left) results in a CO. One way of doing this (open arrowheads) results in products with a single hDNA tract; the other orientation (black arrowheads) gives products with MMR-independent gene conversion (outlined in black) adjacent to the tract of hDNA. (G) Cutting the same two strands at both junctions (right) results in a NCO. Both orientations give one product with a single tract of hDNA and one with hDNA adjacent to a gene conversion tract. Resolution, like SDSA, leaves nicks in the final products that are thought to direct mismatch repair. (H) dHJs may be dissolved by the combined activities of a helicase and topoisomerase, resulting in a NCO with trans hDNA and lacking nicks.
Figure 2
Figure 2. Effects of canonical and short-patch mismatch repair on hDNA correction.
(A) In wild-type cells, canonical MMR is thought to be stimulated by the nicks (green arrows) left after repair synthesis is complete . Any mismatches in the hDNA (black lines) can either be restored to the original genotype or converted; all mismatches within the hDNA are repaired in the same direction because canonical MMR repairs long tracts. In the case of crossovers, regions of gene conversion can only be detected by recovering both recombinant chromatids. If only one is recovered, as in most metazoan systems, regions of gene conversion are not detectable. (B) In a canonical MMR mutant, such as Msh6, a short-patch MMR system is able to repair mismatches. In contrast to canonical MMR, mismatches that are very close together are repaired independently of one another (or not repaired), producing complex repair tracts.
Figure 3
Figure 3. Short-patch co-repair frequencies are consistent with NER tracts.
(A) Schematic of the rosy locus used to recover tracts of hDNA. Boxes represent exons and filled regions denote coding sequences. Locations of mutants are indicated on the schematics and shown on the scale bar as colored diamonds. Markers used to map hDNA tracts are shown as lollipops on the scale bar (distances in base pairs, bp). See Materials and Methods for details. (B) Percentage of adjacent markers that are co-repaired and not co-repaired for different distances. Bars show the percentage in each class (gray, co-repaired; black, not co-repaired) for different ranges of distance between markers. The dotted line represents the expected frequency of co-repair if adjacent markers are repaired independently. The shortest distance class is within the range of NER excision tract size. (C) Frequency of repair of different mismatches in Msh6 and Xpc; Msh6 mutants. Bars represent percentage of each mismatch type that were repaired (gray) or unrepaired (black). Since DSBs likely occur at different, unknown sites, we cannot tell which of two possible mismatches was in the hDNA of the intermediate (though this can be inferred for trans hDNA in Xpc; Msh6 mutants). Msh6 data in (B) and (C) are from Radford et al. (2007b). NCOs that had full gene conversion with no unrepaired sites were not included, since these might arise through other mechanisms (see Figure S1); however, including these tracts did not change the outcome in either case. ***, P<0.0001; n.s., P>0.05 (two-sided Fisher's exact test).
Figure 4
Figure 4. Noncrossovers from Xpc; Msh6 mutants.
At the top is a schematic of the rosy locus and the location of the mutant alleles used for purine selection (see Figure 3 and Materials and Methods). Each pair of lines below the scale represents the two strands of an independent noncrossover recombinant chromosome (red, sequence from ry531 chromosome; blue, sequence from ry606 chromosome). Markers used to map hDNA tracts are indicated with lollipops on the scale bar and white lines on the recombinants. Tract ends are shown as the halfway point between the last marker included in the tract and the first marker not in the tract. The two tracts at ry606 that contain only a single marker were not included in the trans/cis analysis. Asterisks indicate tracts with trans hDNA.
Figure 5
Figure 5. Crossovers from Xpc; Msh6 mutants.
At the top is a schematic of the rosy locus and the location of the mutant alleles used for purine selection (see Figure 3 and Materials and Methods). Each pair of lines below the scale represents the two strands of an independent crossover chromosome (red, sequence from ry531 chromosome; blue, sequence from ry606 chromosome). Markers used to map hDNA tracts are indicated with lollipops on the scale bar and white lines on the recombinants. Tract ends are shown as the halfway point between the last marker included in the tract and the first marker not included in the tract. All crossovers with detectable hDNA are shown. The number of crossovers without detectable hDNA that occurred within each interval are indicated in red numbers above the scale bar.
Figure 6
Figure 6. A model for meiotic recombination in Drosophila.
At the top is a chromatid with a DSB, which enters into recombination with a chromatid on the homologous chromosome. A single-end invasion intermediate may be transient (indicated by brackets) or may give rise to some NCOs. Second-end capture and synthesis produces the two-end engagement intermediate. COs arise by nicking of this intermediate across from the existing nicks (arrowheads). NCOs arise by disassembly of the two-ended engagement intermediate by a helicase. In the version drawn here, resection is symmetric with respect to the DSB and synthesis tracts are the same length as resection tracts, resulting in nicked HJs. It is possible that resection and/or strand invasion/strand capture are asymmetric. It is also possible that synthesis does not extend all the way across the resected region, leaving a three-stranded junction instead of a nicked HJ. These possibilities, while compatible with the data, do not change the major features of the model.
Figure 7
Figure 7. Comparison of hDNA tract lengths.
(A) Tract lengths from noncrossovers (NCO) compared to tract lengths from crossovers (CO). Each dot represents the maximum-likelihood size of on hDNA tract (see Materials and Methods). Bars indicate mean and 95% confidence intervals. The CO mean includes one exceptionally long CO tract (4198 bp), but the difference between NCO and CO was not significant regardless of whether this tract was included (P = 0.7985) or excluded (P = 0.2901). (B) Relationship between lengths of the two sides of trans hDNA NCO tracts. The shorter side of each is graphed on the left and the longer side on the right. One example is shown at the top, with arrows pointing to the length of the short and long sides (this example is the fifth NCO from the bottom in Fig. 4, reversed so the shorter end is on the left). Short and long sides from each individual tract are connected by lines: blue dashed lines, events in which short and long sides were markedly different; black dotted lines, events in which short and long sides were similar in length. Bars show means and 95% confidence intervals. The difference is modestly significant (P = 0.0261).

References

    1. Kohl KP, Sekelsky J (2013) Meiotic and mitotic recombination in meiosis. Genetics 194: 327–334. - PMC - PubMed
    1. Bishop DK, Zickler D (2004) Early decision; meiotic crossover interference prior to stable strand exchange and synapsis. Cell 117: 9–15. - PubMed
    1. Schwacha A, Kleckner N (1995) Identification of double Holliday junctions as intermediates in meiotic recombination. Cell 83: 783–791. - PubMed
    1. Hunter N, Kleckner N (2001) The single-end invasion: an asymmetric intermediate at the double-strand break to double-holliday junction transition of meiotic recombination. Cell 106: 59–70. - PubMed
    1. Szostak JW, Orr-Weaver TL, Rothstein RJ, Stahl FW (1983) The double-strand-break repair model for recombination. Cell 33: 25–35. - PubMed

Publication types

MeSH terms

LinkOut - more resources