. 2014 Sep 5:5:4826.
doi: 10.1038/ncomms5826.

Cdk5-mediated phosphorylation of RapGEF2 controls neuronal migration in the developing cerebral cortex

Affiliations

Cdk5-mediated phosphorylation of RapGEF2 controls neuronal migration in the developing cerebral cortex

Tao Ye et al. Nat Commun. .

Abstract

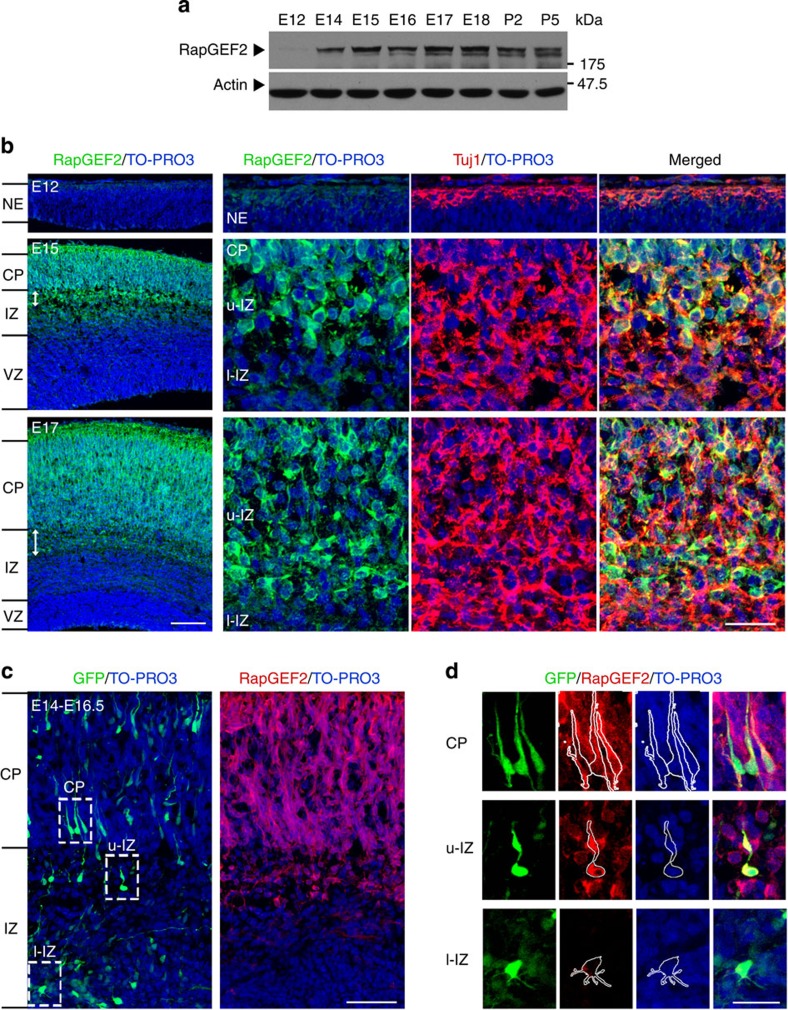
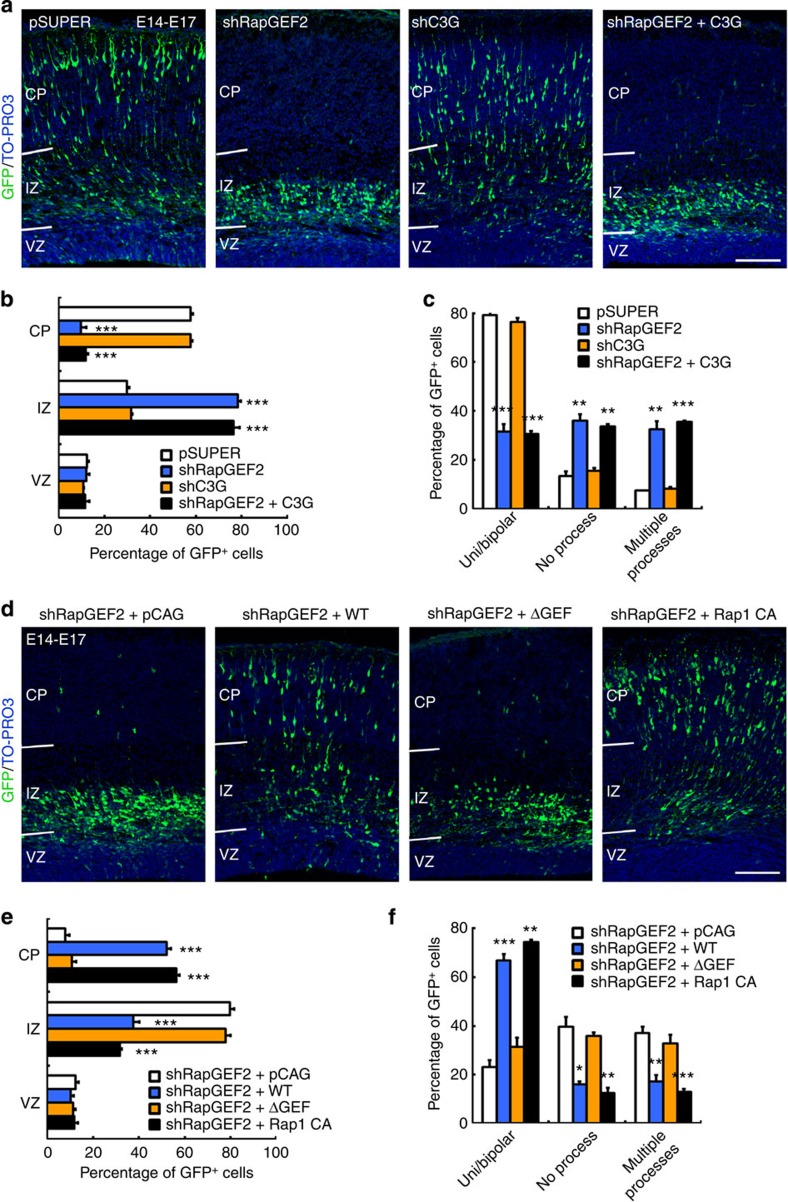
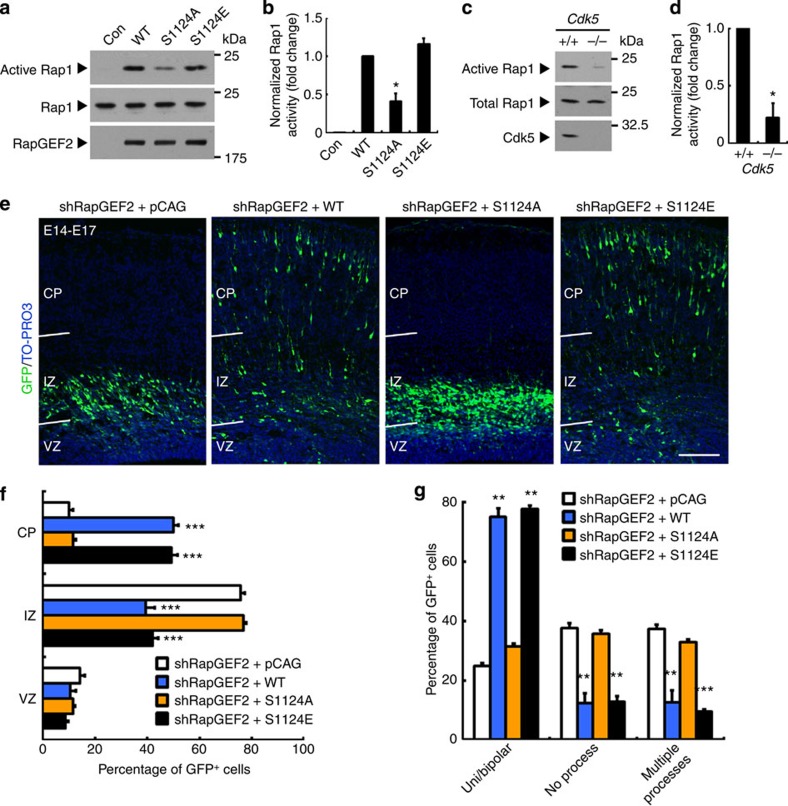
During cerebral cortex development, pyramidal neurons migrate through the intermediate zone and integrate into the cortical plate. These neurons undergo the multipolar-bipolar transition to initiate radial migration. While perturbation of this polarity acquisition leads to cortical malformations, how this process is initiated and regulated is largely unknown. Here we report that the specific upregulation of the Rap1 guanine nucleotide exchange factor, RapGEF2, in migrating neurons corresponds to the timing of this polarity transition. In utero electroporation and live-imaging studies reveal that RapGEF2 acts on the multipolar-bipolar transition during neuronal migration via a Rap1/N-cadherin pathway. Importantly, activation of RapGEF2 is controlled via phosphorylation by a serine/threonine kinase Cdk5, whose activity is largely restricted to the radial migration zone. Thus, the specific expression and Cdk5-dependent phosphorylation of RapGEF2 during multipolar-bipolar transition within the intermediate zone are essential for proper neuronal migration and wiring of the cerebral cortex.


Figures

Figure 1
Figure 1. Developmental expression of RapGEF2 in the neocortex.
(a) Temporal expression of RapGEF2 protein in the mouse neocortex during embryonic and early postnatal development. Actin served as the loading control. See full-length blots in Supplementary Fig. 10. (b) Dynamic spatial expression pattern of RapGEF2 in the cerebral cortex during development. Coronal brain sections at embryonic days (E) 12, 15 and 17 were collected and stained for RapGEF2, Tuj1 (a neuronal marker) and TO-PRO3 (a nuclear marker). Double-headed arrows, upper intermediate zone (u-IZ). NE, neuroepithelium; VZ, ventricular zone; l-IZ, lower intermediate zone; CP, cortical plate. Scale bars, 100 and 20 μm (left and right panels, respectively). (c) E14 mouse brains were electroporated with GFP plasmid. Representative E16.5 (60 h post electroporation) cortical sections were stained by GFP, RapGEF2 and TO-PRO3. Scale bar, 100 μm. The experiment was repeated for at least three times. (d) Magnified images of selected regions in c. Scale bar, 20 μm.
Figure 2
Figure 2. RapGEF2 regulates neuronal migration to the cortical plate.
(a) E14 mouse brains were co-electroporated with vector control (pSUPER) or two different RapGEF2 shRNAs (shRapGEF2 or shRapGEF2-2) together with GFP plasmid. Representative E17 cortical sections were stained by GFP, CS-56 (a subplate marker) and TO-PRO3. Scale bar, 100 μm. The experiment was repeated for at least three times. (b) Magnified images of individual electroporated neurons with comparable GFP+ cell density in the intermediate zone after RapGEF2 knockdown. Asterisks indicate representative neurons in each group. Scale bar, 20 μm. (c) Quantification of the percentages of GFP+ neurons in different cortical layers. Error bars indicate the s.e.m. of five different brains containing >1,000 neurons. (d) Quantification of the percentages of neurons with uni- or bipolar morphology, no process and multiple (≥3) processes. Error bars indicate the s.e.m. of three different brains containing >120 neurons. *P<0.05, **P<0.01, ***P<0.001 versus pSUPER; Student’s t-test.
Figure 3
Figure 3. RapGEF2 is essential for multipolar–bipolar transition.
(a) E14 mouse brains were electroporated in utero using control (pSUPER) or RapGEF2 shRNA (shRapGEF2) together with GFP plasmid. Living cortical slices were prepared at E16 and the migratory behaviours of GFP+ neurons were imaged for 7 h. Red arrowheads, neurites extending from cell bodies. White arrowhead, swelling of leading process of a control neuron. Scale bar, 20 μm. (b) Quantification of the number of neurite extension and retraction events of GFP+ cells. Error bars indicate the s.e.m. of six different brains containing 20 GFP+ cells in each group. (c) Quantification of the neurite lifetime of GFP+ cells. Error bars indicate the s.e.m. of six different brains containing 20 GFP+ cells with >60 neurites in each group. (d) Percentage of GFP+ cells transiting to bipolar morphology in the imaging period. Error bars indicate the s.e.m. of six different brains containing >60 neurons. (e) Quantification of the migration speed of GFP+ cells. Error bars indicate the s.e.m. of six different brains containing 20 GFP+ cells. ***P<0.001 versus pSUPER; Student’s t-test.
Figure 4
Figure 4. RapGEF2 knockdown causes accumulation of ectopic neurons.
(a) E14 mouse brains were electroporated in utero using control (pSUPER) or RapGEF2 shRNA (shRapGEF2) together with GFP plasmid. Representative postnatal day (P) 2 cortical sections were stained for GFP, Cux1 (a layer II–IV neuron marker) and TO-PRO3. Arrows denote the heterotopic band of arrested neurons. Scale bar, 200 μm. The experiment was repeated for at least three times. (b) GFP+ neurons at higher magnification. Asterisks indicate representative neurons. Scale bar, 20 μm. (c) Quantification of the percentages of pSUPER- and RapGEF2 shRNA-electroporated neurons in different cortical layers. Error bars indicate the s.e.m. of five different brains containing >1,000 GFP+ cells. (d) Quantification of Cux1+ neurons. Error bars indicate s.e.m. More than 600 cells were analysed from three brains in each group. (e) P20 brain sections were stained for GFP, Cux1 and TO-PRO3. Scale bar, 200 μm. (f) Quantification of the percentages of GFP+ neurons in different cortical layers at P20. Error bars indicate the s.e.m. of five different brains containing >1,000 neurons. *P<0.05, **P<0.01, ***P<0.001 versus pSUPER; Student’s t-test.
Figure 5
Figure 5. Neuronal migration requires the Rap1 activity of RapGEF2.
(a) E14 cerebral cortices electroporated with vector control (pSUPER) or shRNAs targeting RapGEF2 or C3G (shRapGEF2 or shC3G) together with GFP plasmid, or shRapGEF2 plus C3G-expressing plasmids were examined at E17. Representative cortical sections at E17 were stained for GFP and TO-PRO3. Scale bar, 100 μm. The experiment was repeated for at least three times. (b) Quantification of the percentages of GFP+ neurons in different cortical layers. Error bars indicate the s.e.m. of four different brains containing >600 neurons. (c) Quantification of the percentages of neurons with uni- or bipolar morphology, no process and multiple (≥3) processes. Error bars indicate the s.e.m. of three different brains containing >120 neurons. **P<0.01, ***P<0.001 versus pSUPER; Student’s t-test. (d) Representative cerebral cortices at E17 electroporated with the indicated combinations of plasmids at E14 were stained for GFP and TO-PRO3. Scale bar, 100 μm. The experiment was repeated for at least three times. (e) Quantification of the percentages of GFP+ neurons in different cortical layers. Error bars indicate the s.e.m. of five different brains containing >1,000 neurons. (f) Quantification of the percentages of neurons with uni- or bipolar morphology, no process and multiple (≥3) processes. Error bars indicate the s.e.m. of three different brains containing >120 neurons. *P<0.05, **P<0.01, ***P<0.001 versus shRapGEF2+pCAG group; Student’s t-test.
Figure 6
Figure 6. RapGEF2 is an in vivo substrate of Cdk5/p35.
(a) Diagram of the domain structure of RapGEF2 protein. The phosphopeptide identified by the phosphoproteomic analysis is shown. The three proline-directed serine sites are highlighted. (b) Validation of p-RapGEF2 antibody in HEK293T cells. (c) Absence of RapGEF2 phosphorylation at Ser1124 from Cdk5-deficient cortices at E18. Actin served as the loading control. The experiment was repeated for at least three times. See full-length blots in Supplementary Fig. 10. (d) Spatial expression of p-RapGEF2 in the developing mouse cortex. Representative E15 cortical sections were co-stained for p-RapGEF2, Tuj1 and TO-PRO3. The experiment was repeated for at least three times. (e) Spatial expression of p35 in the developing mouse cortex. Representative E15 cortical sections were co-stained for p35, Tuj1 and TO-PRO3. The experiment was repeated for at least three times. (f) Wild-type or Cdk5-deficient cortical sections at E15 were stained for p-RapGEF2 and TO-PRO3. Scale bar, 100 μm (df).
Figure 7
Figure 7. RapGEF2 phosphorylation controls neuronal migration via Rap1.
(a) Pull-down assay of active Rap1 in the lysates of HEK293T cells expressing vector control (Con), wild type (WT), phosphodeficient (S1124A) or phosphomimetic (S1124E) mutants of RapGEF2 using GST-RalGDS-RBD. (b) Quantification of fold change of active Rap1 levels. Error bars indicate the s.e.m. of four independent experiments. *P<0.05 versus WT-expressing group; Student’s t-test. (c) Pull-down assay of active Rap1 in the cortical lysates from E18 Cdk5−/− mice and their corresponding wild-type littermates using GST-RalGDS-RBD. See full-length blots in Supplementary Fig. 10. (d) Quantification of fold change of active Rap1 levels. Error bars indicate the s.e.m. of three independent experiments. (e) Co-electroporation of E14 mouse brains was performed using RapGEF2 shRNA (shRapGEF2) together with control (pCAG) or the indicated RapGEF2-expressing plasmids (WT, S1124A or S1124E). E17 coronal cortical sections were stained for GFP and TO-PRO3. Scale bar, 100 μm. (f) Quantification of the percentages of GFP+ cells expressing control or different RapGEF2 constructs in different cortical layers at E17. Error bars indicate the s.e.m. of four different brains containing >600 neurons. (g) Quantification of the percentages of GFP+ neurons with uni- or bipolar morphology, no process and multiple (≥3) processes. Error bars indicate the s.e.m. of three different brains containing >120 neurons. *P<0.05, **P<0.01, ***P<0.001 versus shRapGEF2+pCAG group; Student’s t-test.
Figure 8
Figure 8. RapGEF2 phosphorylation regulates N-cadherin function.
(a) Immunostaining of GFP and endogenous N-cadherin in cultured cortical neurons. E14 mouse brains were co-electroporated in utero with vector control (pSUPER) or RapGEF2 shRNA (shRapGEF2) together with GFP plasmid. Cortical neurons from E16 electroporated cortex were cultured in vitro for 2 days and analysed by immunocytochemistry. (b) E16 brain sections electroporated with vector control (pSUPER) or RapGEF2 shRNA (shRapGEF2) together with pCAG-based N-cadherin probe (N-cadherin–HA) were immunostained for GFP and HA. (c) E16 brain sections electroporated with WT or phosphodeficient mutant (S1124A) of RapGEF2 plasmids together with N-cadherin–HA at E14 were immunostained for GFP and HA. Scale bars, 20 μm. The experiments were repeated for at least three times. (df) Quantification of the fluorescence intensity profiles of endogenous (d) and ectopically expressed (e,f) N-cadherin across the cell bodies of transfected neurons in the intermediate zone. The red fluorescence intensity across the representative neurons from a to b as indicated in the panels above was measured by ImageJ software. (g) Co-electroporation of E14 mouse brains with vector control (pCAG) or pCAG-based N-cadherin-expressing plasmid together with RapGEF2 shRNA (shRapGEF2) was performed. Representative E17 coronal cortices were stained for GFP and TO-PRO3. Scale bar, 100 μm. The experiment was repeated for at least three times. (h) Quantification of the percentages of GFP+ neurons in different cortical layers. Error bars indicate the s.e.m. of five different brains containing >800 neurons. (i) Quantification of the percentages of neurons with uni- or bipolar morphology, no process and multiple (≥3) processes. Error bars indicate the s.e.m. of three different brains containing >120 neurons. *P<0.05, **P<0.01, ***P<0.001 versus shRapGEF2+pCAG group; Student’s t-test.

References

    1. Nadarajah B., Brunstrom J. E., Grutzendler J., Wong R. O. & Pearlman A. L. Two modes of radial migration in early development of the cerebral cortex. Nat. Neurosci. 4, 143–150 (2001). - PubMed
    1. Tabata H. & Nakajima K. Multipolar migration: the third mode of radial neuronal migration in the developing cerebral cortex. J. Neurosci. 23, 9996–10001 (2003). - PMC - PubMed
    1. Noctor S. C., Martinez-Cerdeno V., Ivic L. & Kriegstein A. R. Cortical neurons arise in symmetric and asymmetric division zones and migrate through specific phases. Nat. Neurosci. 7, 136–144 (2004). - PubMed
    1. LoTurco J. J. & Bai J. The multipolar stage and disruptions in neuronal migration. Trends Neurosci. 29, 407–413 (2006). - PubMed
    1. Kerjan G. & Gleeson J. G. Genetic mechanisms underlying abnormal neuronal migration in classical lissencephaly. Trends Genet. 23, 623–630 (2007). - PubMed

Publication types

MeSH terms