

A comparison of temporal trends in United States autism prevalence to trends in suspected environmental factors
- PMID: 25189402
- PMCID: PMC4177682
- DOI: 10.1186/1476-069X-13-73
A comparison of temporal trends in United States autism prevalence to trends in suspected environmental factors
Abstract
Background: The prevalence of diagnosed autism has increased rapidly over the last several decades among U.S. children. Environmental factors are thought to be driving this increase and a list of the top ten suspected environmental toxins was published recently.
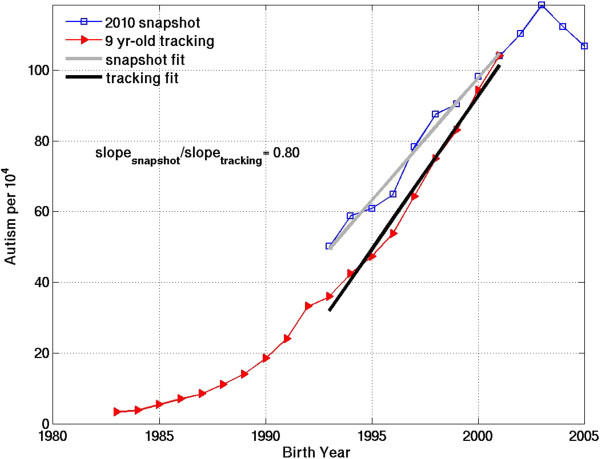
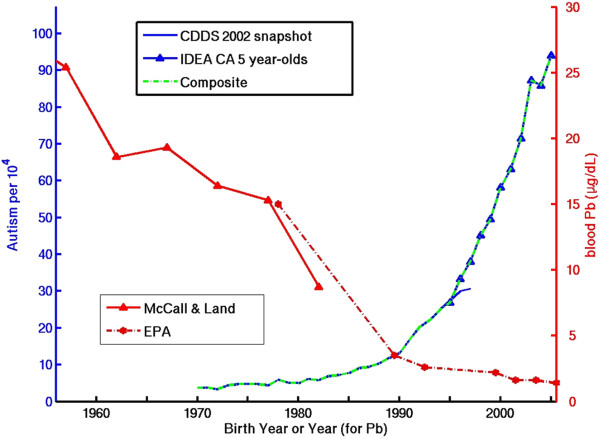
Methods: Temporal trends in autism for birth years 1970-2005 were derived from a combination of data from the California Department of Developmental Services (CDDS) and the United States Individuals with Disabilities Education Act (IDEA). Temporal trends in suspected toxins were derived from data compiled during an extensive literature survey. Toxin and autism trends were compared by visual inspection and computed correlation coefficients. Using IDEA data, autism prevalence vs. birth year trends were calculated independently from snapshots of data from the most recent annual report, and by tracking prevalence at a constant age over many years of reports. The ratio of the snapshot:tracking trend slopes was used to estimate the "real" fraction of the increase in autism.
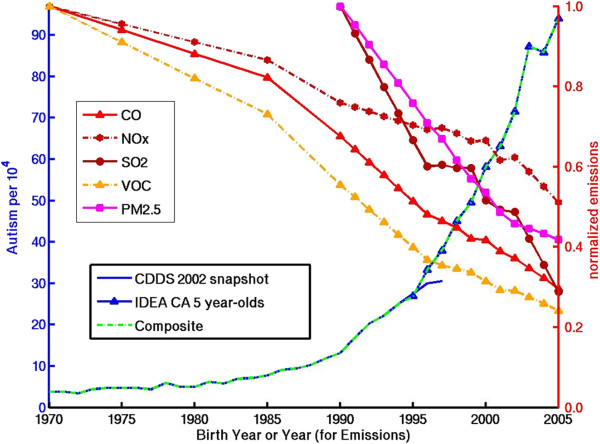
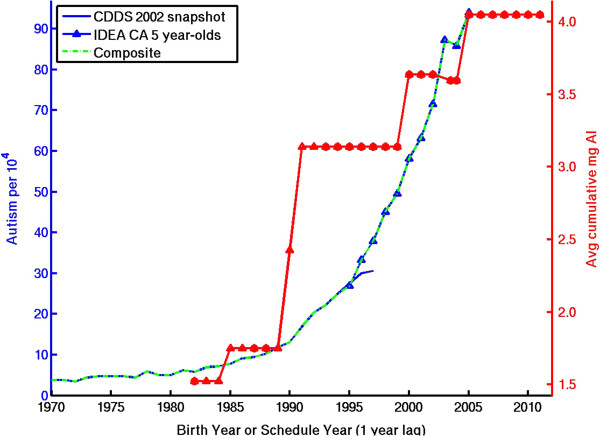
Results: The CDDS and IDEA data sets are qualitatively consistent in suggesting a strong increase in autism prevalence over recent decades. The quantitative comparison of IDEA snapshot and constant-age tracking trend slopes suggests that ~75-80% of the tracked increase in autism since 1988 is due to an actual increase in the disorder rather than to changing diagnostic criteria. Most of the suspected environmental toxins examined have flat or decreasing temporal trends that correlate poorly to the rise in autism. Some, including lead, organochlorine pesticides and vehicular emissions, have strongly decreasing trends. Among the suspected toxins surveyed, polybrominated diphenyl ethers, aluminum adjuvants, and the herbicide glyphosate have increasing trends that correlate positively to the rise in autism.
Conclusions: Diagnosed autism prevalence has risen dramatically in the U.S over the last several decades and continued to trend upward as of birth year 2005. The increase is mainly real and has occurred mostly since the late 1980s. In contrast, children's exposure to most of the top ten toxic compounds has remained flat or decreased over this same time frame. Environmental factors with increasing temporal trends can help suggest hypotheses for drivers of autism that merit further investigation.
Figures


References
-
- Kanner L. Autistic Disturbances of Affective Contact. Nervous Child. 1943;2:217–250. - PubMed
-
- Centers for Disease Control and Prevention Prevalence of autism spectrum disorder among children aged 8 years -autism and developmental disabilities monitoring network, 11 sites, United States, 2010. MMWR Surveill Summ. 2014;63(Suppl2):1–21. - PubMed
-
- Grinker RR. Unstrange Minds: Remapping the World of Autism. Cambridge, MA: Basic Books; 2007.
Publication types
MeSH terms
Substances
LinkOut - more resources
Full Text Sources
Other Literature Sources
