. 2014 Oct 15;74(20):5903-13.
doi: 10.1158/0008-5472.CAN-14-0527. Epub 2014 Sep 4.

MYC activates stem-like cell potential in hepatocarcinoma by a p53-dependent mechanism

Affiliations

MYC activates stem-like cell potential in hepatocarcinoma by a p53-dependent mechanism

Hirofumi Akita et al. Cancer Res. .

Abstract

Activation of c-MYC is an oncogenic hallmark of many cancers, including liver cancer, and is associated with a variety of adverse prognostic characteristics. Despite a causative role during malignant transformation and progression in hepatocarcinogenesis, consequences of c-MYC activation for the biology of hepatic cancer stem cells (CSC) are undefined. Here, distinct levels of c-MYC overexpression were established by using two dose-dependent tetracycline-inducible systems in four hepatoma cell lines with different p53 mutational status. The CSCs were evaluated using side population (SP) approach as well as standard in vitro and in vivo assays. Functional repression of p53 was achieved by lentiviral shRNA transduction. The results show that c-MYC expression levels have a differential impact on liver CSC characteristics. At low levels, c-MYC activation led to increased proliferation and enhanced CSC properties including activation of reprogramming transcription factors and CSC marker expression (e.g., NANOG, OCT4, and EpCAM), expansion of SP, and acceleration of tumor growth upon subcutaneous transplantation into immunocompromised mice. However, when exceeding a threshold level, c-MYC induced a proapoptotic program and loss of CSC potential both in vitro and in vivo. Mechanistically, c-MYC-induced self-renewal capacity of liver cancer cells was exerted in a p53-dependent manner. Low c-MYC activation increased spheroid formation in p53-deficient tumor cells, whereas p53-dependent effects were blunted in the absence of c-MYC overexpression. Together, our results confirm the role of c-MYC as a master regulator during hepatocarcinogenesis and establish a new gatekeeper role for p53 in repressing c-MYC-induced CSC phenotype in liver cancer cells.


Conflict of interest statement

Disclosure of Potential Conflicts of Interest: No potential conflicts of interests were disclosed.

Figures

Figure 1
Figure 1
Tet-On system for controlled c-MYC expression in hepatoma cell lines. A, Schematic diagram of the constructs used in the study. Lenti Tet-On particles were tagged with EGFP, and retro Tet-On particles were tagged with the neomycin resistant gene as selection markers. Lenti TRE c-MYC expression particles were tagged to mCherry activated by doxycycline (Dox) and used for confocal analysis. B-C, dose-dependent Dox induction of c-MYC expression in HepG2, Huh7, PLC, and Hep3B cells cultured in the presence of the indicated Dox concentrations for 2 days as determined by RT-PCR analysis of c-MYC mRNA (B) and imunoblotting of c-MYC and pMYC proteins (C). D, representative immunofluorescence images of Dox-controlled expression of mCherry and c-MYC in HepG2 cells 2 days after Dox exposure. The intensity of the mCherry fluorescence reflects the differences in c-MYC activation. Nuclei counterstained with DAPI. Scale bar, 50 μM.
Figure 2
Figure 2
The dose-dependent effects of c-MYC induction on the growth properties of hepatoma cells. A, representative images of Ki67 immunofluorescence and B, representative images of TUNEL immunofluorescence and doxycycline (Dox)-controlled mCherry marker expression in HepG2 cells cultured in the presence of indicated Dox concentrations for 4 days. Nuclei counterstained with DAPI. Scale bar, 50 μm. C, D, quantification of Ki67-positive cells (C) and TUNEL-positive (D) cells in HepG2. Shown are means ± SEM. ***P < 0.001 versus untreated cells. E, imunoblotting of indicated proteins. Actin used as a loading control. F, effect of c-MYC activation on the growth rate. Shown are means ± SD. ***P < 0.001 versus untreated cells.
Figure 3
Figure 3
The doxycycline (Dox) dose-dependent effects of c-MYC induction on CSC properties. A, analysis of side population (SP) by flow cytometry in HepG2 cells. SP cells were identified by Hoechst 33342 staining. Fumitremorgin (FMT) was used to set up the SP gate (shown in red). Cells were cultured in the presence of various Dox concentrations for 7 days. B, imunoblotting of stemness-related proteins in HepG2 and Huh7 cells. Actin used as a loading control. C, representative images of NANOG immunofluorescence and Dox-controlled mCherry marker expression in HepG2 cells cultured in the presence of indicated Dox concentrations for one week. Nuclei counterstained with DAPI. Scale bar, 50 μm. D, analysis of sphere forming potential. Shown are representative light microscopy images. Scale bar, 1000 μm (top), 500 μm (bottom). E, sphere frequency and F) sphere size. Data are means ± SD determined in 10 wells for each condition for one out of three independent experiments. Sphere size was determined by NIH ImageJ 1.30 (NIH, Bethesda, MD). *, P < 0.05; **, P < 0.01; ***, P < 0.001.
Figure 4
Figure 4
The dose-dependent effects of c-MYC induction on self-renewal. A, representative light microscopy images of HepG2 spheres at passages P1-P5. Scale bar, 500 μm. The sphere frequency and sphere size were increasing upon low levels of c-MYC activation and decreasing upon high levels of c-MYC activation along the sphere passaging. B, sphere number. C, sphere size. Data are means ± SD determined in 12 wells for one of three independent experiments.*, P < 0.05; **, P < 0.01; ***, P < 0.001. D, representative images of Dox-controlled mCherry marker expression in spheres at passage 5. Scale bar, 200 μm.
Figure 5
Figure 5
c-MYC switch-on and switch-off effects on self-renewal. A, experimental set-up and representative images of HepG2 spheres at passages P1-P5. The P1 spheres were untreated (condition I) or grown in the presence of 0.01 ng/ml of doxycycline (Dox) (condition IV)) to achieve an optimal level of c-MYC activation. During the subsequent sphere passaging (P2-P5), the growth conditions either remained the same (I and IV) or switched to the presence (condition II) or absence (condition III) of Dox. B, Kinetic changes in sphere frequency during c-MYC switch-on and switch-off activation. Data are means ± SD determined in 12 wells for one of three independent experiments. Scale bar, 200 μm.
Figure 6
Figure 6
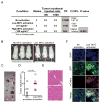
Effects of doxycyclin-controlled c-MYC induction on xenograft tumor growth in NOD/SCID mice. A, limiting dilution analysis. HepG2 cells cultured for one week in the presence or absence of varying concentrations of Dox were injected subcutaneously in the lower flanks of NOD/SCID mice. Drinking water was supplemented with 10 ng/ml and 100 ng/ml of doxycycline to maintain low and high levels of c-MYC activation. The frequency of tumor-initiating cells (TIF) and confidence intervals (CI95%) were calculated based on the number of resulting tumors per injection sites after 8 weeks. B, gross images of tumor bearing mice from control “No Myc activation” group (a) and “Low MYC activation” group (b). C, gross images of dissected tumors. D, tumor volume. E, representative H&E staining on paraffin-embedded tumor sections. Scale bar, 50 μm F, representative immunofluorescence images of GFP and mCherry marker expression. mCherry marker expression was detected only in tumors with low c-MYC activation.
Figure 7
Figure 7
p53 knockdown changes CSC properties in HepG2 cells with inducible c-MYC. A, B, depletion of p53 mRNA (A) and p53 protein (B) after a stable lentiviral transduction of p53 shRNA. C, immunoblotting of indicated proteins. D, representative light microscopy images of P1-P5 spheres formed by cells transduced with scrambled (left panels) or p53 shRNAs (right panels) and cultured in the absence or presence of 0.01 ng/ml of doxycycline (Dox) to achieve an optimal level of c-MYC activation. Scale bars, 200 μm. E, Changes in sphere frequency at passages P1-P3 in 3D cultures grown in the absence and presence of 0.01 ng/ml Dox to achieve an optimal level of c-MYC activation. Data are means ± SD determined in 12 wells for one of three independent experiments. The self-renewal was steadily increasing only in p53 knockdown HepG2 cultures with low levels of c-MYC activation.

References

    1. Jordan CT, Guzman ML, Noble M. Cancer stem cells. N Engl J Med. 2006;355:1253–61. - PubMed
    1. Haraguchi N, Ishii H, Mimori K, Tanaka F, Ohkuma M, Kim HM, et al. CD13 is a therapeutic target in human liver cancer stem cells. J Clin Invest. 2010;120:3326–39. - PMC - PubMed
    1. Marquardt JU, Raggi C, Andersen JB, Seo D, Avital I, Geller D, et al. Human hepatic cancer stem cells are characterized by common stemness traits and diverse oncogenic pathways. Hepatology. 2011;54:1031–42. - PMC - PubMed
    1. Eilers M, Eisenman RN. Myc's broad reach. Genes Dev. 2008;22:2755–66. - PMC - PubMed
    1. Cairo S, Wang Y, de Reynies A, Duroure K, Dahan J, Redon MJ, et al. Stem cell-like micro-RNA signature driven by Myc in aggressive liver cancer. Proc Natl Acad Sci U S A. 2010;107:20471–6. - PMC - PubMed

Publication types