Consuming foods with added oligofructose improves stool frequency: a randomised trial in healthy young adults
- PMID: 25191615
- PMCID: PMC4153283
- DOI: 10.1017/jns.2014.6
Consuming foods with added oligofructose improves stool frequency: a randomised trial in healthy young adults
Abstract
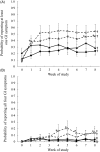
The impact of oligofructose (OF) intake on stool frequency has not been clearly substantiated, while significant gastrointestinal (GI) symptoms have been reported in some individuals. The aim of the present study was to determine the effects of OF on stool frequency and GI symptoms in healthy adults. In an 8-week, randomised, double-blind, parallel-arm study, ninety-eight participants were provided with 16 g OF in yogurt and snack bars (twenty male and thirty female) or matching control foods (seventeen male and thirty-one female), to incorporate, by replacement, into their usual diets. Participants completed a daily online questionnaire recording stool frequency and rating four symptoms: bloating, flatulence, abdominal cramping and noise, each on a Likert scale from '0' for none (no symptoms) to '6' for very severe, with a maximum symptom intensity score of 24 (sum of severities from all four symptoms). Online 24 h dietary recalls were completed during pre-baseline and weeks 4, 6 and 8 to determine fibre intake. When provided with OF foods, fibre intake increased to 24·3 (sem 0·5) g/d from pre-baseline (12·1 (sem 0·5) g/d; P < 0·001). Stool frequency increased with OF from 1·3 (sem 0·2) to 1·8 (sem 0·2) stools per d in males and 1·0 (sem 0·1) to 1·4 (sem 0·1) stools per d in females during intervention weeks compared with pre-baseline (P < 0·05),but did not change for control participants (males: 1·6 (sem 0·2) to 1·8 (sem 0·2); females: 1·3 (sem 0·1) to 1·4 (sem 0·1)). Flatulence was the most commonly reported symptom. Mean GI symptom intensity score was higher for the OF group (3·2 (sem 0·3)) v. control (1·7 (sem 0·1)) (P < 0·01), with few participants reporting above moderate symptoms. No change in symptom intensity occurred over time. Consuming yogurt and snack bars with 16 g OF improves regularity in young healthy adults. However, GI symptoms, resulting from an increase in oligofructose intake, may not diminish with time.
Keywords: Fibre; Gastrointestinal symptoms; Oligofructose; Stool frequency.
Figures


 ,
total fibre (control);
  , food fibre (intervention);
  ,
total fibre (intervention). Values are means, with standard errors represented by
vertical bars. a,b,c,d Mean values with unlike letters were significantly
different (P < 0·01).


References
-
- United States Department of Agriculture, Agricultural Research Service (2006) What We Eat in America, National Health and Nutrition Examination Survey (NHANES) 2003–2006. http://www.ars.usda.gov/SP2UserFiles/Place/12355000/pdf/0506/usual_nutri... (accessed February 2013).
-
- Institute of Medicine, Food and Nutrition Board (2005) Dietary Reference Intakes for Energy, Carbohydrate, Fiber, Fat, Fatty Acids, Cholesterol, Protein, and Amino Acids, pp. 339–421 Washington, DC: The National Academies Press
-
- Jamshee N, Lee Z-E & Olden KW (2011) Diagnostic approach to chronic constipation in adults. Am Fam Physician 84, 299–306 - PubMed
-
- Fungwe TV, Bente L & Hiza H (2007) The Food Supply and Dietary Fiber: Its Availability and Effect on Health: Nutrition Insight 36. Alexandria, VA: USDA Center for Nutrition Policy and Promotion
LinkOut - more resources
Full Text Sources
Other Literature Sources
Research Materials

