Review
. 2014 Aug 19:4:210.
doi: 10.3389/fonc.2014.00210. eCollection 2014.

Radioembolization of hepatic lesions from a radiobiology and dosimetric perspective

Affiliations
Review

Radioembolization of hepatic lesions from a radiobiology and dosimetric perspective

Marta Cremonesi et al. Front Oncol. .

Abstract

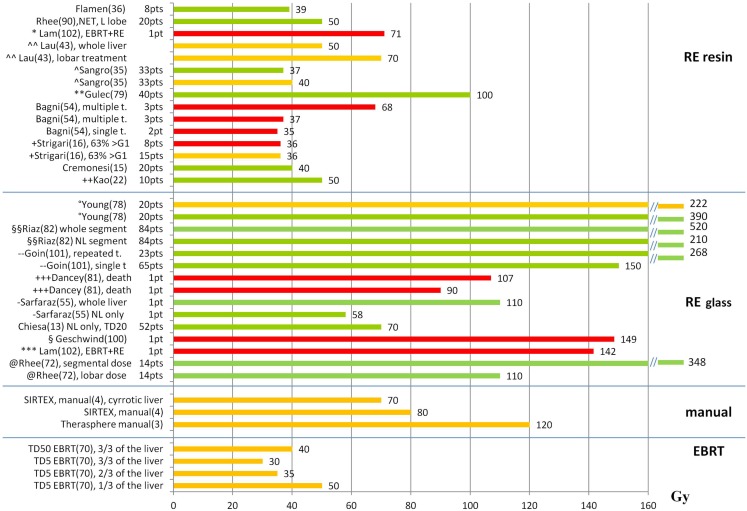
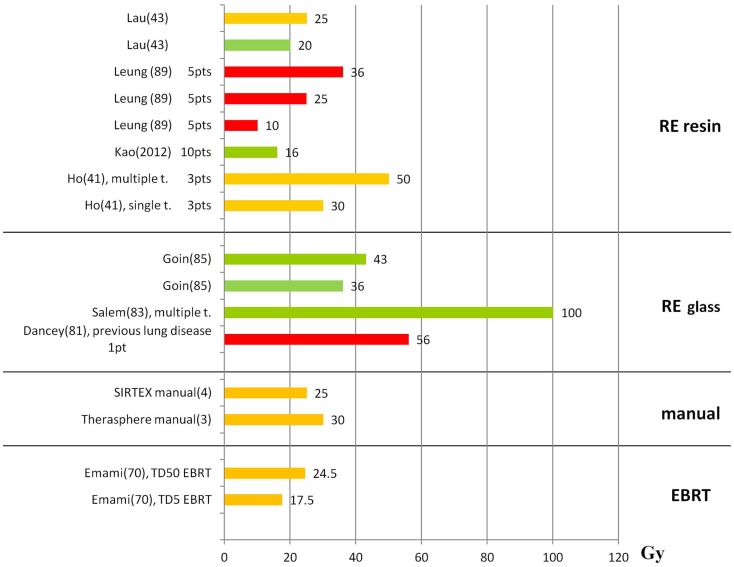
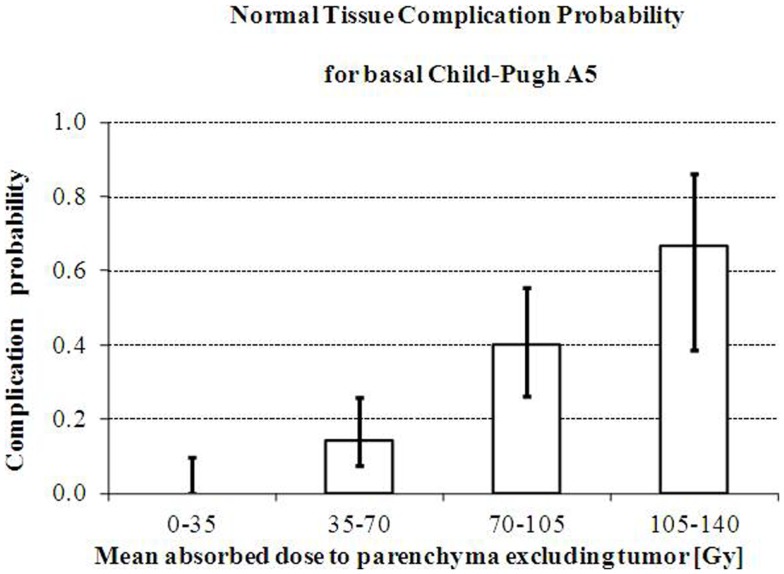
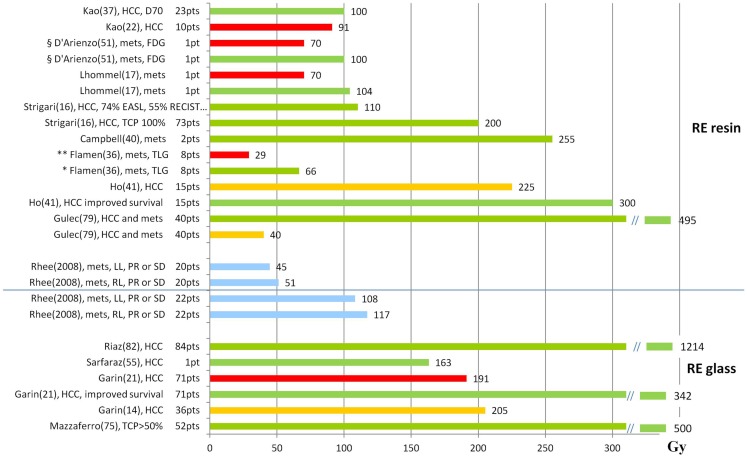
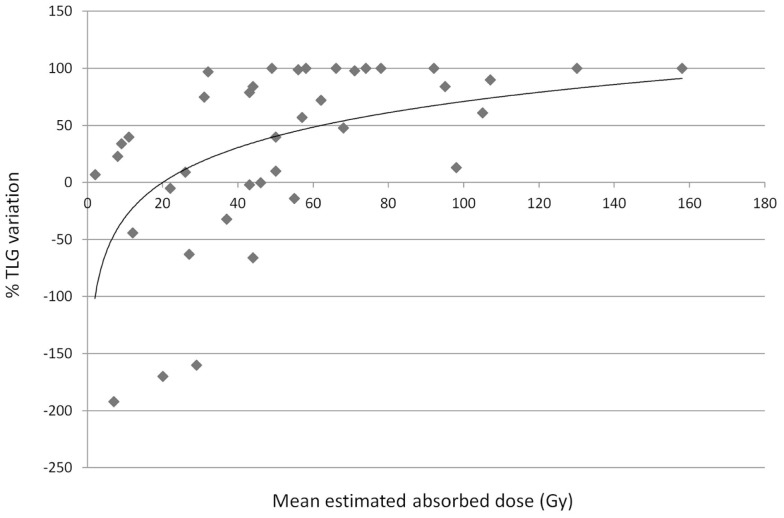
Radioembolization (RE) of liver cancer with (90)Y-microspheres has been applied in the last two decades with notable responses and acceptable toxicity. Two types of microspheres are available, glass and resin, the main difference being the activity/sphere. Generally, administered activities are established by empirical methods and differ for the two types. Treatment planning based on dosimetry is a prerogative of few centers, but has notably gained interest, with evidence of predictive power of dosimetry on toxicity, lesion response, and overall survival (OS). Radiobiological correlations between absorbed doses and toxicity to organs at risk, and tumor response, have been obtained in many clinical studies. Dosimetry methods have evolved from the macroscopic approach at the organ level to voxel analysis, providing absorbed dose spatial distributions and dose-volume histograms (DVH). The well-known effects of the external beam radiation therapy (EBRT), such as the volume effect, underlying disease influence, cumulative damage in parallel organs, and different tolerability of re-treatment, have been observed also in RE, identifying in EBRT a foremost reference to compare with. The radiobiological models - normal tissue complication probability and tumor control probability - and/or the style (DVH concepts) used in EBRT are introduced in RE. Moreover, attention has been paid to the intrinsic different activity distribution of resin and glass spheres at the microscopic scale, with dosimetric and radiobiological consequences. Dedicated studies and mathematical models have developed this issue and explain some clinical evidences, e.g., the shift of dose to higher toxicity thresholds using glass as compared to resin spheres. This paper offers a comprehensive review of the literature incident to dosimetry and radiobiological issues in RE, with the aim to summarize the results and to identify the most useful methods and information that should accompany future studies.

Keywords: 90Y-microspheres; dosimetry; liver tumors; radiobiology; radioembolization.


Figures

Figure 1
Figure 1
Liver absorbed doses (Gy) and tolerability. The graph shows the liver absorbed doses (Gy) reported in the literature with information about the associated liver tolerability. Red bars represent liver toxicity with fatal event (death); orange bars represent the threshold for observed toxicity or the limit recommended by the author; green bars represent tolerated absorbed doses. References are reported in parenthesis after the name of the first author. t., treatment; *(77) patient with previous EBRT (21 Gy) and RE with 71 Gy, ∧∧(42) recommendation based on a review of the literature, (59) primary + mets, WL treatment, **(78) primary + mets, WL treatment, + (16) HCC, WL (48%) and L (52%), mean dose to WL for REILD > G1: 6–78 Gy. The bar represents the median value of the interval (36 Gy), ++(22) WL treatment,°(79) O-I, HCC, multiple treatments, §§(80) HCC, segmental treatments, - -(81) HCC, WL, and lobar treatments. No use of REILD toxicity score, +++(82) HCC, 9 O-I, 11 O-II, no distinction between tumor and NL dose, -(54) mean NL dose = 58 Gy, §(83) patient receiving RE to the right lobe (139 Gy) and the left lobe (158 Gy). The bar represents the mean value between the right and left lobe, ***(77) patient with previous EBRT (23 Gy) and RE to the right (111 Gy) and the left (172 Gy) lobe. The bar represents the mean value between the right and left lobe, @(84) HCC, segmental treatments, superselective
Figure 2
Figure 2
Lung absorbed doses (Gy) and tolerability. The graph shows the lung absorbed doses (Gy) reported in the literature, with information about the associated lung tolerability. The absorbed doses taken from the literature are reported although these are derived without including the attenuation correction. Absorbed dose values should be rescaled by an average factor of 0.6 (12). Red bars represent radiation-induced pneumonitis leading to death; orange bars represent the threshold for observed radiation-induced pneumonitis or the limit recommended by the author; green bars represent tolerated absorbed doses. The references are reported in parenthesis after the name of the first author.
Figure 3
Figure 3
Increase of risk of liver decompensation with mean absorbed dose. Increase of the observed risk of liver decompensation with whole parenchyma mean absorbed dose in intermediate/advanced HCC patients with Basal Child-Pugh A5 treated with glass microspheres. Reprinted with permission by Minerva Medica from Quarterly Journal of Nuclear Medicine Molecular Imaging (13).
Figure 4
Figure 4
Tumor absorbed doses (Gy) and response. The graph shows the T absorbed doses (Gy) reported in the literature, with information about the associated response. Red bars represent progression, orange bars represent the threshold for response, green bars observed response, and blue bars specifically indicate PR (partial response) or SD (stable disease). References are reported in parenthesis after the name of the first author. mets, metastases; *response evaluation based on the variation of TLG in FDG examinations; **non-responders based on the variation of TLG in FDG examinations; §response evaluated based on the variation of SUV in FDG examinations.
Figure 5
Figure 5
Tumor response related to variation of the TLG with absorbed doses (Gy). T response by means of the TLG variation in FDG-PET examinations versus T absorbed dose. Regression analysis (R2 = 0.26). Errata corrige of previously published data by Flamen et al. (35). Data provided by the authors, personal communication.

Similar articles

Cited by

References

    1. Gulec SA, Sztejnberg ML, Siegel JA, Jevremovic T, Stabin M. Hepatic structural dosimetry in (90)Y microsphere treatment: a Monte Carlo modeling approach based on lobular microanatomy. J Nucl Med (2010) 51:301–1010.2967/jnumed.109.069278 - DOI - PubMed
    1. Spreafico C, Maccauro M, Mazzaferro V, Chiesa C. The dosimetric importance of the number of 90Y microspheres in liver transarterial radioembolization (TARE). Eur J Nucl Med Mol Imaging (2014) 41:634–810.1007/s00259-013-2674-6 - DOI - PubMed
    1. Therasphere® by BTG (http://www.therasphere.com). Available from: http://www.therasphere.com/physicians-package-insert/package-insert-eu-e...
    1. SIR-Spheres Yttrium-90 Microspheres [Package Insert] Lane Cove: Sirtex Medical; (2004). Available from: http://www.sirtex.com/files/US20Package20Insert1.pdf
    1. Riaz A, Lewandowski RJ, Kulik LM, Mulcahy MF, Sato KT, Ryu RK, et al. Complications following radioembolization with yttrium-90 microspheres: a comprehensive literature review. J Vasc Interv Radiol (2009) 20:1121–3010.1016/j.jvir.2009.05.030 - DOI - PubMed