. 2014 Oct 15;190(8):930-7.
doi: 10.1164/rccm.201404-0783OC.

Enhanced upper-airway muscle responsiveness is a distinct feature of overweight/obese individuals without sleep apnea

Affiliations

Enhanced upper-airway muscle responsiveness is a distinct feature of overweight/obese individuals without sleep apnea

Scott A Sands et al. Am J Respir Crit Care Med. .

Abstract

Rationale: Body habitus is a major determinant of obstructive sleep apnea (OSA). However, many individuals do not have OSA despite being overweight/obese (body mass index > 25 kg/m(2)) for reasons that are not fully elucidated.

Objectives: To determine the key physiologic traits (upper-airway anatomy/collapsibility, upper-airway muscle responsiveness, chemoreflex control of ventilation, arousability from sleep) responsible for the absence of OSA in overweight/obese individuals.

Methods: We compared key physiologic traits in 18 overweight/obese subjects without apnea (apnea-hypopnea index < 15 events per hour) with 25 overweight/obese matched patients with OSA (apnea-hypopnea index ≥ 15 events per hour) and 11 normal-weight nonapneic control subjects. Traits were measured by repeatedly lowering continuous positive airway pressure to subtherapeutic levels for 3 minutes during non-REM sleep.

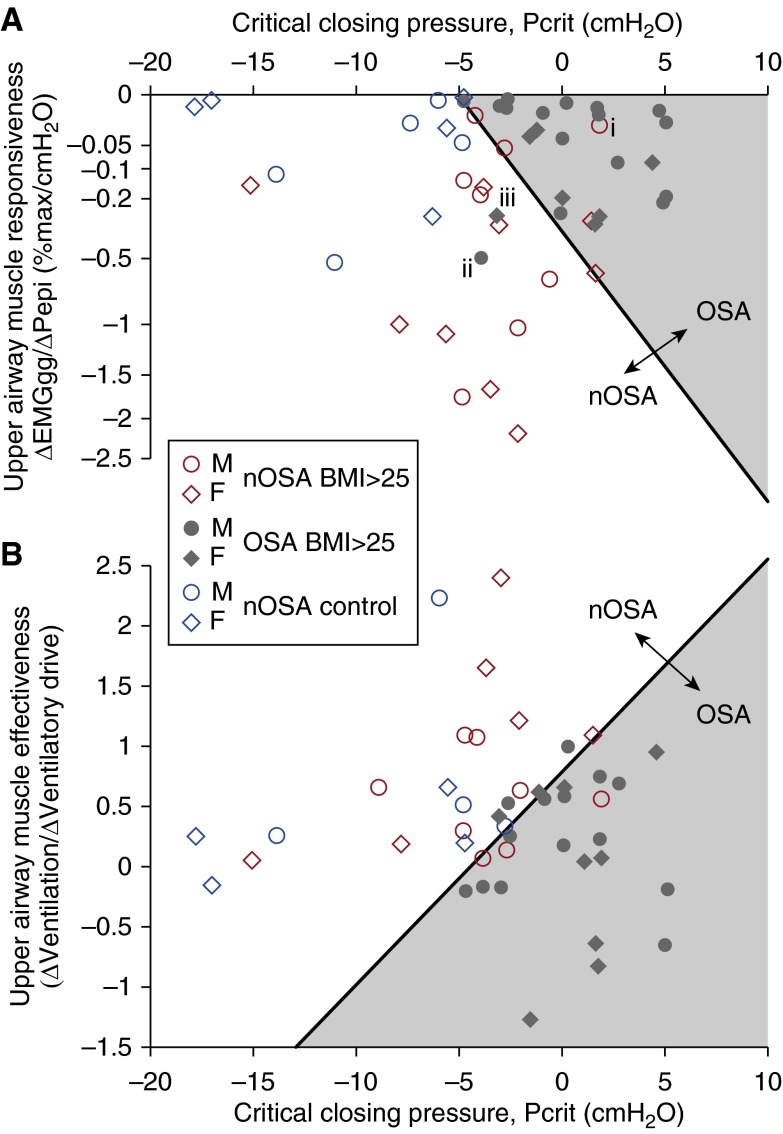
Measurements and main results: Overweight/obese subjects without apnea exhibited a less collapsible airway than overweight/obese patients with apnea (critical closing pressure: -3.7 ± 1.9 vs. 0.6 ± 1.2 cm H2O; P = 0.003; mean ± 95% confidence interval), but a more collapsible airway relative to normal-weight control subjects (-8.8 ± 3.1 cm H2O; P < 0.001). Notably, overweight/obese subjects without apnea exhibited a threefold greater upper-airway muscle responsiveness than both overweight/obese patients with apnea (Δgenioglossus EMG/Δepiglottic pressure: -0.49 [-0.22 to -0.79] vs. -0.15 [-0.09 to -0.22] %max/cm H2O; P = 0.008; mean [95% confidence interval]) and normal-weight control subjects (-0.16 [-0.04 to -0.30] %max/cm H2O; P = 0.02). Loop gain was elevated (more negative) in both overweight/obese groups and normal-weight control subjects (P = 0.02). Model-based analysis demonstrated that overweight/obese individuals without apnea rely on both more favorable anatomy and collapsibility and enhanced upper-airway dilator muscle responses to avoid OSA.

Conclusions: Overweight/obese individuals without apnea have a moderately compromised upper-airway structure that is mitigated by highly responsive upper-airway dilator muscles to avoid OSA. Elucidating the mechanisms underlying enhanced muscle responses in this population may provide clues for novel OSA interventions.

Keywords: apnea phenotypes; control of breathing; mathematical model; obesity; upper airway muscles.


Figures

Figure 1.
Figure 1.
Physiologic differences between overweight/obese nonapneic individuals (nOSA BMI > 25), overweight/obese patients with OSA (OSA BMI > 25), and normal-weight control subjects (nOSA control). (A) The upper airway is less collapsible (Pcrit is lower) in overweight/obese nOSA versus overweight/obese OSA, but is more collapsible than normal-weight control subjects. (B) Upper-airway dilator muscles are markedly more responsive in overweight/obese nOSA compared with both overweight/obese OSA and normal-weight control subjects. Responsiveness is defined as the genioglossus electromyogram (EMGgg) response to negative epiglottic pressure, ∆EMGgg/∆Pepi (EMGgg is reported relative to maximum achievable activity). (C) Loop gain is elevated (more negative) in both overweight/obese groups versus nOSA control subjects. (D) Overweight/obese nOSA individuals exhibit a similar arousal threshold to nOSA control subjects. The arousal threshold is elevated (more negative) in OSA versus nOSA control subjects. Men and women are denoted by circles and diamonds, respectively. Mean data are illustrated by horizontal bars. Data in B and D were square-root transformed before statistical analysis to achieve normally distributed data; these data are plotted on a square-root scale. Data in C were log-transformed before statistical analysis; these data are plotted on a logarithmic scale. One-way analysis of variance with Student-Newman-Keuls post hoc analysis were used to compare groups. Measures of upper-airway responsiveness could be made in 17 of 18 (nOSA BMI > 25), 23 of 25 (OSA BMI > 25), and 10 of 11 (nOSA control) individuals. Measures of loop gain could be made in 14 of 18 (nOSA BMI > 25), 23 of 25 (OSA BMI > 25), and 8 of 11 (nOSA control) individuals. BMI = body mass index; OSA = obstructive sleep apnea; Pcrit = critical closing pressure.
Figure 2.
Figure 2.
Upper-airway muscle effectiveness (upper-airway gain) is threefold greater in overweight/obese individuals without apnea (nOSA BMI > 25) versus overweight/obese patients with OSA (OSA BMI > 25). Data from normal-weight control subjects (nOSA control) are shown for comparison. Median data are illustrated by horizontal bars. Men and women are denoted by circles and diamonds, respectively. Measures of upper-airway muscle effectiveness could be made in only 14 of 18 (nOSA BMI > 25), 23 of 25 (OSA BMI > 25), and 8 of 11 (nOSA control) individuals because of difficulties measuring loop gain. Groups were compared using one-way analysis of variance on ranks with Dunn post hoc analysis. BMI = body mass index; OSA = obstructive sleep apnea.
Figure 3.
Figure 3.
Combining the four physiologic traits graphically using a mathematical model illustrates how they interact to manifest the absence or presence of obstructive sleep apnea (OSA). (A–C) Group data are shown for each trait measured in units of ventilation. Veupnea is the ventilation on optimal continuous positive airway pressure. Vpassive is the functional anatomy/collapsibility represented as the ventilation off continuous positive airway pressure at normal ventilatory drive. The upper-airway gain line describes the functional compensatory increase in ventilation with increased ventilatory drive (which activates upper-airway muscles); this line indicates the achievable ventilation. The loop gain line illustrates the level of ventilatory drive that will eventually develop for any reduction in ventilation (e.g., because of rising carbon dioxide). If these diagonal lines intersect at a level of ventilatory drive below the arousal threshold (vertical dashed line) then stable breathing is possible during sleep; otherwise, OSA should occur. (A) On average, the physiologic traits of overweight/obese subjects without apnea (nOSA) are consistent with stable breathing: Note that the upper airway is so effective (steep slope of upper-airway gain line) that stable breathing occurs (intersection of diagonal lines before the arousal threshold), despite a moderately compromised anatomy. The maximum ventilation achievable without arousal (Vactive) marginally exceeds the minimum level of ventilation that can be tolerated without arousal (Varousal). (B) The traits of overweight/obese patients with apnea are consistent with OSA. Stable breathing is not possible because the achievable ventilation (Vactive) is below the level needed to prevent arousal (Varousal). (C) The traits of healthy normal-weight control subjects are consistent with stable breathing. The favorable anatomy provides for stable breathing regardless of their modest upper-airway responsiveness (the slope is no steeper than in OSA). (D) Ultimately, the “gap” (Varousal − Vactive) predicts whether OSA will occur (mean data are illustrated by horizontal bars). In OSA, the “gap” is positive and significantly greater than in overweight/obese subjects without apnea (analysis of variance), in whom the gap is negative. Men and women are denoted by circles and diamonds, respectively. Of note, measures of the “gap” could be made in 14 of 18 (nOSA BMI > 25), 23 of 25 (OSA BMI > 25), and 8 of 11 (nOSA control) individuals because of difficulties measuring loop gain. Vactive = Vpassive + (upper-airway gain) × (arousal threshold − 100). Varousal = 100 − (loop gain)−1 × (arousal threshold − 100). BMI = body mass index.
Figure 4.
Figure 4.
Essential roles of the greater upper-airway muscle responsiveness and reduced upper-airway collapsibility in overweight/obese subjects without apnea versus patients with apnea. The physiologic traits of subjects without apnea are combined mathematically (Figure 3A) to illustrate why stable breathing is possible without arousal from sleep in overweight/obese individuals without obstructive sleep apnea (OSA); note that the intersection of the loop gain line and upper-airway gain line (stable breathing point) lies to the left of the arousal threshold (dashed vertical line). (A) If overweight/obese subjects without apnea had the upper-airway effectiveness (or “gain”) of the OSA group (*upper-airway gain; solid line) then the maximum achievable ventilation during non-REM sleep (Vactive) would instead be below the minimum tolerable ventilation (Varousal), providing a physiologic “gap” (+16% of Veupnea) that cannot be overcome without arousal. Hence, the effective upper-airway muscle response in subjects without apnea can be considered essential for the observed absence of OSA. (B) A similar result is observed for the anatomy/collapsibility. If Vpassive is reduced to the level of the OSA group (by 22% of eupneic ventilation; difference in mean values), the gap would be become positive (+11% of Veupnea) such that OSA would occur. Thus the less-vulnerable anatomy (higher Vpassive) in overweight/obese subjects without apnea is also essential for their avoidance of OSA.
Figure 5.
Figure 5.
Upper airway collapsibility (Pcrit) and upper airway dilator muscle behavior determine the presence or absence of obstructive sleep apnea (OSA). (A) Upper airway responsiveness and Pcrit. (B) Upper airway effectiveness (upper airway gain) and Pcrit. Lines based on logistic regression illustrate the boundary between overweight/obese patients with OSA and overweight/obese individuals without OSA. Individuals with more collapsible airways require the most responsive and effective upper airway muscles to avoid OSA. Three outliers are labeled in A: (i) one individual had minimal responsiveness but avoided OSA likely because of a moderate upper airway effectiveness (+0.6) and very low loop gain (−2), two individuals with good responsiveness developed OSA likely caused by (ii) a poor upper airway muscle effectiveness (−0.2) and elevated loop gain (−6), and (iii) a low arousal threshold (−8 cm H2O). Upper airway responsiveness data were square-root transformed to achieve normally distributed data; these data are shown on a square-root scale. Regression models: (A) Y = 2.36 + (0.38 × Pcrit) + (3.19 × Responsiveness0.5) [Pcrit: P = 0.02; Responsiveness: P = 0.04], (B) Y = 3.31 + (0.63 × Pcrit) − (3.56 × Effectiveness) [Pcrit: P = 0.02; Effectiveness: P = 0.03]. BMI = body mass index; EMGgg = genioglossus EMG; Pcrit = critical closing pressure.

Comment in

References

    1. Peppard PE, Young T, Barnet JH, Palta M, Hagen EW, Hla KM. Increased prevalence of sleep-disordered breathing in adults. Am J Epidemiol. 2013;177:1006–1014. - PMC - PubMed
    1. Eckert DJ, White DP, Jordan AS, Malhotra A, Wellman A. Defining phenotypic causes of obstructive sleep apnea. Identification of novel therapeutic targets. Am J Respir Crit Care Med. 2013;188:996–1004. - PMC - PubMed
    1. Jordan AS, Wellman A, Edwards JK, Schory K, Dover L, MacDonald M, Patel SR, Fogel RB, Malhotra A, White DP. Respiratory control stability and upper airway collapsibility in men and women with obstructive sleep apnea. J Appl Physiol (1985) 2005;99:2020–2027. - PMC - PubMed
    1. McGinley BM, Schwartz AR, Schneider H, Kirkness JP, Smith PL, Patil SP. Upper airway neuromuscular compensation during sleep is defective in obstructive sleep apnea. J Appl Physiol (1985) 2008;105:197–205. - PMC - PubMed
    1. Pahkala R, Seppa J, Ikonen A, Smirnov G, Tuomilehto H. The impact of pharyngeal fat tissue on the pathogenesis of obstructive sleep apnea. Sleep Breath. 2014;18:275–282. - PubMed

Publication types

MeSH terms